- Disclaimer
- List of Tables
- List of Figures
- List of Appendices
- Executive Summary
- Introduction
- Methods
- Results
- Summary of Results, 1993-2004
- Public Use Dataset
- Prevention Activities
- Uses of HSEES Data
- References
Download Adobe Acrobat (PDF) version - 475KB
Historical Document
This document is provided by the Agency for Toxic Substances and Disease Registry (ATSDR) ONLY as an historical reference for the public health community. It is no longer being maintained and the data it contains may no longer be current and/or accurate.
In 1980, Congress created the Agency for Toxic Substances and Disease Registry (ATSDR) to implement health-related sections of laws that protect the public from hazardous wastes and environmental spills of hazardous substances. The Comprehensive Environmental Response, Compensation, and Liability Act of 1980 (CERCLA), commonly known as the "Superfund" Act, designated ATSDR as the lead agency within the Public Health Service to help prevent or reduce further exposure to hazardous substances and the adverse health effects that result from such exposures, and also to expand the knowledge base about such effects.
This publication reports the results and findings of a health study, registry, or other health-related activity supported by ATSDR in accordance with its legislative mandate described above.
Comments regarding this report are welcome. Please send your comments to the following address:
Agency for Toxic Substances and Disease Registry
Attn: Director, Division of Health Studies (E-31)
1600 Clifton Road, N.E.
Atlanta, Georgia 30333
Centers For Disease Control and Prevention
Julie L. Gerberding, MD, MPH, Director
Agency for Toxic Substances and Disease Registry
Howard Frumkin, MD, DrPH, Director
Division of Health Studies
G. David Williamson, PhD, Director
Sharon Campolucci, MSN, Deputy Director
Anne Sowell, PhD, Assistant Director for Science
Surveillance and Registries Branch
Vikas Kapil, D.O., M.P.H., Chief
Hazardous Substances Emergency Events Surveillance Staff
Norys Guerra MD, MPH
Kevin Horton, MSPH
Natalia Melnikova, MD, PhD
Maureen Orr, MS
Perri Zeitz Ruckart, MPH
Casetta R. Simmons
Wendy Wattigney, MStat
Jennifer Wu, Mstat
Contents
Use of trade names and commercial sources is for identification only and does not imply endorsement by the Agency for Toxic Substances and Disease Registry or the U.S. Department of Health and Human Services.
List of Tables
Table 2 – Number of substances involved per event, by type of event—Hazardous Substances Emergency Events Surveillance, 2004
Table 3 – Industries involved in hazardous substance events, by category—Hazardous Substances Emergency Events Surveillance, 2004
Table 4 – Number of substances involved, by substance category and type of event— Hazardous Substances Emergency Events Surveillance, 2004
Table 5 – Number of victims per event, by type of event—Hazardous Substances Emergency Events Surveillance, 2004
Table 6 – Frequency of substance categories in all events and events with victims— Hazardous Substances Emergency Events Surveillance, 2004
Table 7 – Frequencies of injuries/symptoms, by type of event—Hazardous Substances Emergency Events Surveillance, 2004
Table 8 – Distribution of personnel who responded to the event—Hazardous Substances Emergency Events Surveillance, 2004
Table 9 – Cumulative data by year—Hazardous Substances Emergency Events Surveillance, 1993–2004
Table 10 – Time period each state participated in Hazardous Substances Emergency Events Surveillance, 1993-2004
List of Figures
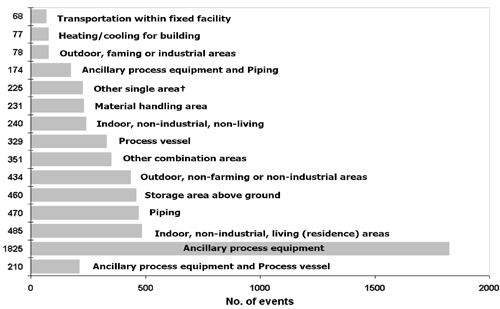
Figure 1 – Areas of fixed facilities involved in events—Hazardous Substances Emergency Events Surveillance, 2004
Figure 2 – Distribution of transportation-related events, by type of transport—Hazardous Substances Emergency Events Surveillance, 2004
Figure 3a – Primary factors reported as contributing to events by type of event—Hazardous Substances Emergency Events Surveillance, 2004
Figure 3b – Secondary factors reported as contributing to events—Hazardous Substances Emergency Events Surveillance, 2004
Figure 4 – Number of victims, by population group and type of event—Hazardous Substances Emergency Events Surveillance, 2004
Figure 5a – Distribution of responders injured in fixed-facility events, by type of responder— Hazardous Substances Emergency Events Surveillance, 2004
Figure 5b – Distribution of responders injured in transportation events— Hazardous Substances Emergency Events Surveillance, 2004
Figure 6 – Injury disposition—Hazardous Substances Emergency Events Surveillance, 2004
Figure 7 – Number of victims, by category and year—Hazardous Substances Emergency Events Surveillance, 1993–2004
List of Appendices
Appendix
A – The 96 substances most frequently involved in events-Hazardous
Substances Emergency Events Surveillance, 2004
Appendix
B – Publications reference list
Executive Summary
The Hazardous Substances Emergency Events Surveillance (HSEES) system, maintained by the Agency for Toxic Substances and Disease Registry (ATSDR), actively collects information to describe the public health consequences of acute releases of hazardous substances in 15 states. This report summarizes the characteristics of events reported to ATSDR by all participating state health departments in 2004. Information about acute events involving hazardous substances was collected, including the substance(s) released, number of victims, number and types of injuries, and number of evacuations. The data were computerized using an ATSDR-provided Web-based data entry system.
A total of 7,744 events was reported. In 6,835 (88.3%) events, only one substance was released. The most commonly reported categories of substances were other inorganic substances (excluding chemicals in the categories of acids, bases, ammonia, and chlorine), volatile organic compounds, and mixtures involving substances from different categories that were mixed or formed from a reaction before release. During this reporting period, 620 events (8.0% of all reported events) resulted in a total of 1,838 victims, 41 of whom (2.4%) died. The most frequently reported injuries were respiratory irritation, headaches, and dizziness/central nervous system symptoms. Evacuations were ordered for 499 (6.4%) events.
Findings regarding the percentage of events involving victims and the distribution of types of injuries reported have been consistent in recent years. Topics targeted in 2004 included 1) disaster preparedness, 2) methamphetamine lab awareness activities, 3) outreach to specific groups using ammonia, chlorine, cleaning products, acids, and mercury, 4) outreach to targeted populations including children, responders, the transportation industry, and 5) special interest topics including carbon monoxide poisonings from underground utility fires and exposure to tearing agents from theft deterrent devices.
The Centers for Disease Control and Prevention defines
surveillance as the
"ongoing, systematic collection, analysis, and
interpretation of health data essential to the planning, implementation, and
evaluation of public health practice, closely integrated with the timely
dissemination of these data to those who need to know. The final link of the
surveillance chain is the application of these data to prevention and control. A
surveillance system includes a functional capacity for data collection,
analysis, and dissemination linked to public health programs"
[1].
Since 1990, the Agency for Toxic Substances and Disease Registry (ATSDR) has maintained an active, state-based Hazardous Substances Emergency Events Surveillance (HSEES) system to describe the public health consequences of releases of hazardous substances. The decision to initiate a surveillance system of this type was based on a study published in 1989 about the reporting of hazardous substances releases to three national databases: the National Response Center Database, the Hazardous Material Information System (HMIS), and the Acute Hazardous Events Database [2].
A review of these databases indicated limitations. Many events were missed because of specific reporting requirements (for example, the HMIS did not record events involving intrastate carriers or fixed-facility events). Other important information was not recorded, such as the demographic characteristics of victims, the types of injuries sustained, and the number of persons evacuated. As a result of this review, ATSDR implemented the HSEES system to more fully describe the public health consequences of releases of hazardous substances.
HSEES has several goals:
For a surveillance system to be useful, it must not only be a repository for data, but the data must also be used to protect public health.
In the last few years, the last goal of the HSEES system has been emphasized; i.e., to develop strategies to reduce subsequent morbidity and mortality by having each participating state analyze its data and develop appropriate prevention outreach activities. These activities are intended to provide industry, responders, and the general public with information that can help prevent chemical releases and reduce morbidity and mortality if a release occurs.
This report provides an overview of HSEES for 2004 in all participating states, summarizes the characteristics of acute releases of hazardous substances and their associated public health consequences, and demonstrates how data from the system are translated into prevention activities to protect public health.
In 2004, 15 state health departments participated in HSEES: Alabama, Colorado, Iowa, Louisiana, Minnesota, Mississippi, Missouri, North Carolina, New Jersey, New York, Oregon, Texas, Utah, Washington, and Wisconsin. Alabama and Mississippi, however, did not collect a full year of data, so their data are excluded from this report. Information was collected about each event, including substance(s) released, victims, injuries (adverse health effects and symptoms), and evacuations.
Various data sources were used to obtain information about these events. These sources included records and oral reports of state environmental protection agencies, the U.S. Department of Transportation, the National Response Center, police and fire departments, and hospitals. U.S. Census Bureau data were used to estimate the number of residents in the vicinity of the events. All data were computerized using a Web-based data entry system provided by ATSDR.
HSEES defines hazardous substances emergency events as acute uncontrolled or illegal releases or threatened releases of hazardous substances. Events involving releases of only petroleum are excluded. Events are included if (a) the amount of substance released (or that might have been released) needed (or would have needed) to be removed, cleaned up, or neutralized according to federal, state, or local law, or (b) the release of a substance was threatened, but the threat led to an action (for example, evacuation) that could have affected the health of employees, emergency responders, or members of the general public. HSEES defines victims as persons who experience at least one documented adverse health effect within 24 hours after the event or who die as a consequence of the event. Victims who receive more than one type of injury or symptom are counted once for each applicable injury type or symptom. Events are defined as transportation-related if they occur (a) during surface, air, pipeline, or water transport of hazardous substances, or (b) before the substance is unloaded from a vehicle or vessel. All other events are considered fixed-facility events.
For data analyses, the substances released were categorized into 16 groups. The category “mixture” comprises substances from different categories that were mixed or formed from a reaction before the event; the category “other inorganic substances” comprises all inorganic substances except acids, bases, ammonia, and chlorine; and the category “other” comprises substances that could not grouped into one of the existing categories.
For 2004, HSEES received reports of 7,744 acute hazardous substances events; 256 (3.3%) of these events were threatened releases; 48 (0.6%) were events in which substances were both threatened to be released and actually released. The number of events occurring in fixed facilities was 5,687 (73.4%) while 2,057 (26.6%) occurred during transportation. Two states, Texas and New York, reported 43.7% of all releases (Table 1).
Table 1 - Number of events meeting the surveillance definition, by state and type of event
|
State |
Type of event |
Total No. events (%) |
||||
| Fixed facility |
Transportation |
|||||
| No. events |
% * |
No. events |
% * |
|||
|
|
54 |
30.2 |
125 |
69.8 |
179 |
(2.3) |
|
|
244 |
69.9 |
105 |
30.1 |
349 |
(4.5) |
|
|
474 |
84.0 |
90 |
16.0 |
564 |
(7.3) |
|
|
325 |
69.4 |
143 |
30.6 |
468 |
(6.0) |
|
|
148 |
49.3 |
152 |
50.7 |
300 |
(3.9) |
|
|
201 |
52.6 |
181 |
47.4 |
382 |
(4.9) |
|
|
444 |
76.4 |
137 |
23.6 |
581 |
(7.5) |
|
|
820 |
75.5 |
266 |
24.5 |
1086 |
(14.0) |
|
|
161 |
70.0 |
69 |
30.0 |
230 |
(3.0) |
|
|
1959 |
85.2 |
339 |
14.8 |
2298 |
(29.7) |
|
|
397 |
78.8 |
107 |
21.2 |
504 |
(6.5) |
|
|
261 |
69.6 |
114 |
30.4 |
375 |
(4.8) |
|
|
199 |
46.5 |
229 |
53.5 |
428 |
(5.5) |
| Total |
5687 |
73.4 |
2057 |
26.6 |
7744 |
(100.0) |
| * Percentage = (number of events by type of event per state/total number of events in that state) x 100 |
||||||
For each fixed-facility event, reporters could select one or two types of area or equipment involved in the fixed facility where the event occurred. Of all 5,687 fixed-facility events, 4,922 (86.5%) reported one type of area and 735 (12.9%) reported a combination of two area types. Type of area was not reported for 30 (0.5%) events. The main areas were classified as follows: 1,825 (32.3%) ancillary processing equipment, 485 (8.6%) indoor, non-industrial, living areas, 470 (8.3%) piping, 460 (8.1%) storage above ground (Figure 1).
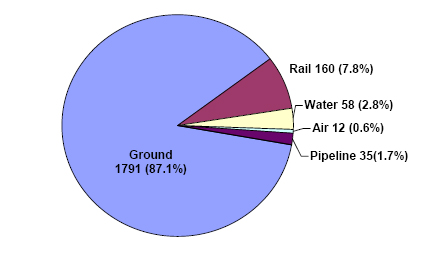
Of the 2,057 transportation-related events, 1,791 (87.1%) occurred during ground transport (e.g., truck, van, or tractor) and 160 (7.8%) involved transport by rail (Figure 2). Fewer events involved water, air, and pipeline transportation modes. Most ground transportation events (78.2%) involved trucks. The largest proportions of transportation-related events occurred during unloading of a stationary vehicle or vessel (688 [38.4%]) and from a moving vehicle or vessel (594 [28.9%]). Of the 2057 transportation-related events, 450 (21.9%) involved releases en route that were later discovered at fixed facilities.
Figure 2. Distribution of transportation-related events, by type of transport—
Hazardous Substances Emergency Events Surveillance, 2004
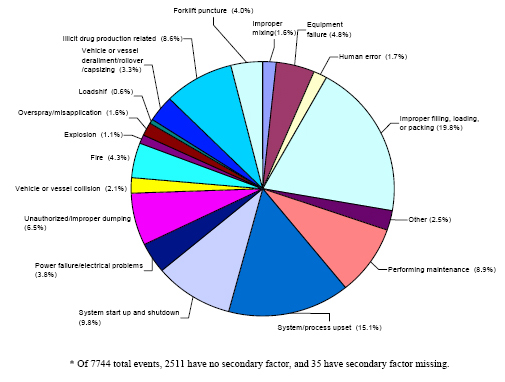
Factors consisted of primary (root) and secondary (contributing) causes. Primary factors were reported for 7,673 (99.1%) events (Figure 3a). Primary factors most reported for fixed-facility events, 3,152 (56.0%) involved equipment failure, and most reported for transportation-related events 1,314 (64.4%) involved human error. Secondary factors were reported for 5,198 (67.1%) events (Figure 3b). Of the reported secondary factors, most fixed-facility events 780 (21.3%) involved system/process upset, and most transportation-related events 761 (49.8%) involved improper filling, loading, or packing.
Figure 3a. Primary factors reported as contributing to events, by type of events — Hazardous Substances Emergency Events Surveillance, 2004
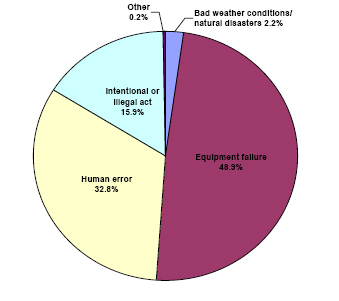
Figure 3b. Secondary factors reported as contributing to events — Hazardous Substances Emergency Events Surveillance, 2004
More than 6,835 (88.3%) of all events involved the release of only one substance. Two substances were released in approximately 354 (4.6%) of the events, and more than two substances were released in approximately 555 (7.2%) (Table 2). Fixed-facility events were more likely to have two or more substances released in an event than transportation events (13.8% vs. 6.1%).
Table 2 - Number of substances involved per event, by type of event—Hazardous Substances Emergency Events Surveillance, 2004
| No. substances |
Type of event |
All events |
|||||||
| Fixed facility |
Transportation |
||||||||
| No. events |
% |
Total substances |
No. events |
% |
Total substances |
No. events |
% |
Total substances |
|
| 1 |
4904 |
86.2 |
4904 |
1931 |
93.9 |
1931 |
6835 |
88.3 |
6835 |
| 2 |
277 |
4.9 |
554 |
77 |
3.7 |
154 |
354 |
4.6 |
708 |
| 3 |
110 |
1.9 |
330 |
31 |
1.5 |
93 |
141 |
1.8 |
423 |
| 4 |
276 |
4.9 |
1104 |
9 |
0.4 |
36 |
285 |
3.7 |
1140 |
|
≥ 5 |
120 |
2.1 |
1135 |
9 |
0.4 |
82 |
129 |
1.7 |
1217 |
| Total |
5687 |
100.0 |
8027 |
2057 |
100.0 |
2296 |
7744 |
100.0 |
10323 |
The number of events by month ranged from 574 (7.4%) in February to 760 (9.8%) in July, with the summer months having the highest number of events. The proportion of events ranged from 15.3% to 17.0% during weekdays, and from 8.8% to 9.7% during weekend days. Of all 7,580 (97.9%) events for which time of day or time category was reported, 35.5% occurred from 6:00 AM to 11:59 AM, 32.5% from 12:00 PM to 5:59 PM, 17.3% from 6:00 PM to 11:59 PM, and the remainder between midnight and 6:30 AM.
The largest number of HSEES events were associated with the manufacturing (2,969 [38.3%]) and transportation (1,854 [23.9%]) industries (Table 3). Within manufacturing, chemical and allied products manufacturing (1,506 [50.7%]) and petroleum and coal manufacturing (970 [32.7%]) accounted for most of the events. The largest number of events with victims occurred in the transportation industry (96 [15.5%]). The total number of victims was greatest in professional services (340 [18.5%]), followed by the manufacturing industry (338 [18.4%]) and transportation (319 [17.4%]). The subcategory food and kindred products manufacturing accounted for 26% of all victims in the manufacturing industry. Although the manufacturing industry resulted in a large proportion of events with victims and a large number of victims, only 2.6% of all manufacturing events involved victims. Conversely, 34.0% of all events in private vehicles or property involved victims, however they constituted only a small proportion (5.6%) of events with victims.
Table 3 - Industries involved in hazardous substance events, by category
| Industry Category |
Total events |
Event with victims |
Percentage of events with victims |
Total no. victims |
|||
| No. |
% |
No. |
% |
Number (maximum)* |
|||
| Agriculture |
197 |
2.5 |
22 |
3.5 |
11.2 |
38 |
(8) |
| Mining |
180 |
2.3 |
5 |
0.8 |
2.8 |
6 |
(2) |
| Construction |
112 |
1.4 |
21 |
3.4 |
18.8 |
48 |
(7) |
| Manufacturing |
2969 |
38.3 |
78 |
12.6 |
2.6 |
338 |
(36) |
| Transportation |
1854 |
23.9 |
96 |
15.5 |
5.2 |
319 |
(50) |
| Communications |
5 |
0.1 |
0 |
0.0 |
0.0 |
0 |
(0) |
| Utilities |
502 |
6.5 |
33 |
5.3 |
6.6 |
65 |
(9) |
| Wholesale trade |
346 |
4.5 |
15 |
2.4 |
4.3 |
54 |
(40) |
| Retail trade |
149 |
1.9 |
31 |
5.0 |
20.8 |
118 |
(22) |
| Finance and real estate |
53 |
0.7 |
14 |
2.3 |
26.4 |
51 |
(12) |
| Business and repair services |
56 |
0.7 |
12 |
1.9 |
21.4 |
17 |
(3) |
| Personal services |
192 |
2.5 |
53 |
8.5 |
27.6 |
102 |
(28) |
| Entertainment |
39 |
0.5 |
10 |
1.6 |
25.6 |
32 |
(9) |
| Professional services |
210 |
2.7 |
55 |
8.9 |
26.2 |
340 |
(57) |
| Public administration |
71 |
0.9 |
16 |
2.6 |
22.5 |
56 |
(11) |
| Abandoned facilities |
159 |
2.1 |
5 |
0.8 |
3.1 |
14 |
(5) |
| Private vehicle or property |
103 |
1.3 |
35 |
5.6 |
34.0 |
42 |
(4) |
| Illegal activity (non-illicit drug related) |
87 |
1.1 |
17 |
2.7 |
19.5 |
41 |
(7) |
| Illegal activity (illicit drug related) |
414 |
5.3 |
90 |
14.5 |
21.7 |
139 |
(5) |
| Unspecified and unknown |
46 |
0.6 |
12 |
1.9 |
26.1 |
18 |
(4) |
| Total‡ |
7744 |
100.0 |
620 |
100.0 |
8.0 |
1838 |
(57) |
| * Minimum number of victims per event = 1. |
|||||||
*Minimum number of victims per event=1.
†Includes chemical dumped on highway or other property and currently non-operating former business.
‡Percentages do not total 100% because of rounding.
The number of substances were released in all events was 10,323, of which 814 (7.9%) substances were reported as threatened to be released. The substances most frequently released were sulfur dioxide, carbon monoxide, ammonia, and nitrogen oxide (NOX) (Appendix A). Substances were grouped into 16 categories. The substance categories most commonly released in fixed-facility events were other inorganic substances (2,044 [25.5%]), volatile organic compounds (1,544 [19.3%]), and mixtures (1,181 [14.7%]) (Table 4). In transportation-related events, the most common substance categories released were volatile organic compounds (377 [16.5%]), acids (313 [13.7%]), and pesticides (245 [10.7%]).
Two types of releases (e.g., spill and air) could be reported for each substance. Single releases were associated with air releases (4,850 [47.0%]), spills (4,179 [40.5%]), threatened releases (815 [7.9%]), fire (425 [4.1%]), explosion (32 [0.3%]), and radiation (19 [0.2%]). Of events with two types of releases, the following combinations were reported: spill and air releases (389 [72.7%]), spill and fire (61 [11.4%]), air releases and fire (43 [8%]), fire and explosion (19 [3.6%]), spill and explosion (11 [2.1%]), air releases and explosion (11 [2.1%]), and the remaining 1 (0.2%) involved other combinations of release types. The release type was missing for 3 substances.
Table 4 - Number of substances involved, by substance category and type of event
| Substance category |
Type of Event |
All Events |
||||
| Fixed facility |
Transportation |
|||||
| No. substances |
% |
No. substances |
% |
No. substances |
% |
|
| Acids |
517 |
6.4 |
313 |
13.7 |
830 |
8.1 |
| Ammonia |
391 |
4.9 |
80 |
3.5 |
471 |
4.6 |
| Bases |
209 |
2.6 |
201 |
8.8 |
410 |
4.0 |
| Chlorine |
162 |
2.0 |
34 |
1.5 |
196 |
1.9 |
| Formulations |
12 |
0.1 |
2 |
0.1 |
14 |
0.1 |
| Hetero-organics |
98 |
1.2 |
28 |
1.2 |
126 |
1.2 |
|
Hydrocarbons |
102 |
1.3 |
64 |
2.8 |
166 |
1.6 |
| Mixture across chemical category* |
1181 |
14.7 |
80 |
3.5 |
1261 |
12.2 |
| Other † |
480 |
6.0 |
195 |
8.5 |
675 |
6.5 |
| Other inorganic substances ‡ |
2044 |
25.5 |
201 |
8.8 |
2245 |
21.8 |
| Oxy-organics |
734 |
9.2 |
190 |
8.3 |
924 |
9.0 |
| Paints & dyes |
123 |
1.5 |
143 |
6.2 |
266 |
2.6 |
| PCB's |
85 |
1.1 |
9 |
0.4 |
94 |
0.9 |
| Pesticides |
249 |
3.1 |
245 |
10.7 |
494 |
4.8 |
| Polymers |
85 |
1.1 |
130 |
5.7 |
215 |
2.1 |
| Volatile organic compounds |
1544 |
19.3 |
377 |
16.4 |
1921 |
18.6 |
| Total ¶ |
8016 |
100.0 |
2292 |
100.0 |
10308 |
100.0 |
| * substances from different categories that were mixed or formed from a reaction before the event. † Not belonging to one of the existing categories. ‡ All inorganic substances except for acids, bases, ammonia, and chloring. ¶ Of 10,323 total substances, 15 were excluded because they were not assigned a substance category. |
||||||
The member of victims involved was 1,838 in 620 events (8.0% of all events) (Table 5). Of the 620 events with victims, 376 (60.7%) involved only one victim, and 87 (14.0%) involved two victims. Of all victims, 1,452 (79.0%) were injured in fixed-facility events. Fixed-facility events were more likely to have three or more victims per event (28.7%) than were transportation-related events (15.3%). An additional 453 persons in 158 events (2.1% of all events) were observed at a hospital or medical facility but did not have symptoms resulting from the event and were not, therefore, counted as victims.
Table 5 - Number of victims per event, by type of event
No. victims |
Type of event |
All events |
|||||||
Fixed facility |
Transportation |
||||||||
No. events |
% |
Total victims |
No. events |
% |
Total victims |
No. events |
% |
Total victims |
|
1 |
268 |
57.9 |
268 |
108 |
68.8 |
108 |
376 |
60.6 |
376 |
2 |
62 |
13.4 |
124 |
25 |
15.9 |
50 |
87 |
14.0 |
174 |
3 |
32 |
6.9 |
96 |
7 |
4.5 |
21 |
39 |
6.3 |
117 |
4 |
29 |
6.3 |
116 |
8 |
5.1 |
32 |
37 |
6.0 |
148 |
5 |
15 |
3.2 |
75 |
1 |
0.6 |
5 |
16 |
2.6 |
80 |
≥6 |
57 |
12.3 |
773 |
8 |
5.1 |
170 |
65 |
10.5 |
943 |
Total |
463 |
100.0 |
1452 |
157 |
100.0 |
386 |
620 |
100.0 |
1838 |
To represent the magnitude of the effects of substances involved in injuries, the number of events in a specific substance category was compared with the number of events in the same substance category that involved victims. In events that involved one or more substances from a specific substance category, substances were counted once in that category. In events that involved two or more substances from different categories, substances were counted once in the multiple substance categories. Substances released most often were not necessarily the most likely to involve victims (Table 6). For example, events categorized as other inorganic substances constituted 19.5% of all events; however, only 4.8% of these events resulted in injuries. Conversely, events involving chlorine exclusively accounted for 2.2% and those involving ammonia exclusively 5.2% of all events, but 23.0% of the chlorine events and 12.3% of ammonia events involved injuries.
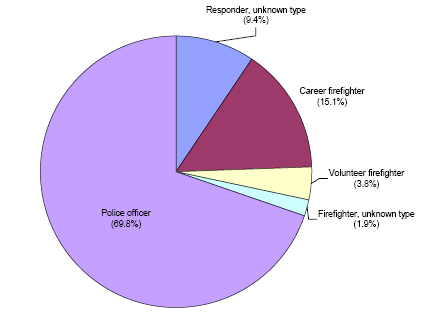
Employees (837 [45.5%]) constituted the largest proportion of the population groups injured, followed by members of the general public (640 [34.8%]) (Figure 4). In fixed-facility events, 166 emergency response personnel were injured. Of those, 92 (55.4%) were police officers, 46 (27.7%) were career firefighters, and 11 (6.6%) were volunteer firefighters (Figure 5a, 5b). In transportation-related events, 53 responders were injured; most these (37 [69.8%]) were police officers, 8 (15.1%) were career firefighters, and 5 (9.4%) were responders of unknown type. Police officers were injured more frequently in transportation related events (69.8%) than in fixed-facility events (55.4%).
Table 6 - Frequency of substance categories in all events and events with victims*
Substance category |
All events |
Events with victim |
|||
No. |
% |
No. |
Percentage of all releases with victims |
Percentage of events with victims in substance category |
|
Acids |
556 |
7.2 |
53 |
8.6 |
9.5 |
Ammonia |
407 |
5.3 |
43 |
6.9 |
10.6 |
Bases |
310 |
4.0 |
31 |
5.0 |
10.0 |
Chlorine |
185 |
2.4 |
42 |
6.8 |
22.7 |
Formulations |
11 |
0.1 |
0 |
0.0 |
0.0 |
Hetero-organics |
56 |
0.7 |
2 |
0.3 |
3.6 |
Hydrocarbons |
101 |
1.3 |
4 |
0.6 |
4.0 |
Mixture across chemical category† |
596 |
7.7 |
57 |
9.2 |
9.6 |
Multi-chemical category |
1085 |
14.0 |
69 |
11.1 |
6.4 |
Other‡ |
1237 |
16.0 |
61 |
9.9 |
4.9 |
Other inorganic substances§ |
1227 |
15.9 |
43 |
6.9 |
3.5 |
Oxy-organics |
603 |
7.8 |
86 |
13.9 |
14.3 |
Paints & dyes |
233 |
3.0 |
6 |
1.0 |
2.6 |
PCB's |
91 |
1.2 |
0 |
0.0 |
0.0 |
Pesticides |
371 |
4.8 |
36 |
5.8 |
9.7 |
Polymers |
201 |
2.6 |
17 |
2.7 |
8.5 |
Volatile organic compounds |
466 |
6.0 |
69 |
11.1 |
14.8 |
Total ¶ |
7736 |
100.0 |
619 |
100.0 |
8.0 |
* Substances in events that involved multiple substances were counted only once in a substance category when all the substances were associated with the same category. If events involved multiple substances from different substance categories, they were counted only once in the multiple substance category. |
|||||
† Substances from different categories that were mixed or formed from a reaction before the event. |
|||||
‡ Not classified. |
|||||
§ All inorganic substances except for acids, bases, ammonia, and chlorine. |
|||||
¶ Of 7,744 total events, 8 were excluded because they were not assigned a substance category. These 8 involved one substance each. One of the excluded events had victims. |
|||||
Employees (837 [45.5%]) constituted the largest proportion of the population groups injured, followed by members of the general public (640 [34.8%]) (Figure 4). In fixed-facility events, 166 emergency response personnel were injured. Of those, 92 (55.4%) were police officers, 46 (27.7%) were career firefighters, and 11 (6.6%) were volunteer firefighters (Figure 5a, 5b). In transportation-related events, 53 responders were injured; most these (37 [69.8%]) were police officers, 8 (15.1%) were career firefighters, and 5 (9.4%) were responders of unknown type. Police officers were injured more frequently in transportation related events (69.8%) than in fixed-facility events (55.4%).
Figure 4. Number of victims, by population group and type of event—Hazardous
Substances Emergency Events Surveillance, 2004
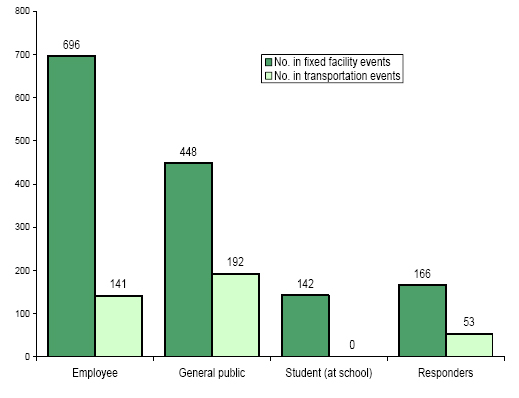
Figure 5a. Distribution of responders injured in fixed facility events, by type of responder
—Hazardous Substances Emergency Events Surveillance, 2004
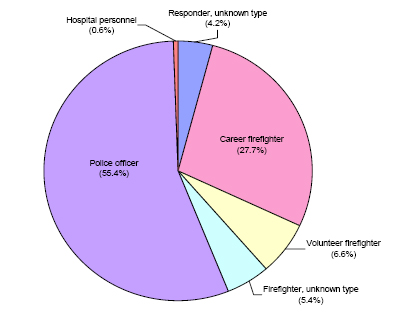
Figure 5b. Distribution of responders injured in transportation events, by type of
responder—Hazardous Substances Emergency Events Surveillance, 2004
Victims were reported to sustain a total of 2,977 injuries or symptoms (Table 7). Some victims had more than one injury or symptom. Of all reported injuries or symptoms, the most common injuries or symptoms in fixed-facility events were respiratory irritation (755 [31.2%]), headaches (372 [15.4%]), and dizziness or central nervous system symptoms (352 [14.6%]). In transportation-related events, trauma (111 [19.8%]), respiratory irritation (100 [17.9%]), headaches (81 [14.5%]), and eye irritation (81 [14.5%]) were reported most frequently. Most (98.2%) of the trauma injuries in transportation-related events were not substance-related; these injuries resulted from a chain of events, such as a motor vehicle accident leading to the release of a hazardous substance, and not from exposure to the substance itself.
Table 7 - Frequencies of injuries/symptoms, by type of event*
| Injury/symptom | Fixed facility | Transportation | All events | |||
| No. injuries | % | No. injuries | % | Total no. injury | % | |
Burns§ |
143 | 5.9 | 22 | 3.9 | 165 | 5.5 |
Dizziness/central nervous system symptoms |
352 | 14.6 | 60 | 10.7 | 412 | 13.8 |
Eye irritation |
281 | 11.6 | 81 | 14.5 | 362 | 12.2 |
Gastrointestinal system problems |
284 | 11.8 | 64 | 11.4 | 348 | 11.7 |
Headache |
372 | 15.4 | 81 | 14.5 | 453 | 15.2 |
Heart problems |
7 | 0.3 | 6 | 1.1 | 13 | 0.4 |
Heat stress |
9 | 0.4 | 2 | 0.4 | 11 | 0.4 |
Other |
18 | 0.7 | 1 | 0.2 | 19 | 0.6 |
Respiratory irritation |
755 | 31.2 | 100 | 17.9 | 855 | 28.7 |
Shortness of breath |
66 | 2.7 | 12 | 2.1 | 78 | 2.6 |
Skin irritation |
76 | 3.1 | 20 | 3.6 | 96 | 3.2 |
Trauma† |
54 | 2.2 | 111 | 19.8 | 165 | 5.5 |
| Total | 2417 | 100.0 | 560 | 100.0 | 2977 | 100.0 |
* The number of injuries is greater than the number of victims (1,838) because a victim could have had more than one injury. † Of the 165 trauma injuries, 23 were chemical-related, 141 were not chemical-related, 1 was both chemical and non-chemical related, and the type of trauma was missing for 13 injuries. § Of the 165 burns injuries, 89 were chemical-related, 55 were thermal, 21 were both. |
||||||
The median age of the 834 (45.4%) victims for whom exact age was reported was 32 years (range: 0–87 years). For the 1,355 (73.7%) injured persons for whom an age category was reported, 37 (2.7%) were < 5 years of age, 149 (11%) were 5–14 years of age, 111 (8.2%) were 15–19 years of age, 768 (56.7%) were 20–44 years of age, 254 (18.8%) were 45–64 years of age, and 36 (2.7%) were >65 years of age. Of the 1,004 injured persons for whom age was not reported, 642 (63.9%) were presumably adults (because their population group was reported as responders or employees), and 362 (36.1%) could have been adults or children (because their population group was reported as members of the general public).
Sex was known for 1,538 (83.7%) of the victims; of these, 1,011 (65.7%) were males. Of all employees and responders for whom sex was reported, 72.8% were males.
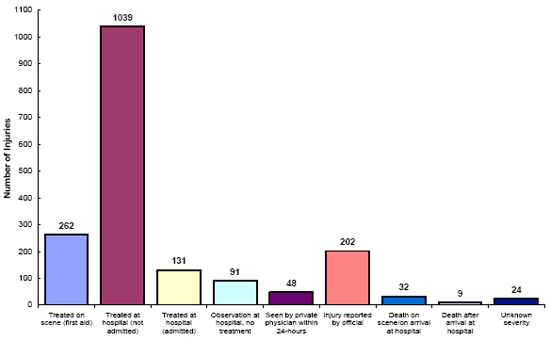
Of the 1,838 victims, 1,039 (56.5%) were treated at hospitals without admission, and 262 (14.3%) were treated at the scene; 41 (2.2%) deaths were reported (Figure 6). Severity was unknown for 24 (1.3%) victims. Whether personal protective equipment (PPE) was used was reported for 784 (93.7%) employee-victims and for 207 (94.5%) responder-victims. Most of the employee-victims (94.5%) and 36.2% of the responder-victims had not worn any form of PPE. Employee-victims who wore PPE most often used eye protection (10 [23.3%]) and gloves (18 [41.86%]). Among injured emergency responders who wore PPE, 30 (22.7%) wore firefighter turnout gear with respiratory protection, 41 (31.1%) wore gloves, and 34 (25.8%) wore firefighter turnout gear without respiratory protection. Firefighter turnout gear is protective clothing usually worn by firefighters during structural firefighting operations and is similar to Level ”D” protection. The Occupational Safety and Health Administration defines Level “D” protection as coveralls, boots/shoes (chemical-resistant leather, steel toe and shank), safety glasses or chemical splash goggles, and hard hats. Level “D” provides limited protection against chemical hazards.
Only one event involved more than 50 injured persons; 57 employees were injured due to improper mixing of a chemical that caused a hydrochloride/phenol volatilization in a physicians’ clinic. All the victims reported dizziness or central nervous system symptoms; 37 employee-victims and 18 general public-victims were treated with first aid on the scene; 57 persons were self-evacuated from the building for 22 hours, and access to the building was restricted. A fire department and certified HazMat team responded to this event.
Figure 6. Injury disposition—Hazardous Substances Emergency Events Surveillance, 2004
The proximity of an event location to selected populations was determined using geographic information systems (GIS) or health department records. Reported residences were within ¼ mile of 4,693 (61.8%) events, schools within ¼ mile of 926 (12.3%) events, hospitals within ¼ mile of 99 (1.3%) events, nursing homes within ¼ mile of 261 (3.5%) events, licensed daycare centers within ¼ mile of 901 (12.2%) events, industries or other businesses within ¼ mile of 5,832 (79.2%) events, and recreational areas within ¼ mile of 895 (11.9%) events. Information for proximity of the event location to selected populations was missing for 153-385 events.
The number of events at which persons were at risk of exposure was determined primarily using GIS. There were 5,246 (70.1%) events with persons living within ¼ mile of the event; 6,182 (82.7%) events with persons living within ½ mile; and 6,608 (88.4%) events with persons living within 1 mile. Information was missing on the number of persons living within ¼ mile for 264 events, ½ mile for 265 events, and 1 mile for 267 events.
Evacuations were ordered in 499 (6.5%) of 7,683 events for which where evacuation status was reported. Of these evacuations, 76.7% were of buildings or affected parts of buildings; 13% were of defined circular areas surrounding the event locations; 3.5% were of areas downwind or downstream of the event; and 3.9% were of circular and downwind or downstream areas. The number of persons evacuated was known for 424 (85.0%) events and ranged from 1 to 3,000 persons, with a median of 20. However, one ordered evacuation was reported as having no evacuees. The median length of evacuation was 2 hours (range: 12 minutes to 85 days). Evacuation length was missing for 43 (8.6%) events, and one event reported 0 hours. Of all 7,744 events, 1,820 (23.5%) had access to the area restricted; 97 (1.3%) events had in-place sheltering ordered by an official.
Of the 1,766 (96.0%) victims for whom decontamination status was known, 1,483 (84.0%) were not decontaminated, 157 (8.9%) were decontaminated at the scenes, 101 (5.7%) were decontaminated at medical facilities, and 25 (1.4%) were decontaminated at both the scenes and medical facilities.
For events in which uninjured persons were decontaminated, the median number of uninjured decontaminated individuals was 3 persons per event (range: 1–100 persons). Decontamination was done at medical facilities for 4 uninjured employees, 3 uninjured responders, and 20 uninjured members of the general public. Decontamination was done at the scenes for 144 uninjured employees, 451 uninjured responders, 140 uninjured members of the general public, and 72 uninjured students.
Of the 7,706 events with information on response to the event, 790 (10.3%) events reported no response. Reported for 1,694 (22.0%) events, were multiple responders, 807 (11.7%) events reported 2 categories of responders, 482 (7.0%) events reported 3 categories, 241 (3.5%) events reported 4 categories, and 405 (5.9%) events reported 5 or more categories. Of the 10,140 responder counts, the most frequent response team was from the company where the release occurred 5,212 (51.4%), followed by fire departments 1,299 (12.8%), law enforcement agencies 1,213 (12.0%), and certified HazMat teams 881 (8.7%) (Table 8).
Table 8 - Distribution of personnel who responded to the event
Responder category |
No. responers |
% of events |
Certified HazMat team |
881 |
11.4 |
Company's response team |
5212 |
67.6 |
Emergency medical technicians |
419 |
5.4 |
Environmental agency |
628 |
8.1 |
EPA† response team |
30 |
0.4 |
Fire department |
1299 |
16.9 |
Health department/health agency |
146 |
1.9 |
Hospital personnel |
6 |
0.1 |
Law enforcement agency |
1213 |
15.7 |
Other |
306 |
4.0 |
No response |
790 |
10.3 |
Total |
10930* |
|
*Of 7744 total events, response information were missing for 38 events. Total (10930) greater than total number of events (7706) because multiple responder categories could be reported per event. † Environmental Protection Agency. |
||
Of the 5,687 events that occurred in fixed facilities, 3,502 (61.6%) were reported within 48 hours of occurrence while 649 (31.6%) of the 2,057 transportation events were reported within 48 hours. Of 7,744 events reported in 2004, the incident information for 4,151 (53.6%) events was entered into HSEES system in 48 hours, 1,173 (15.2%) were reported in less than 7 days, and 1,743 (22.5%) were reported more than one month after incidents happened. Because obtaining information about road-related releases from federal or states departments of transportation was not timely, 1,090 of 2,057 (53%) transportation events were reported more than one month after occurrence.
During 1993–2004, the largest proportion of events occurred in fixed facilities (Table 9). However, in recent years, the number of reported transportation-related events has increased partially due to the 1999 addition of the U.S. Department of Transportation’s Hazardous Materials Information System as a primary notification source for transportation events.
Table 9 ─ Cumulative data by year—1993-2004*
| Year |
No. Participating states |
Type of event |
No. substances released |
No. victim |
No. deaths |
Events with victims |
|||
| Fixed facility |
Transportation |
Total |
No. |
%† |
|||||
| 1993 |
11 |
3,199 |
634 |
3,833 |
4,361 |
2,230 |
16 |
464 |
12.1 |
| 1994 |
12 |
3,321 |
912 |
4,233 |
5,072 |
2,181 |
21 |
414 |
9.8 |
| 1995 |
14 |
4,273 |
1,037 |
5,310 |
6,027 |
1,688 |
14 |
402 |
7.6 |
| 1996 |
14 |
4,327 |
1,159 |
5,486 |
5,861 |
1,622 |
33 |
390 |
7.1 |
| 1997 |
13 |
4,385 |
1,128 |
5,513 |
6,089 |
1,896 |
28 |
372 |
6.7 |
| 1998 |
13 |
4,729 |
1,252 |
5,981 |
6,486 |
1,533 |
36 |
405 |
6.8 |
| 1999 |
13 |
4,634 |
1,626 |
6,260 |
6,974 |
1,912 |
30 |
504 |
8.0 |
| 2000 |
15 |
5,499 |
2,049 |
7,548 |
8,342 |
2,513 |
44 |
752 |
10.0 |
| 2001 |
16 |
6,736 |
2,242 |
8,978 |
11,764 |
2,168 |
22 |
710 |
7.9 |
| 2002 |
15 |
6,493 |
2,520 |
9,013‡ |
11,009 |
2,150 |
47 |
739 |
8.2 |
| 2003 |
15 |
6,782 |
2,323 |
9,105 |
12,018 |
1,835 |
51 |
720 |
7.9 |
| 2004 |
13 |
5,687 |
2,057 |
7,744 |
10,323 |
1,838 |
41 |
620 |
8.0 |
| Total |
60,065 |
18,939 |
69,991 |
94,326 |
23,566 |
383 |
6,492 |
8.3 |
|
| * Numbers in the table may differ from those reported in previous years because of adjustments in HSEES qualification requirements for events. † Percentage of events with victims. ‡The total number of events does not include one event occurring in 2002 because the type of event was not known. |
|||||||||
The number of substances released has also increased. The percentage of events with victims was highest in 1993 (12.1%) and lowest in 1997 (6.7%).
Respiratory irritation has consistently been the most frequently reported injury.
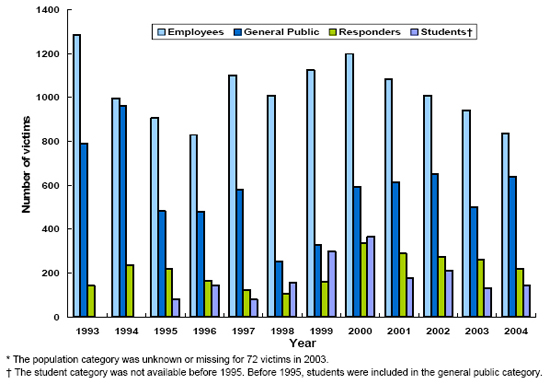
Employees continue to be the most commonly reported victims of acute chemical releases. However, in 2004 the percentage of employee victims was 45.5%, which is the second lowest year in the last 12 years (1994, 45.4%). Members of the general public constitute a large proportion of the victims as well (Figure 7). The number of injured responders has increased recently, and this increase likely results from police officers who are injured when responding to events involving the manufacture of methamphetamine.
The number of deaths associated with acute hazardous substances events has increased in recent years. Many of these deaths were attributed to nonchemical circumstances surrounding the events (e.g., a crash resulting from high-speed travel of a truck pulling an ammonia tank).
Figure 7. Number of victims, by category and year—Hazardous Substances Emergency Events Surveillance, 2004*
ATSDR has created a public-use HSEES dataset to enable public health professionals and other interested parties to perform their own analyses. A data dictionary provides users with detailed instructions for working with the dataset. This dataset is available for download from the ATSDR Web site. Data contained in the file are related to events that occurred in the 17 participating HSEES states from 1996 to 2001. The public use dataset contains 39,764 records and 71 variables. A second public use dataset covering the years 2002-2004 will be available sometime in 2006.
Table 10 - Time period each state participated in Hazardous Substances Emergency Events Surveillance, 1993–2004
| State | Years Participated |
| Alabama | 1993–2003 |
| Colorado | 1993–2004 |
| Iowa | 1993–2004 |
| Louisiana | 2001–2004 |
| Minnesota | 1995–2004 |
| Mississippi | 1995–2003 |
| Missouri | 1994–2004 |
| New Hampshire | 1993–1996 |
| New Jersey | 2000–2004 |
| New York | 1993–2004 |
| North Carolina | 1993–2004 |
| Oregon | 1993–2004 |
| Rhode Island | 1993–2001 |
| Texas | 1993–2004 |
| Utah | 2000–2004 |
| Washington | 1993–2004 |
| Wisconsin | 1993–2004 |
In 2004, prevention outreach was very productive. ATSDR staff and state health department staff presented HSEES data in many venues including the annual conferences of the International Society for Environmental Epidemiology, American Public Health Association, National Disaster Medical System, Council of State and Territorial Epidemiologists, Mary Kay O'Connor Process Safety Center at Texas A & M University and many state specialized conferences. In addition, many peer reviewed articles were published (Appendix B). HSEES websites hosted on the participating state health department and ATSDR websites continue to be very useful tools to disseminate products and data as well as to increase visibility of the program. States continued to work with event reporting sources in their states to improve timeliness. Activities to foster enhanced collaboration included hosting stakeholder meetings, providing articles for stakeholder newsletters, contacting key stakeholders directly, and presenting at stakeholders meetings. Several states have developed electronic distribution systems, including their health alert networks to disseminate their information in a timely and cost-efficient manner.
Topics targeted in 2004 included 1) disaster preparedness, 2) methamphetamine lab awareness activities, 3) outreach to specific groups using ammonia, chlorine, cleaning products, acids, and mercury, 4) outreach to targeted populations including children, responders, and the transportation industry, and 5) special interest topics including carbon monoxide poisonings from underground utility fires and exposure to tearing agents from theft deterrent devices.
Specifically providing data to groups with problems, such as the hotel association with chlorine releases or state departments of transportation with methamphetamine labs dumped at rest areas provides for collaboration and the potential to measure decreases in events post-intervention.
During 2004, ATSDR continued to respond to requests for HSEES information from local, state, and federal agencies and organizations.
The ATSDR HSEES Internet Web site page is available at http://www.atsdr.cdc.gov/HS/HSEES/. At this site, annual reports and other information can be downloaded. Internet links to other relevant Web sites and the public use dataset are also available.
HSEES-related activities in 2004 included collaboration with other agencies and organizations that are involved with response to chemical terrorism, emergency response, hazardous substances, and public health (e.g., the U.S. Environmental Protection Agency). HSEES collaborated with international partners to pilot test the system in India and Poland. In India, HSEES is partnering with the National Institute of Occupational Health (NIOSH) and in Poland, HSEES is partnering with the Nofer Institute for Occupational Health.
An important contribution of HSEES data is its help in building capacity within each participating state health department to target prevention activities related to acute spills and their associated public health consequences. Because HSEES is funded in part through the Centers for Disease Control and Prevention (CDC), Coordinating Center for Terrorism Preparedness and Emergency Response, the HSEES system is also building capacity to alert the authorities when a public health action needs to be implemented immediately. Activities are conducted by state HSEES coordinators, often in collaboration with other local and state agencies. The program has been working over the years with several CDC Public Health Prevention Specialists to build capacity within the program to develop sound prevention activities that can be evaluated for their effectiveness.
1. Centers for Disease Control and Prevention. Comprehensive plan for epidemiologic surveillance. Atlanta: US Department of Health and Human Services; 1986.
2. Binder S. Death, injuries, and evacuations from acute hazardous materials releases. Am J Public Health 1989;70:1042-4.
| No. |
Substance |
No. Events |
| 1 |
Sulfur dioxide |
502 |
| 2 |
Carbon monoxide |
480 |
| 3 |
Ammonia |
464 |
| 4 |
Nitrogen oxide (nox) |
454 |
| 5 |
Volatile organic compounds nos* |
273 |
| 6 |
Hydrochloric acid |
252 |
| 7 |
Sulfuric acid |
184 |
| 8 |
Mercury |
179 |
| 9 |
Methamphetamine chemicals nos* |
179 |
| 10 |
Sodium hydroxide |
173 |
| 11 |
Paint nos* |
140 |
| 12 |
Ethylene glycol |
135 |
| 13 |
Resin nos* |
119 |
| 14 |
Nitric oxide |
112 |
| 15 |
Benzene |
111 |
| 16 |
Acetone |
99 |
| 17 |
Chlorine |
95 |
| 18 |
Polychlorinated biphenyls |
90 |
| 19 |
Nitrous oxide |
78 |
| 20 |
Ethylene |
75 |
| 21 |
Hydrogen sulfide |
65 |
| 22 |
Toluene |
64 |
| 23 |
Mix: carbon monoxide/hydrogen sulfide/nitrogen oxide (nox)/sulfur dioxide/volatile organic compounds |
63 |
| 24 |
Hydrogen peroxide |
62 |
| 25 |
Acid nos* |
61 |
| 26 |
Iodine |
60 |
| 27 |
Butadiene |
59 |
| 28 |
Adhesive nos* |
56 |
| 29 |
Mix: carbon monoxide/nitrogen oxide (nox)/volatile organic compounds nos* |
56 |
| 30 |
Phosphorus |
56 |
| 31 |
Ethyl ether |
51 |
| 32 |
Nitrogen dioxide |
51 |
| 33 |
Freon |
49 |
| 34 |
Solvent nos* |
48 |
| 35 |
Sodium hypochlorite |
47 |
| 36 |
Mix: carbon monoxide/nitrogen oxide (nox)/sulfur dioxide/volatile organic compounds nos* |
45 |
| 37 |
Paint or coating nos* |
45 |
| 38 |
Asbestos |
44 |
| 39 |
Flammable liquid nos* |
44 |
| 40 |
Lithium |
44 |
| 41 |
Phosphoric acid |
43 |
| 42 |
Potassium hydroxide |
43 |
| 43 |
Diesel fuel |
42 |
| 44 |
Propylene |
41 |
| 45 |
Antifreeze |
39 |
| 46 |
Fluorocarbon 22 |
39 |
| 47 |
Hydraulic oil |
38 |
| 48 |
Nitrogen tetroxide |
38 |
| 49 |
Propane |
38 |
| 50 |
Ethyl alcohol |
37 |
| 51 |
Nitric acid |
36 |
| 52 |
Paint thinner nos* |
34 |
| 53 |
Isopropyl alcohol |
33 |
| 54 |
Mix: carbon monoxide/ethylene/nitrogen oxide (nox) |
33 |
| 55 |
Mix: hydrogen sulfide/sulfur dioxide |
33 |
| 56 |
Ethylene oxide |
32 |
| 57 |
Methyl alcohol |
31 |
| 58 |
Xylene |
31 |
| 59 |
Mix: carbon monoxide/nitrogen oxide (nox) |
27 |
| 60 |
Pesticide nos* |
27 |
| 61 |
Ink nos* |
24 |
| 62 |
Mix: carbon monoxide/nitrogen oxide (nox)/propylene |
24 |
| 63 |
Alcohol nos* |
23 |
| 64 |
Chloroform |
23 |
| 65 |
Methanol nos* |
23 |
| 66 |
Methyl ethyl ketone |
23 |
| 67 |
Formaldehyde |
22 |
| 68 |
Base nos* |
21 |
| 69 |
Corrosive nos* |
21 |
| 70 |
Fertilizer nos* |
21 |
| 71 |
Methylene chloride |
21 |
| 72 |
Mix: carbon monoxide/nitrogen dioxide/nitrogen oxide (nox)/sulfur dioxide |
21 |
| 73 |
Mix: carbon monoxide/nitrogen oxide (nox)/sulfur dioxide |
21 |
| 74 |
Tetrachloroethylene |
21 |
| 75 |
Vinyl chloride |
21 |
| 76 |
Ammonium nitrate |
20 |
| 77 |
Hexane |
20 |
| 78 |
Nitrogen fertilizer |
20 |
| 79 |
Urea ammonium nitrate |
20 |
| 80 |
Coleman fuel |
18 |
| 81 |
Corrosive liquid acidic inorganic nos* |
18 |
| 82 |
Ethylene dichloride |
18 |
| 83 |
Styrene |
18 |
| 84 |
Hydrochloric (muriatic) acid |
17 |
| 85 |
Sulfuric (battery) acid |
17 |
| 86 |
Bleach |
16 |
| 87 |
Nitrogen |
16 |
| 88 |
Sulfur |
16 |
| 89 |
Mix: carbon monoxide/hydrogen sulfide/nitrogen oxide (nox)/sulfur dioxide |
15 |
| 90 |
Mix: carbon monoxide/nitric oxide/nitrogen dioxide |
15 |
| 91 |
Mix: carbon monoxide/oxides of nitrogen nos* |
15 |
| 92 |
Caustic soda |
14 |
| 93 |
Hydraulic fluid |
14 |
| 94 |
Isopropanol nos* |
14 |
| 95 |
Mix: ammonia/oxides of nitrogen nos* |
14 |
| 96 |
Sodium chloride |
14 |
| * NOS = not otherwise specified |
||
Publications reference list
2005
Ernst KP, Wattigney WA, Kaye WE. Releases from improper chemical mixing, Hazardous Substances Emergency Events Surveillance system, 1996-2001. J Occup Environ Med 2005; 47:287-93.
Centers for Disease Control and Prevention (CDC). Public health consequences from hazardous substances acutely released during rail transit-South Carolina, 2005; selected states, 1999-2004. MMWR 2005;53:64-7.
Horton DK, Burgess P, Rossiter S, Kaye WE. Secondary contamination of emergency department personnel from o-chlorobenzylidene malononitrile exposure, 2002. Am J Emerg Med 45(6):655-658.
Horton DK, Berkowitz Z, Kaye WE. Morbidity and mortality from hazardous materials events in the personal services industry, 1993–2001: A follow-Up report from the Hazardous Substances Emergency Events Surveillance (HSEES) system. Am J Ind Med 47:419-427.
Kaye WE, Orr MF, Wattigney WA. Surveillance of Hazardous Substances Emergency Events: identifying areas for public health prevention. Int J Hyg Environ Health 208(2005):37-44.
2004
Berkowitz Z, Horton DK, Kaye WE. Hazardous substances releases causing fatalities and/or people transported to hospitals: rural/agricultural vs. other areas. Prehospital Disaster Med 2004;19(3):213-20.
Centers for Disease Control and Prevention (CDC). Brief report: exposure to tear gas from a theft-deterrent device on a safe-Wisconsin, December 2003. MMWR 2004;53:176-7.
Horton DK, Berkowitz Z, Kaye WE. Hydrofluoric acid releases in 17 states and the acute health effects associated, 1993-2001. J Occup Environ Med 2004;46:501-8.
Centers for Disease Control and Prevention (CDC). Brief report: Injuries associated with homemade fireworks-selected states, 1993-2004. MMWR. 2004;53(25):562-3.
Horton DK, Berkowitz Z, Kaye WE. Surveillance of hazardous materials events in 17 states, 1993-2001: a report from the Hazardous Substances Emergency Events Surveillance (HSEES) system. Am J Ind Med 2004;45:539-48.
Centers for Disease Control and Prevention (CDC). Carbon monoxide releases and poisonings attributed to underground utility cable fires-New York, January 2000-December 2003. MMWR 2004;53:920-2.
Ruckart PZ, Borders J, Villanacci J, Harris R, Samples-Ruiz M. The role of adverse weather conditions in acute releases of hazardous substances, Texas, 2000-2001. J Hazard Mater 2004;115:27-31.
Ruckart PZ, Wattigney W, Kaye WE. Risk factors for acute chemical releases with public health consequences: Hazardous Substances Emergency Events Surveillance in the U.S., 1996-2001. Environ Health 2004;3(1):10.
Ruckart PZ, Orr MF, Kaye WE. Hazardous chemical releases in the home. J Environ Health 2004;67(5):14-9.v
2003
Berkowitz Z, Barnhart HX, Kaye WE. Factors associated with severity of injury resulting from acute releases of hazardous substances in the manufacturing industry. J Occup Environ Med 2003;45:734-42.
Centers for Disease Control and Prevention (CDC). Homemade chemical bomb events and resulting injuries-selected states, January 1996-March 2003. MMWR 2003;52:662-4.
Horton DK, Berkowitz Z, Kaye WE. The acute consequences to children exposed to hazardous substances used in illicit methamphetamine production, 1996 to 2001. J Child Health 2003;1:99-108.
Horton DK, Berkowitz Z, Kaye WE. Secondary contamination of ED personnel from hazardous materials events, 1995-2001. Am J Emerg Med 2003;21:199-204.
Horton DK, Berkowitz Z, Haugh GS, Orr MF, Kaye WE. Acute public health consequences associated with hazardous substances released during transit, 1993-2000. J Hazard Mater 2003;B98:161-75.
Manassaram DM, Orr MF, Kaye WE. Hazardous substances events associated with the manufacturing of chemicals and allied products. J Hazard Mater 2003;104:123-35.
Manassaram DM, Orr MF, Kaye WE. Counterterrorism planning using the hazardous substances events surveillance system. Disaster Manag Response 2003;1:35-40.
Weisskopf MG, Drew JM, Hanrahan LP, Anderson HA, Haugh GS. Hazardous ammonia releases: public health consequences and risk factors for evacuation and injury, United States, 1993-1998. J Occup Environ Med 2003;45(2):197-204.
2002
Berkowitz Z, Haugh GS, Orr MF, Kaye WE. Releases of hazardous substances in schools: data from Hazardous Substances Emergency Events Surveillance system, 1993-1998. J Environ Health 2002;65:20-7.
Berkowitz Z, Orr MF, Kaye WE, Haugh GS. Adverse public health effects associated with releases of hazardous substances in the agricultural industry and related services in four mid-Western states. J Occup Environ Med 2002;44:714-23.v
Horton DK, Berkowitz Z, Kaye WE. The public health consequences from acute chlorine releases, 1993-2000. J Occup Environ Med 2002;44:906-13.
Zeitz P, Orr MF, Kaye WE. Public health consequences of mercury spills: Hazardous Substances Emergency Events Surveillance System: 1993-1998. Environ Health Perspect 2002;110:129-32.
2001
Burgess JL, Kovalchick DF, Harter L, Kyes KB, Lymp JF, Brodkin CA. Hazardous materials events: evaluation of transport to health care facility and evacuation decisions. Am J Emerg Med 2001;19:99-105. Orr MF, Kaye WE, Zeitz P, Powers ME, Rosenthal L. Public health risks of railroad hazardous substance emergency events. J Occup Environ Med 2001;43:94-100. Orr MF, Haugh GS, Kaye WE. Hazardous Substances Emergency Events Surveillance (HSEES), 1993 to 1997. Chemical Health and Safety 2001;35-41. Welles WL, Wilburn RE. Hazardous Substances Emergency Events Surveillance (HSEES) in New York State, 1993 to 1997. Chemical Health and Safety 2001;42-52.2000
Burgess JL, Kovalchick DF, Harter L, Kyes KB, Thompson JN. Hazardous materials events: an industrial comparison. J Occup Environ Med 2000;42:546-53.
Centers for Disease Control and Prevention (CDC). Public health consequences among first responders to emergency events associated with illicit methamphetamine laboratories-selected states, 1996-1999. MMWR 2000;49:1021-4.
Souther L, Small-Johnson J, Messing RB. A description of agricultural releases of anhydrous ammonia in Minnesota. Chemical Health and Safety 2000;16-22.
Weisskopf MG, Drew JM, Hanrahan LP, Anderson HA. Hazardous ammonia releases in Wisconsin: trends and risk factors for evacuation and injury. Wisc Med J 2000;30-46.
Zeitz P, Berkowitz Z, Orr MF, Haugh GS, Kaye WE. Frequency and type of injuries in responders of hazardous substances emergency events, 1996 to 1998. J Occup Environ Med 2000;42:1115-20.
1996
Hall HI, Dhara VR, Kaye WE, Price-Green PA. Public health consequences of hazardous substance releases. Toxicol Ind Health 1996;12:289-93.
Hall HI, Haugh GS, Price-Green PA, Dhara VR, Kaye WE. Risk factors for hazardous substance releases that result in injuries and evacuations: data from 9 states. Am J Public Health 1996;86:855-7.
Wendt RD, Hall HI, Price-Green PA, Dhara VR, Kaye WE. Evaluating the sensitivity of hazardous substances emergency events surveillance: a comparison of three surveillance systems. J Environ Health 1996;58:13-7.
1995
Agency for Toxic Substances and Disease Registry. ATSDR update: Hazardous Substances Emergency Events Surveillance (HSEES) system: 1993 data. Health and Environment Digest 1995;8:83-4.
Hall HI, Price-Green PA, Dhara VR, Kaye WE. Health effects related to releases of hazardous substances on the Superfund priority list. Chemosphere 1995;31:2455-61.
1994
Hall HI, Dhara VR, Price-Green PA, Kaye WE. Surveillance for emergency events involving hazardous substances-United States, 1990-1992. MMWR 1994;43(No. SS-2):1-6.
Hall HI, Dhara VR, Kaye WE, Price-Green PA. Surveillance of hazardous substance releases and related health effects. Arch Environ Health 1994;49:45-8.
Other HSEES documents available:
1993 through 1997 Annual Report | PDF Version,
1831KB
1995 Annual Report | PDF Version, 141KB
1996 Annual Report | PDF Version, 157KB
1997 Annual Report | PDF Version,
1822KB
1998 Annual Report | PDF Version,
6905KB
1998 through 2001 Annual Report | PDF Version,
355KB
1999-2000 Biennial Report | PDF Version,
13404KB
2001 Annual Report | PDF Version, 848KB
2002 Annual Report | PDF Version, 3441KB
2003 Annual Report | PDF Version, 1208KB
2004 Annual Report | PDF Version,
475KB
Agency for Toxic Substances and Disease Registry, 4770 Buford Hwy NE, Atlanta, GA 30341
Tel: (404) 498-0110 / Public Inquiries: (888) 422-8737