Report of the Camp Lejeune Water-Modeling Expert Panel
Expert Peer Review Panel Evaluating ATSDR’s Water-Modeling Activities in Support of the Current Study of Childhood Birth Defects and Cancer at U.S. Marine Corps Base Camp Lejeune, North Carolina
Analyses of Groundwater Resources and Present-Day (2004) Water-Distribution Systems,
March 28–29, 2005
Morris L. Maslia, Editor
Prepared for:
Agency for Toxic Substances and Disease Registry, Atlanta, Georgia
Prepared by:
Eastern Research Group, Inc.
Atlanta, Georgia
October 2005
PDF of ATSDR Water-Modeling Expert Panel Review (1,401 KB)
PDF of ATSDR Water-Modeling Expert Panel Transcript, Day One (595 KB)
PDF of ATSDR Water-Modeling Expert Panel Transcript, Day Two (499 KB)
Table of Contents
- Suggested Citation for this Report
- Executive Summary
- 1.0 Introduction
- 2.0 ATSDR Objectives and Goals
- 3.0 Summary of Water Modeling Activities
- 4.0 Panel Discussions
- 5.0 Discussions and Responses to Questions From the Public
- 6.0 Summary of Recommendations from Panel Members and ATSDR’s Response
- 7.0 Acknowledgments
- Appendix A
- Appendix B
- Appendix C–Curriculum Vitae for Panel Members
- Appendix D–Panel Members’ Pre-Meeting Comments
Disclaimer
Use of trade names and commercial sources is for identification only and does not imply endorsement by the Agency for Toxic Substances and Disease Registry, the Centers for Disease Control and Prevention, or the U.S. Department of Health and Human Services.
Suggested Citation for this Report:
Maslia, M.L., editor, 2005, Expert Peer Review Panel Evaluating ATSDR’s Water-Modeling Activities in Support of the Current Study of Childhood Birth Defects and Cancer at U.S. Marine Corps Base Camp Lejeune, North Carolina—Analyses of Groundwater Resources and Present-Day (2004) Water-Distribution Systems, March 28-29, 2005: Prepared by Eastern Research Group, Inc., Atlanta, Georgia; Prepared for Agency for Toxic Substances and Disease Registry (ATSDR), Atlanta, 31 p., 4 app.
Expert Peer Review Panel Evaluating ATSDR’s Water-Modeling Activities in Support of the Current Study of Childhood Birth Defects and Cancer at U.S. Marine Corps Base Camp Lejeune, North Carolina
Analyses of Groundwater Resources and Present-Day (2004) Water-Distribution Systems, March 28–29, 2005
Morris L. Maslia, Editor
EXECUTIVE SUMMARY
On March 28–29, 2005, the Agency for Toxic Substances and Disease Registry (ATSDR) held a 2-day expert peer review meeting in Atlanta, Georgia. ATSDR requested the panel of nine experts to provide input on the agency’s groundwater resources and water-distribution system modeling activities conducted from March–December 2004 at U.S. Marine Corps (USMC) Base, Camp Lejeune, North Carolina. As explained during the meeting, these present-day modeling activities are being conducted to enable ATSDR to historically reconstruct the water systems serving the base from 1968–1985. The historical reconstruction will allow ATSDR to estimate relative concentrations of particular contaminants in the water-distribution systems during that time frame so that exposures can be quantified. Panel members were provided with background information regarding ATSDR’s current epidemiologic study, including activities conducted thus far, findings to date, and the role of modeling and historical reconstruction in the study. During the meeting, the ATSDR technical team provided overviews and technical details pertaining to the modeling approaches and activities performed to date.
Before the meeting, ATSDR provided panel members with a list of questions to review. Eight questions pertained to groundwater issues, seven were related to water-distribution systems, and four were part of the overall charge to the panel. Questions related to water-distribution systems were modified on the second day of the meeting. Throughout the meeting, the panel provided answers to these questions and offered suggestions to help ATSDR proceed with its future endeavors. Overall, the experts indicated that this was an important study to conduct and they were impressed with the quality of work performed to date. The panelists did note, however, that specific principal issues need to be addressed, and made recommendations for ATSDR’s next steps. As decided among ATSDR, the panel chair, and panel members, panelists provided individual recommendations throughout and at the conclusion of the meeting. These recommendations are presented in Section 6.0 of this report, and are briefly summarized.
A comprehensive review of archived files and other documents (interchangeably referred to as “data archaeology” and “data discovery”) is a priority and should precede other previously scheduled activities. To support both the groundwater and water-distribution system efforts, ATSDR should conduct in depth searching of records for additional quantitative data and detailed information of interconnections between the water-distribution systems. Also, ATSDR should obtain information describing the historical uses of tetrachloroethylene (PCE) at ABC One-Hour Cleaners and further characterize the Holcomb Blvd. and Hadnot Point systems.
ATSDR planned to extensively use water-distribution system models to estimate historical contaminant concentrations in the systems. Instead, the agency should use simple mixing models that require less effort and resources, but will provide the needed information.
To address groundwater-modeling uncertainty, ATSDR should consider using probabilistic methods (e.g., Monte Carlo simulation) to evaluate uncertainty inherent in model parameter arrays.
Panelists suggested ATSDR reassess its schedule of activities and prioritize its efforts. ATSDR should then proceed based on the outlined priorities and available resources.
In the groundwater-flow model for the Tarawa Terrace area, ATSDR was evaluating recharge using an average annual value. The agency should consider other methods to more accurately account for recharge.
1.0 INTRODUCTION
1.1 Background
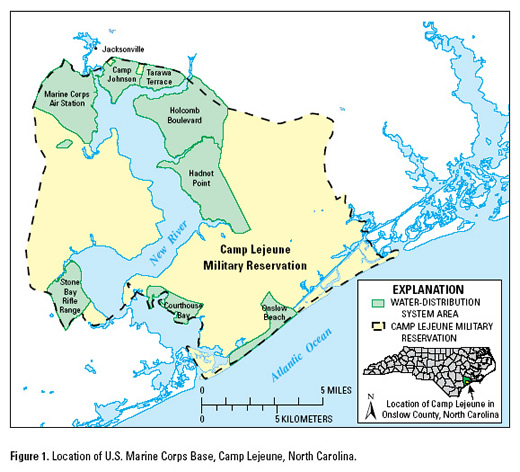
Operations began at U.S. Marine Corps (USMC) Base Camp Lejeune in the 1940s. Today, nearly 150,000 people work and live at the base, including active duty personnel, dependents, retirees, and civilian employees. About two-thirds of the active duty personnel and their dependents are younger than 25 years of age. The base consists of 15 different housing areas; families live in base housing for an average of 2 years. During the 1970s and 1980s, family housing areas were served by three water-distribution systems: Hadnot Point, Tarawa Terrace, and Holcomb Blvd. (Figure 1)
Underground storage tanks (USTs) used for storing waste-degreasing solvents were installed in the Hadnot Point area in the 1940s and 1950s. In 1954, ABC One-Hour Cleaners (ABC Cleaners) began operating about 500 ft north of the base. In 1958, a supply well for Tarawa Terrace family housing units was installed about 1,000 ft southeast of the cleaners, just west of the intersection of Lejeune Blvd. (Highway 24) and Tarawa Blvd. On-base sampling conducted from 1980–1985 identified volatile organic compound (VOC) contamination in Tarawa Terrace and Hadnot Point system wells. Among the contaminant constituents detected were trichloroethylene (TCE), tetrachloroethylene (PCE), and benzene in wells at Hadnot Point. PCE, TCE, and 1,1-dichloroethene (DCE) were detected in the Tarawa Terrace wells.
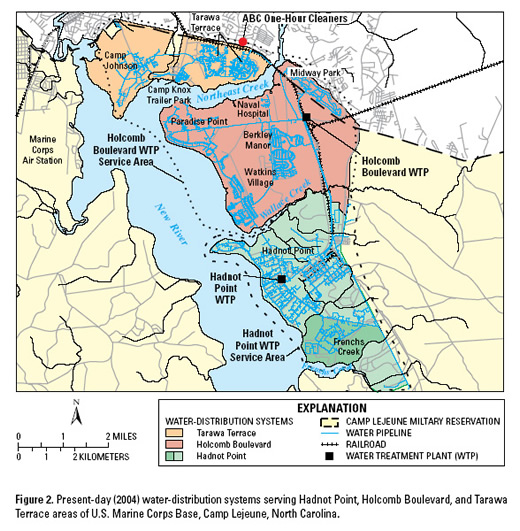
On January 27, 1985, a fuel pump in the Holcomb Blvd. water-treatment plant (WTP) broke. While repairs were being made, the Holcomb Blvd. service area received water from the Hadnot Point WTP (Figure 2). On January 31, 1985, water samples collected at taps within the Holcomb Blvd. service area temporarily receiving water from the Hadnot Point WTP contained high levels of TCE and DCE. In early February 1985, all contaminated wells in the Hadnot Point and Tarawa Terrace areas were reportedly shut down. In 1989, the U.S. Environmental Protection Agency (EPA) placed USMC Base Camp Lejeune and ABC Cleaners on its National Priorities List (NPL) of sites requiring environmental investigation (also known as “Superfund” sites). In August 1990, the Agency for Toxic Substances and Disease Registry (ATSDR) conducted a public health assessment (PHA) at ABC Cleaners. The PHA found that PCE, detected in on- and off-site wells, was the primary contaminant of concern. Other detected contaminants included vinyl chloride, TCE, benzene, toluene, 1,2-dichloroethylene (1,2-DCE), and 1,1-DCE.
In 1997, ATSDR completed a PHA for the base, which concluded that estimated exposures to VOCs in drinking-water were significantly below the levels shown to be of concern in animal studies. Thus, ATSDR determined that exposure to VOCs in on-base drinking water was unlikely to result in cancer and noncancer health effects in adults. However, because scientific data relating to the harmful effects of VOCs on a child or a fetus were limited, ATSDR recommended conducting an epidemiologic study to assess the risks to babies and children who were exposed in-utero to chlorinated solvents (e.g., PCE and TCE) contained in on-base drinking water.
Following this recommendation, ATSDR conducted a study of adverse birth outcomes in 1998. ATSDR used various databases to evaluate possible associations between maternal exposure to contaminants contained in base drinking water and mean birth weight deficit, preterm birth (<37 weeks gestational age), and small for gestational age (SGA). To identify women living in base housing when they delivered, birth certificates were collected for live births that occurred January 1, 1968, through December 31, 1985. The study found that exposure to PCE in drinking water from the Tarawa Terrace system was related to an elevated risk of SGA for children of mothers older than 35 years and who experienced two or more prior fetal losses. The study also found that an elevated risk of SGA, though only identified among male infants, was associated with long-term exposure to TCE from the Hadnot Point water-distribution system. The study could not, however, evaluate childhood cancers and birth defects.
Currently, ATSDR is conducting a case-control epidemiologic study to evaluate exposure in-utero and during infancy (up to 1 year of age) to VOC-contaminated groundwater via water-distribution systems at USMC Base Camp Lejeune from 1968–1985. The study will assess rare diseases, including specific birth defects (e.g., neural tube defects and cleft lip) and childhood cancers (e.g., childhood leukemia). The study is a multi-step process that includes:
(1) a scientific literature review to identify particular childhood cancers and birth defects associated with exposure to VOC-contaminated drinking water,
(2) a telephone survey to identify potential cases,
(3) a medical-records search to confirm the diagnoses of the reported cases, and
(4) a case-control study to interview parents (collect information on potential risk factors) and obtain exposure estimates using water-modeling techniques.
ATSDR has completed the literature review and the telephone survey. The medical-records search to verify reported cases is ongoing, and work is proceeding with the case-control study. The agency will also be interviewing parents of cases and controls from spring through summer 2005 to collect detailed information on residential history, parental risk factors, and maternal water consumption.
No exposure data and very limited historical contaminant data are available to support the epidemiologic study. As a result, ATSDR is using modeling techniques to estimate the movement of contaminants in groundwater and in water-distribution systems at the base. This information will be provided to epidemiologists so that estimates of historical exposures can be quantified. From March–December 2004, ATSDR conducted modeling analyses of groundwater resources and present-day (2004) water-distribution systems serving the base (see Figure 2 for locations of the present-day systems). ATSDR plans to use the present-day water-distribution system modeling analyses to historically reconstruct water-distribution systems at the base from 1968–1985; the agency will then be able to estimate the concentrations of particular contaminants delivered through the drinking-water system and the frequency and duration of exposure to contaminants in the drinking water.
ATSDR encountered several issues complicating the calibration of groundwater-flow and present-day (2004) water-distribution system models. Therefore, before ATSDR could consider historical events, the agency wanted to convene a panel of experts to discuss outstanding issues and questions regarding the groundwater- and water-distribution system modeling activities conducted to date at the base.
On March 28–29, 2005, ATSDR held a peer review panel meeting in Atlanta, Georgia, to obtain external input and guidance regarding approaches, methods, and assumptions applied to modeling projects at the base. ATSDR asked nine panel members to comment on specific modeling issues and questions as well as provide ATSDR with recommendations to accomplish and complete modeling and historical reconstruction activities.
1.2 Meeting Organization
Nine nationally and internationally recognized experts in groundwater and water-distribution system modeling participated in the 2-day meeting. Dr. Barry L. Johnson (Assistant Surgeon General, retired) served as the panel chair.
One month before the meeting, panel members received the overall charge, a list of targeted issues and questions, PHAs conducted at ABC Cleaners and USMC Base Camp Lejeune, descriptions of field-data collection activities, and draft technical documentation. Presentations presented at the meeting by ATSDR and its contractors included:
(1) an overview of the agency’s current epidemiologic study;
(2) detailed descriptions of the geohydrologic framework in the Tarawa Terrace area groundwater-model simulations and interpretations of related groundwater contamination;
(3) a summary of water-modeling activities;
(4) an overview of analyses of present-day (2004) water-distribution systems; and
(5) detailed descriptions of field-testing procedures, activities, and results related to the present-day water-distribution systems serving the base.
Throughout the meeting, panel members asked questions, provided responses to the agency’s questions and charge, and noted specific aspects that need further evaluation. Following the end of discussions on Day 2, the chair asked each panel member to provide individual comments and recommendations to ATSDR based on material provided to them before and during the meeting (Section 6.0 and Appendix D). Four USMC Base Camp Lejeune representatives, one public member, one reporter, and about 15 observers (mostly ATSDR staff members) attended all or part of the meeting. One public member asked questions and provided comments.
This report summarizes the discussions and recommendations from the 2-day meeting. Section 2.0 presents opening statements, which includes an overview of ATSDR activities. Section 3.0 summarizes water-modeling activities conducted to date as presented by members of ATSDR’s water-modeling team. Section 4.0 presents the panel’s discussions and recommendations related to specific questions posed by ATSDR. Section 5.0 presents a summary of discussions and responses to questions from the public. Section 6.0 documents the panel members’ recommendations. Appendix A contains materials provided to meeting attendees, including the agenda*, the overall charge to the panel, and specific questions on groundwater and water-distribution systems that panelists were asked to address during the meeting. Lists of panel members along with meeting presenters and observers are included in Appendix B. Curriculum vitae for the panel members (nine panelists and the chair) are provided in Appendix C. Appendix D contains draft premeeting comments provided by each of the nine panel members. Copies of this summary report and two volumes of verbatim transcripts of the meeting (in PDF file format) are provided on a CD located on the inside back cover of this report.
*Appendix A includes an agenda prepared before the meeting. Based on decisions made during the meeting, the panel members and ATSDR staff chose to have each panel member provide recommendations to ATSDR rather than draft the panel communiqué indicated in the original meeting agenda.
2.0 ATSDR OBJECTIVES AND GOALS
2.1 Welcoming and Opening Remarks
Tom Sinks, Acting Director, NCEH/ATSDR
Dr. Tom Sinks, Acting Director for the National Center for Environmental Health (NCEH) and ATSDR, welcomed panel members and introduced the panel chair. Dr. Sinks presented the overall charge to the panel, which included four questions regarding ATSDR’s groundwater- and water-distribution modeling activities (see Appendix A). Dr. Sinks noted that ATSDR would challenge itself to use the best science possible to reach its goals, while being open to criticism and comments. He emphasized that the objective of the meeting was to obtain critiques and recommendations from the panel members regarding ATSDR’s modeling approaches.
2.2 Statement by the Chair
Barry L. Johnson, Panel Chair
Dr. Barry L. Johnson (Assistant Surgeon General, retired) read a statement explaining that the panel was charged with considering the appropriateness of ATSDR’s approach, methods, and time requirements related to water-modeling activities, and was being asked to focus solely on issues pertaining to water modeling. He noted that ATSDR is in the early stages of its analyses. The data and interpretations are, therefore, subject to modifications, in part dependent on panel members’ input.
2.3 Summary of ATSDR Activities
Perri Z. Ruckart, Principal Investigator, ATSDR
Ms. Perri Z. Ruckart, an epidemiologist with ATSDR’s Division of Health Studies, provided information on the site background, ATSDR activities conducted to date, and the current ATSDR epidemiologic study (as described in Section 1.1).
Ms. Ruckart explained that water-modeling results are needed to answer several questions for the epidemiologic study. These include:
(1) sources of contamination;
(2) specific contaminants that impacted the water supply;
(3) time frame when groundwater contamination reached drinking-water supply wells and the duration of contamination;
(4) processes used for distributing contaminated water throughout the base’s water-distribution systems; and
(5) specifics of exposure (i.e., duration, frequency, and spatial distribution of exposure to contaminated water supplies).
She noted that the epidemiologic study activities are anticipated from spring 2005 through the expected completion date of fall 2007, based on the current project time line.
3.0 SUMMARY OF WATER-MODELING ACTIVITIES
3.1 General Overview
Morris L. Maslia, Project Officer, ATSDR
Mr. Morris L. Maslia, a research environmental engineer and project officer with the Exposure-Dose Reconstruction Program within ATSDR’s Division of Health Assessment and Consultation, began by introducing members of the water-modeling team. The team includes representatives from various organizations: Morris Maslia and Jason Sautner of ATSDR; Claudia Valenzuela and Joseph Green of the Oak Ridge Institute for Science and Education; Robert Faye of Robert E. Faye and Associates, Inc.; Mustafa Aral of the Multimedia Environmental Simulations Laboratory (MESL) at the Georgia Institute of Technology; and Walter M. Grayman of W.M. Grayman Consulting Engineer*. Graphs presented showed the distribution of the total work effort and staff budgeting for groundwater analysis, water-distribution system analysis, data discovery, and communications. Groundwater analysis represents about 35% of the total effort, whereas water-distribution system modeling represents about 40% of the total effort to date. For water-distribution system analysis, assembling accurate information and data about the present-day system and georeferencing this information and data (spatial analysis and geographic information systems activities) were the driving forces of the effort. The present-day water-distribution system modeling has utilized more time and staff than any of the other tasks. Mr. Maslia provided the following summary of water-modeling activities conducted to date.
*Dr. Grayman was not present at the meeting, but is a member of the water-modeling team assembled by ATSDR for the Camp Lejeune activities.
Overview of Water-Modeling Systems and Activities
USMC Base Camp Lejeune, located in coastal North Carolina, has seven water-distribution systems (Figure 1). ATSDR is focusing on three of these systems—Tarawa Terrace, Holcomb Blvd., and Hadnot Point—serviced by the Hadnot Point and Holcomb Blvd. WTPs (Figure 2). The Hadnot Point WTP in the southern area services the Hadnot Point water-distribution system. The Holcomb Blvd. WTP in the northern area, however, services both the Tarawa Terrace (currently combined with Camp Johnson) and the Holcomb Blvd. water-distribution systems.
A chronology of the water-systems operations displayed at the meeting documented beginning-operation dates for each WTP. However, specific dates for several facilities are in doubt as a result of conflicting and newly acquired information. According to the most recent data, the Hadnot Point, Tarawa Terrace, and Montford Point (a/k/a Camp Johnson) WTPs were constructed in 1943, 1951–1952, and 1957, respectively. However, ATSDR has been unable to confirm the month and year that the Holcomb Blvd. WTP began operating. ATSDR has obtained maps suggesting that operations began in 1973, but has also received documents indicating that operations began in 1971. An accurate date for the beginning of plant operations is a critical epidemiological issue and has caused some uncertainty regarding study design and approaches, particularly whether or not the epidemiologic study will consider exposure by months. The agency appreciates the panel’s expertise and advice on how to best proceed.
The Tarawa Terrace WTP reportedly closed in March 1987. However, ATSDR recently received a 1991 report, which suggests that this plant supplied water to Holcomb Blvd. in 1989. Several supply wells at Tarawa Terrace continued to operate after the discovery of groundwater contamination at wells TT-26 and TT-23, which were shut down in early 1985. The remaining wells were probably operational through 1986 and were most likely permanently abandoned before April 1987. ATSDR is still in the process of data discovery and is actively attempting to determine an accurate time frame of operations at these WTPs.
Goals of the water-modeling activities are based on the needs of the epidemiologic study. First, groundwater-flow and transport models will simulate the arrival time of contaminants at wells, including the mean concentration and ranges of concentrations during the periods of well operation. Second, the water-distribution system models will simulate the spatial distribution of contaminants by housing location (e.g., Tarawa Terrace and Holcomb Blvd.). Third, groundwater and water-distribution system simulations will be subjected to various levels of analyses to assess and reduce uncertainties. Uncertainties regarding the accuracy of model input arrays and simulation results occur with respect to both groundwater and the model. ATSDR noted that it was relying on panel members to provide insight and recommendations for evaluating these uncertainties, and to determine which models are best suited for assessing uncertainties in groundwater flow, contaminant transport, and water-distribution systems.
Brief Overview of Groundwater Analyses
The Hadnot Point area was contaminated as a result of leaking USTs, spills, and other waste-disposal practices. Groundwater contamination in the Tarawa Terrace area is largely the result of improper disposal of dry cleaning wastes at ABC Cleaners and leaking underground-storage tanks (USTs) at several locations within Tarawa Terrace proper. Available information suggests that PCE contamination in the Tarawa Terrace area is most likely from a single identified source—ABC Cleaners. The groundwater-modeling approach with respect to the Tarawa Terrace area includes: (1) the construction of a three-dimensional groundwater-flow model, (2) calibrating the flow model for estimated predevelopment (steady state) and transient (unsteady state) conditions, and (3) applying the flow model to the simulation of aqueous phase PCE fate and transport. A preliminary flow model has been constructed and calibrated for Tarawa Terrace aquifers of interest and used to simulate the advective transport of PCE from the vicinity of ABC Cleaners to supply wells TT-26 and TT-23. Additional modeling analyses, consisting of aqueous phase fate and transport simulation of PCE, remain to be undertaken and completed.
3.2 Groundwater-Modeling Analyses
Robert E. Faye, Civil Engineer/Hydrologist, Robert E. Faye and Associates, Inc.
Mr. Robert E. Faye assisted ATSDR in constructing and calibrating the groundwater-flow and advective transport models for the Tarawa Terrace area. His presentation is summarized below.
Geohydrologic Framework
The geohydrologic framework was developed to quantify and describe specific aspects (i.e., potentiometric levels, geometry, and hydraulic characteristics) of the aquifers and confining units at Tarawa Terrace at a scale and level of detail appropriate for use in groundwater flow and contaminant fate and transport models. Data available for framework analyses included 44 electric logs (elogs), 100 boring logs, and 17 drillers’ logs obtained from various sources (e.g., remedial investigations/feasibility studies [RI/FS] at Tarawa Terrace, Montford Point, Holcomb Blvd., and vicinities). Through the framework analyses, 11 confining units and aquifers were identified, most of which are explicitly represented in the preliminary groundwater-flow model.
Two reports summarizing groundwater conditions, well data, and geohydrology at USMC Base Camp Lejeune—published by the U.S. Geological Survey (USGS) in the late 1980s—were referenced. These reports used various elogs and drillers’ logs to identify the number of confining units across the base. Essentially, the geohydrologic framework developed for this study closely, but not entirely, conforms to the USGS’s framework analysis. Results of the framework analyses, partly constrained by estimated chronostratigraphic boundaries, were identified with the top of what Mr. Faye called the local confining unit (top of the Eocene) and the top of the Beaufort confining unit (identified by the USGS as the top of the Paleocene). Similar patterns of permeable and poorly permeable units were identified on selected elogs and boring logs to gain insight into possible depositional cycles occurring at various depths. Permeable units of appropriate thickness were identified as aquifers; poorly permeable units were identified as confining units. This information was then correlated with the available chronostratigraphic boundaries to establish continuity of similar sediment groups in the subsurface from borehole to borehole.
Another component of the framework is the analysis of aquifer test data. About 60 tests—almost all single well tests—were obtained for wells that supply the three water-distribution systems. Test data were used in conjunction with the USGS aquifer test analyses worksheets to determine horizontal hydraulic conductivity at various locations and depths within the study area.
In addition, an approximation of prepumping groundwater levels at and near Holcomb Blvd., Tarawa Terrace, and Camp Johnson was accomplished by identifying and mapping the earliest or highest available measurement of water levels. The conceptual groundwater-flow model and the estimates of pre-pumping levels indicate that the predevelopment potentiometric surfaces in all the aquifers were relatively similar. Accordingly, Northeast Creek and New River (Figure 2) are probably flow boundaries for all the aquifers of interest in this study. Groundwater-flow directions in the Tarawa Terrace area generally traveled east or south toward Northeast Creek and New River. Flow directions in the Holcomb Blvd. area generally traveled north, west, and northwest toward Northeast Creek and New River.
PCE Contamination at Tarawa Terrace and Vicinity
The quantity and occurrence of PCE and associated contamination in the Tarawa Terrace and Upper Castle Hayne aquifers, located at and near the Tarawa Terrace base housing area, were computed using analyses of water samples collected at several supply wells and at hydrocone sampling locations. Also obtained were ancillary data site locations, sampling depths, and the concentrations of contaminants. Mr. Faye pointed out that limited data were used to assess contaminant concentrations at the wellheads. He noted that ATSDR recently became aware of additional sample analyses, including monthly samples collected at supply well TT-25 and weekly samples collected downstream of the Tarawa Terrace WTP in the mid-1980s. ATSDR is trying to obtain these data. For most of these wells, ATSDR also has obtained information regarding well construction, dates wells were placed online, and dates when wells were removed from service. An overview of Mr. Faye’s remarks follows:
Data collected between 1991–1993, primarily “direct push technology” data, revealed the highest PCE concentrations. Most of the 40–50 data points were collected at depth intervals of 15–25 ft (upper zone) and 35–45 ft (lower zone). Both field and laboratory measurements were available.
According to the model, under normal operations supply well TT‑26 would capture all aqueous PCE introduced into the subsurface and into the groundwater at ABC Cleaners. However, fairly large concentrations of PCE occur in the unsaturated zone north and west of the cleaners, and smaller concentrations of PCE have been detected south of TT-26 (near supply well TT-23). Well TT-26 is suspected as the primary well that delivered PCE to the water-distribution system.
An estimate of PCE mass at Tarawa Terrace was calculated. The method included:
(1) creating upper and lower PCE concentration shells,
(2) developing an average (midconcentration shell) using aerial and spatial distribution,
(3) calculating the volume of aquifer material between the shells using the midconcentration shells and multiplying by effective porosity,
(4) computing the area‑weighted PCE concentration between the average shell contours (considered the volume-weighted PCE concentration), and
(5) multiplying the volume-weighted PCE concentration by the volume adjusted by effective porosity.
A PCE mass of 2,500 pounds (185 gal was calculated between the two shells. Mr. Faye stated that the 185 gal of PCE is most likely a small percentage of the total amount of PCE actually contained in the aquifers, particularly because ABC Cleaners historically used about 100 gal of PCE each month, according to a National Oceanic and Atmospheric Administration report.
PCE, TCE, and DCE concentrations at supply well TT-26, and PCE concentrations at supply well TT-23 during 1985–1991 were displayed graphically. Data for TCE, a daughter product of PCE, suggest that biodegradation of PCE was occurring.
Groundwater-Flow Model at Tarawa Terrace and Vicinity
A calibrated groundwater-flow model is necessary, ultimately, to simulate the fate and transport of PCE from the vicinity of ABC Cleaners to Tarawa Terrace supply wells. Mr. Faye emphasized that the information being presented details preliminary calibrations that have provided some reasonable results, but the flow and advective transport models have not been tested completely for sensitivity. Mr. Faye noted that ATSDR anticipates panel input regarding how to best proceed with the model. A summary of groundwater-flow model efforts to date follows.
Model Features and Input
The model grid consists of 270 columns and 200 rows and includes inactive and active areas of the model domain. The active model domains contain about 24,000 cells, with cell dimensions of 50 × 50 ft. The active domains are spatially equivalent for the nine layers (named layers 1–9), which correspond to the geometries of the aquifers and confining units identified by the geohydrologic framework analysis.
Frenchmans Creek, a small drain in the western area of Tarawa Terrace, is represented in the model by drain cells in layer 1 (Tarawa Terrace aquifer). Northeast Creek is represented by the entire area down to the midchannel line (no-flow boundary). A specified altitude of 0.0 ft is assigned to all of the cells corresponding to Northeast Creek in layer 1.
Arrays of horizontal hydraulic conductivity were assigned to each of the nine model layers. Cell-by-cell arrays were used to represent horizontal hydraulic conductivity of aquifer layers 1, 3, 5, and 7. A uniform array of 5 ft/d was assigned to layer 9 and a uniform array of 0.2 ft/d was assigned to confining unit layers 2, 4, 6, and 8.
Vertical hydraulic conductivity of all layers was assigned as 10% of respective horizontal hydraulic conductivities. A specific yield of 0.20 was assigned to the Tarawa Terrace aquifer, which contains the water table. A storativity of 0.0005 was assigned as a uniform array to model layers 2–9. Except for a few measurements with questionable validity related to the Tarawa Terrace aquifer, no storage coefficient data were available. The specific storage of model layers was calculated by dividing aquifer storativity by thickness (as determined by the geometry of the layer). The result was assigned to the model layer as a cell-by-cell array.
Preliminary model calibration was accomplished in three steps:
(1) developing a conceptual model of groundwater flow,
(2) defining and simulating predevelopment (prepumping) conditions at the well heads to the greatest extent possible and determining whether the steady-state simulations support the conceptual model, and
(3) defining operational conditions regarding pumpage and well heads and conducting transient simulations of these conditions.
Transient simulations to date have been accomplished only for 1978–1994, which corresponds to the time of most water-level measurements.
Conceptual Model
Groundwater recharge occurs in the highland areas and flows downgradient toward Northeast Creek, Frenchmans Creek, and New River. USGS and North Carolina reports indicate that the long-term annual recharge is about 12 in/yr. However, the Tarawa Terrace area is not particularly dissected with drainage; Frenchmans Creek is the only prominent creek in the area. Accordingly, net groundwater recharge could range from 12–16 in/yr for this particular area. ATSDR will likely use a value within this range for estimating long-term average annual recharge. This issue will continue to be addressed during ongoing model simulations.
Predevelopment Simulations
A map of simulated predevelopment water-level conditions in the Tarawa Terrace and Castle Hayne aquifers, shown for Tarawa Terrace and vicinity. It indicated that simulated water levels closely resembled the earliest or highest groundwater levels observed in the study area. Simulated groundwater-flow directions were shown to travel south and southeast toward New River and Northeast Creek from the highland areas to the north and northwest, thus conforming to the conceptual model. The map showed that discharge from the aquifers to Frenchmans Creek is continuous and well defined and that Northeast Creek and New River were sinks for groundwater flow. Simulated predevelopment recharge was about 13 in/yr.
Transient Simulation (1978–1994)
Camp Lejeune personnel measured monthly static and pumping levels for each on-base supply well using air lines. Although data gaps exist, ATSDR obtained these data for nearly all of the supply wells at Tarawa Terrace from January 1978 to April 1986. Uncertainties associated with these data include:
(1) whether there was a standard for measurements,
(2) whether water-level measurements were repeated until consistent results were obtained,
(3) the amount of time that elapsed between terminating the pumping at the well and collecting the static level, and
(4) the accuracy of the gauges used to obtain the measurements. Regardless, these measurements are the most comprehensive suite of water-level data available for model calibration and were used accordingly without adjustment or screening.
The simulation period was extended through 1994, because ATSDR obtained several accurate water-level measurements collected from various monitoring wells in the Tarawa Terrace area between 1991 and 1994. Therefore, instead of ending the transient analysis when the supply wells were shut down, the analysis was extended to make use of the additional measurements.
ATSDR is interested in 1-month stress periods, and the current simulation results correspond to 204 monthly stress periods from January 1978 to December 1994. Convergence problems resulted from difficulties with drying cells during transient simulations in the upper two layers of the model, presumably due to the low standard recharge rate of 13 in/yr. In these instances, the assigned recharge for the stress period was increased to maintain convergence. Simulated recharge rates ranged from 12–16 in/yr. The average simulated recharge rate for the period of pumping, 1978–1986, was about 12.7 in/yr.
ATSDR used 1978 well capacity data obtained from Henry Von Oesen and Associates, Inc., and annual average daily pumpage rates (annual treated water rates) from the Tarawa Terrace WTP to estimate monthly pumping rates assigned to individual wells. The Tarawa Terrace well network probably operated on a rotation basis such that no well pumped continuously for extended periods, except during emergencies. However, no actual operational schedules for specific Tarawa Terrace wells are available. ATSDR applied three constraints in developing a pumping schedule: (1) honoring operational records, (2) ensuring that the actual rate used in the simulation was less than the capacity, and (3) making certain that total well discharge in a particular stress period and year equaled the average daily rate reported by USGS.
Advective Transport Simulation
Preliminary advective transport simulations were conducted representing simulated groundwater-flow conditions at Tarawa Terrace during December 1984. Mr. Faye also presented the “water budget” for this stress period, which provided recharge, discharge, and storage change rates.
Mr. Faye explained that advective transport analyses related to flow paths generated by particles “seeded” within the immediate vicinity of ABC Cleaners and flow paths generated by particles “seeded” about 600 ft west of the cleaners. The transport analyses determined the time of contaminant travel from the “seeded” areas to Tarawa Terrace supply wells. Capture zones of particular supply wells are represented by particle flow paths to the respective wells and partly depend on the cell location where particles were introduced into the model. When particles were seeded in the immediate vicinity of ABC Cleaners, particles were entirely captured by pumping at well TT-26 only. Simulated travel time of the particles from the immediate vicinity of the cleaners to the location of well TT-26 was about 3.5 years, under simulated flow conditions representing December 1984. Particles seeded west of the cleaners, however, were also captured by well TT-23 (after 10,000 days). Although well TT-23 was pumped for less than a year before being permanently shut down in April 1985, according to base records.
Mr. Faye displayed a map showing the capture zones of wells TT-26, TT-23, and TT-54, and offered an explanation for the occurrence of PCE at well TT-23 after only a short period of pumping for drinking-water production. He believes that when TT-26 was shut down for any period of time, the capture zone of well TT-54, located directly south of well TT-23, expanded into a highly contaminated section of the TT-26 capture zone. During such periods, contaminated groundwater was transported along flow paths toward well TT-54 and, because of its location in relation to well TT-23, this transport also occurred directly toward well TT-23. Thus, when well TT-23 began operating, groundwater containing PCE was available in the contributing aquifers in the immediate vicinity of the well. Therefore, PCE detected in well TT-23 was possibly not caused by the well immediately capturing PCE from the vicinity of ABC Cleaners. Rather, over time, well TT-23 was capturing contaminated groundwater intermittently transported to its vicinity by pumping at well TT-54, which began operating in 1961. When well TT-23 began routine operations in 1984 for a brief period, resident PCE in the aquifer proximate to the well was likely introduced into the well.
3.3 Analyses of Water-Distribution Systems
Morris L. Maslia, Project Officer, ATSDR
Mr. Maslia presented an overview of the approach for the water-distribution system analyses and discussed field testing performed thus far on present-day water-distribution systems. Highlights of his presentation are summarized below.
Approach to Analyses of Water-Distribution Systems
ATSDR is evaluating two WTP service areas and three water-distribution systems. ATSDR has obtained its information on the piping network from AutoCAD drawings provided by the base’s Environmental Management Division (EMD) staff, field observations, and inquiries to the base’s water-utility staff. This information was needed to develop databases and model input data to calibrate models to present-day conditions.
If water-distribution systems operated completely independent of one another, then all residents served by a particular system would have had the same exposures, and therefore, historical reconstruction of the water-distribution systems would not be necessary. ATSDR could have assumed, based on its groundwater modeling, and application of materials mass balance concepts (“complete mixing” models) that people served by each system would have received the same concentrations of contaminants. However, information collected to date suggests that interconnections have existed between the systems during the study period (1968–1985). Therefore, ATSDR has identified the need to reconstruct historical water-distribution systems to accurately estimate exposures for the epidemiologic study period.
ATSDR considered the following two approaches for reconstructing the water-distribution systems: (1) using historical water-distribution system data (e.g., flows, demands, and cycling on and off of wells) to calibrate models, or (2) developing and calibrating water-distribution models to evaluate present-day conditions and then deconstructing the present-day systems to correspond to the historically configured systems. ATSDR has determined, however, that detailed records of historical data, such as system operations, flows, and demands, do not exist to support using the first approach. Therefore, ATSDR is following the second approach.
Analyses of Present-Day Water-Distribution Systems
Background
Because the required data types, specificity, and frequency for calibrating water-distribution system models to present-day conditions were unavailable, ATSDR established a field testing program to measure and gather these data. ATSDR obtained data from base EMD staff and water-utility operators on pipeline specifications (e.g., locations, sizes, and materials), storage-tank locations, high-lift pumps and head-discharge curves, operations, production, base housing, and facilities.
ATSDR has constructed hydraulically independent models for the present-day water-distribution systems at Hadnot Point, Holcomb Blvd., and Tarawa Terrace. Mr. Maslia explained that ATSDR has gathered data from field tests conducted to date on hydraulics, C-factors* for pipeline characteristics, pump operations, and travel times. Because there are no individual household meters and no data on household consumption, ATSDR initiated a plan to obtain flow data by requesting that the USMC install flowmeters at strategic locations throughout the water-distribution systems. The data would be used to obtain present-day per capita use and diurnal curves for specific housing areas.
*Hazen-Williams C-factors.
From information provided by water-utility staff, ATSDR now understands that each water-distribution system uses a controlling elevated storage tank that allows high-lift pumps to be triggered—according to the water level in the tank—to deliver water to the water-distribution system or to fill other storage tanks.
The results of the C-factor tests, conducted on pipelines of varying materials, diameters, and lengths, were provided to the panel members, and these data have been used for simulations.
ATSDR assigned each building (and its associated pipeline junction in the model) to a demand group (e.g., family housing). Group names were identified through a water-conservation analysis conducted in 1999 to estimate consumption of potable and nonpotable water at the base. A group categorized as “unaccounted for demand” (about 30% of metered production) was assigned because of the disparity between consumption, as determined from the water-conservation analysis, and metered production from the WTPs.
In terms of housing, the Hadnot Point service area (Figure 2) contains one family housing area and multiple bachelor housing areas; the remaining areas are primarily industrial use. Holcomb Blvd., however, has three housing areas; Tarawa Terrace is nearly 100% family housing, except for a few shopping centers.
Field Tests Conducted May–October 2004
Hadnot Point WTP service area, May 2004. This field test was conducted May 24–27 and consisted of three activities:
(1) Liquid calcium chloride (CaCl2), 35% by weight, was injected into the transmission main on the water-distribution system side of the WTP to achieve an elevated conductance and chloride concentration, and recording conductivity and chloride concentration using continuous recording water-quality monitoring data loggers.
(2) A sodium fluoride solution was injected into the transmission main to achieve an elevated fluoride concentration (before the test, the WTP fluoride was shut off so that fluoride concentrations in the water-distribution system pipelines approached background levels of about 0.2 mg/L).
(3) Water-distribution system pressures were monitored with continuous recording data loggers attached to selected hydrants.
In addition to continuously recording tracer concentrations and conductivity, grab samples were collected for quality assurance/quality control (QA/QC) purposes. Samples were analyzed at the Hadnot Point WTP by ATSDR staff and then shipped to the Federal Occupational Health (FOH) Industrial Hygiene and Environmental Laboratory in Chicago, Illinois, for analysis. Twenty-seven hydrants were selected in the Hadnot Point area as monitoring locations. For monitoring conductivity and chloride and fluoride concentrations, nine hydrants were equipped with the Horiba W-23XD dual probe ion detector. For monitoring conductivity, nine hydrants were equipped with the Horiba W‑21XD single probe ion detector, thus providing a total of 18 monitoring locations for continuously recording conductivity data. For pressure measurements, nine hydrants were equipped with continuous recording Dickson PR300 pressure data loggers.
Holcomb Blvd. and Hadnot Point WTP service areas, August 2004. This field test was conducted August 25–27. It consisted of two activities: First, different sections of pipelines of varying lengths, diameters, and material types were tested to collect hydraulic data for calculating roughness coefficients (Hazen-Williams C-factor data). Second, an innovative approach was used for fire-flow testing (for model calibration purposes). Continuous recording-pressure monitoring equipment at several fire hydrants simultaneously recorded variations in pressure as different combinations of hydrants were flowed. Eight sections of pipelines, characterized by three different pipe materials (cast iron, polyvinyl chloride, and asbestos cement), were tested. Pipeline diameters ranged from 6–12 in., pipe lengths ranged from 700–1,672 ft, and flows ranged from 564–1,603 gal/min. Fire-flow tests were conducted at 12 locations. Pipeline diameters ranged from 4–12 in., pipe lengths ranged from 236–1,620 ft, and flows ranged from 773–1,120 gal/min. Fire-flow tests are frequently used in the process of calibrating a hydraulic water-distribution system model. The concept is quite straightforward.
Holcomb Blvd. WTP service area, September–October 2004. This field test was conducted September 22–October 12. It consisted of monitoring fluoride dilution and reinjection in the Holcomb Blvd. WTP area (including Tarawa Terrace and Camp Johnson). The purpose of this preliminary test was to:
(1) estimate travel time between points in the water-distribution system by shutting off and then restarting fluoride at the WTP,
(2) record the fill-and-draw characteristics at the controlling elevated storage tanks (S2323 at Paradise Point and SM623 at Camp Johnson), and
(3) record the sequence of when distribution-system water (with its fluoride concentration) was filling the tanks and when storage-tank water (with its fluoride concentration) was being supplied to the water-distribution system.
Nine locations in the water-distribution system were equipped with the Horiba W-23XD continuous recording, dual probe ion detector data logger. Monitoring locations included the main transmission line from the WTP to the water-distribution system, the Tarawa Terrace treated water reservoir, two controlling elevated storage tanks, and five hydrants located throughout the housing areas. The fluoride at the Holcomb Blvd. WTP was shut off at 1600 hours on September 22. A background concentration of about 0.2 mg/L in the water-distribution system was reached by September 28. At 1200 hours on September 29, the fluoride was turned back on at the WTP. The test continued until loggers were removed and data downloaded on October 12. In addition to the continuous recording data loggers, split grab sample analyses were conducted for QA/QC purposes. Nine rounds of water samples were collected at each monitoring location during the test. For each round, the Holcomb Blvd. WTP water-quality lab analyzed 25 mL of the grab sample water and the FOH Industrial Hygiene and Environmental Laboratory analyzed the remaining 225 mL.
Household Meters
To address the fact that no household meters exist on base, ATSDR is applying the concept of “district metering area” to develop per capita demand in particular areas. To date, 16 Dynasonics magnetic flowmeters have been installed but have not been calibrated because of technical problems encountered in the field (this problem is in the process of being resolved). Mr. Maslia explained that calibration of the meters is the next step planned for field activities. He requested the panel’s input on whether these activities should be pursued and whether the meters would provide useful data.
4.0 Panel Discussions
Throughout the 2-day meeting, panel members asked questions, made comments, and discussed issues related to ATSDR’s modeling efforts and the associated epidemiologic study. In addition, panel members had provided ATSDR with comments before the meeting. As agreed upon by the panel, ATSDR did not respond to premeeting comments, but would consider these issues during ongoing modeling activities and when preparing the final modeling report. ATSDR did, however, provide responses during the meeting to general premeeting comments related to groundwater (responses provided below). This section summarizes ATSDR’s initial responses to premeeting comments (Section 4.1) and discussions and suggestions made by panel members during the meeting on specific topics (Section 4.2).
4.1 ATSDR Response to Premeeting Comments
Morris Maslia, Project Officer, ATSDR
Mr. Maslia highlighted the following overarching groundwater issues introduced by the panel members’ premeeting comments. In doing so, he posed additional questions for the panel to consider during the meeting.
Uncertainty
Several premeeting groundwater comments concerned the uncertainty of evaluating geologic and aquifer characteristics. Some panelists suggested that probabilistic methods be used, such as the Monte Carlo simulation. Mr. Maslia responded that these simulations would be a possible next step, but asked the panel to consider if using probabilistic or uncertainty methods should precede refinement of the Tarawa Terrace model. Also, Mr. Maslia noted that ATSDR will consider using parameter estimation methods to evaluate sensitivities of specific groundwater-flow model parameters (e.g., vertical hydraulic conductivity and recharge).
Modeling Boundaries and Source Conditions
Mr. Maslia stated that ATSDR would consider using sensitivity analysis to assess the nearness of the northern boundary to ABC Cleaners and the potential effect of moving the boundary farther away from the source. He noted that ATSDR was currently modeling advective flow. Mr. Maslia asked the panel members what effect the sensitivity of the model boundary might have when using fate and transport modeling. He added that ATSDR might consider using a genetic algorithm/optimization approach developed by the MESL at the Georgia Institute of Technology, which can use observed concentration data to determine source locations. In this instance, the algorithm uses historically observed values and simulates the source location, assumed to be ABC Cleaners.
Fate and Transport
Mr. Maslia stated that in the future ATSDR intends to conduct complete fate and transport simulations, in addition to advective transport. He added that PCE at Tarawa Terrace is the only constituent currently under consideration for fate and transport analysis. He noted that the advective transport simulations for the Tarawa Terrace area provided preliminary estimates to start ATSDR’s analysis of the more complex contaminant fate and transport modeling analyses.
4.2 Panel Discussions and Recommendations
4.2.1 General Questions on the Epidemiologic Study
Panel members asked several questions to clarify aspects of the epidemiologic study. Questions related to (1) how ATSDR would define and evaluate exposure, (2) how cases of illnesses compared to the general population, (3) who was considered unexposed, and (4) the temporal resolution required for the study.
Dr. Leonard Konikow asked how ATSDR would define exposure and whether the aim was to evaluate exposure by household. Ms. Perri Ruckart explained that the goal of the water modeling was to determine when contamination arrived at the wells and to assess the spatial and temporal distribution of the contaminants by housing area. Mr. Maslia elaborated that the aim is to evaluate exposure at the street level. The water-distribution system is constructed such that a 2-in-diameter pipe goes from the street to the house; consequently, houses are considered in the modeling activities.
Regarding the number of cases of illnesses found in the study group, Dr. Thomas Walski asked how the number compared to the general population. Dr. Frank Bove explained that these cases were identified through a survey, which makes it difficult to compare the numbers. He said that if the verified reported cases and the ones now being verified were combined, there would be a slight elevation of about two times the expected level for some of the health outcomes. Dr. Bove stated that this survey would need to be reevaluated, however, because assumptions were based on information that was doubtful or incorrect.
Dr. Vijay Singh questioned who was living at U.S. Marine Corp Base Camp Lejeune but considered unexposed. Dr. Bove responded that in the past study, it was assumed that about 50% of live births were unexposed because they received water from the Holcomb Blvd. system. However, at present it is unclear whether or not interconnections existed between Holcomb Blvd. and Tarawa Terrace. If frequent transfers of water occurred between the Holcomb Blvd. and Hadnot Point WTPs, then exposure assumptions would require additional evaluation and possible modifications.
Regarding questions about the issue of temporal resolution desired for the study, Dr. Bove explained that the window of exposure depended on the particular disease. For neural tube defects and oral clefts, the exposure point of interest is the first trimester. Due to uncertainty, the study has requested data for the entire year before birth; the team will examine 3 months before and 3 months after conception, and also up to 1 year of life to assess childhood leukemia. At a minimum, the study team hopes to evaluate monthly averages. First, the population of unexposed and exposed individuals must be determined. Then, the concentrations of exposure will be ascertained assuming the data are available.
4.2.2 Lack of Historical Data
ATSDR acknowledged that a lack of historical data exists for the contaminant source, groundwater pumpage and levels, and water-distribution system operations. Panel members discussed these issues, indicating the importance of data discovery to obtain records of PCE use at ABC Cleaners and how ATSDR could account for time frames when data are unavailable. The panelists offered the following views.
Source
Dr. James Uber suggested that ATSDR focus on working back to the source to estimate the amount of PCE used each month. He questioned if more effort was needed to model the process of dry cleaning operations to assess the amount of contaminant lost and diluted in water and other aspects of the operation. Dr. Walski suggested speaking to the owner or employees of the cleaners before conducting laborious data discovery (e.g., obtaining tax records).
Groundwater
ATSDR asked the panel members how the agency should address the lack of pre-1978 observed water-level data. Of particular interest is determining the amount of uncertainty and variability in arrival times (e.g., 6 months or a few years) that could be tolerated by the epidemiologic study.
Dr. Konikow asked if ATSDR had any pumpage data before 1978. According to Mr. Faye, ATSDR had periodic snapshots of information, but it was sporadic and not always available for specific years (e.g., ATSDR has data for 1962 and 1971). Dr. Konikow explained that ATSDR could calibrate the model for periods when water-level data are available, and impose the stresses for the preceding time frame when data are lacking. He noted, however, that the issue of concentrations would still remain. Mr. Faye hoped to obtain adequate estimates through mass loading, but noted that this was only a single source.
Water-Distribution System
ATSDR asked the panelists whether it would be feasible or necessary to simulate the complete 18-year historical period on a continuous basis.
Three panelists indicated that continuous modeling was unnecessary considering ATSDR was dealing with a single point of entry for much of the study period. One panelist noted, however, that ATSDR should consider calculating potential exposures for a continuous time series. Reconstructing probability distributions for the breakthrough curves and the contaminants entering the system was recommended, as such probabilistic distributions would provide a time series that could be correlated to individuals’ activities.
4.2.3 Addressing Uncertainty and Variability
During meeting presentations, ATSDR discussed uncertainty and variability in modeling groundwater and water-distribution systems for the study period. After discussions, most panelists agreed that ATSDR should use probabilistic analyses to address geohydrologic uncertainty. The panelists also suggested that additional information was necessary to adequately address issues of interconnections between WTPs. A summary of panelists’ comments is presented below.
Groundwater
ATSDR asked the panel if the team should consider using probabilistic analyses to assess the variability and uncertainty of model parameters and contaminant concentrations at public supply wells. ATSDR also questioned panel members about their particular preferences in probability analysis modeling codes.
Many panelists agreed that ATSDR should use some type of probabilistic analysis to (1) assess the impact of water blending of contaminated and noncontaminated wells, and (2) assess the uncertainty of the concentration arrival times at wells. Dr. Robert Clark generally approved of using probabilistic analysis, but noted that doing so would potentially incorporate an unnecessary level of complexity. Dr. Walski expressed a preference for “sensitivity analysis” to emphasize parameters to which the model is most sensitive.
Water-Distribution Systems
TCE is the major contaminant of interest at Hadnot Point. ATSDR acknowledged uncertainty regarding interconnections between the Hadnot Point and Holcomb Blvd. WTPs, and asked the panel if ATSDR should consider probabilistic analyses to better quantify interconnection issues, ultimately determining a probabilistic estimate of exposure frequency at Holcomb Blvd. and Hadnot Point. The panel engaged in a discussion of the implications and uncertainties associated with the possible interconnections. Highlights of the discussion follow.
What is known about the interconnections?
The Holcomb Blvd. WTP began operations sometime between 1971 and 1973. Following the onset of operations, the frequency of water exchange between the Hadnot Point and Holcomb Blvd. WTPs is unknown. ATSDR found information confirming that an interconnection existed between Holcomb Blvd. and Hadnot Point in January 1985. Dr. David Dougherty indicated that a connection between the Holcomb Blvd. and Tarawa Terrace WTPs occurred sometime between 1983 and 1985, and evidence suggests that people living in Holcomb Blvd. received Hadnot Point water before 1971.
Mr. Brynn Ashton, with the EMD, USMC Base Camp Lejeune, explained that much uncertainty exists about when the Hadnot Point and Holcomb Blvd. systems were interconnected. Currently, the base must obtain approval from the State to interconnect the systems. There are two operating permits for the systems and they are maintained separately. Dr. Bove questioned whether the State might have a record of each time the systems were connected.
How does interconnectivity of systems affect selection of exposed and unexposed populations for the epidemiological study?
Mr. Benjamin Harding noted that ATSDR needed to find on-base populations that were exposed or unexposed to TCE. He questioned whether the Holcomb Blvd. population (during periods of no interconnections) could potentially be used for the on-base unexposed population. Dr. Bove cautioned about doing this because of known interconnections. Mr. Harding asked about the time frame needed for the unexposed population and questioned whether ATSDR could use a period within the study time frame (e.g., 1970–1975) when the systems were not connected. In response, Dr. Bove indicated that this could not be done; an exposed and unexposed population must be determined for the entire study period.
Should interconnections be modeled?
Mr. Harding indicated that he was unsure how the interconnections could be modeled when the time frames of interconnections were unknown. Even if ATSDR determines when the systems were or were not connected, Mr. Harding suggested that attempting to model interconnections may not be an effective use of agency resources.
Should probabilistic techniques be used?
Panelists indicated that ATSDR should use probabilistic analyses. Mr. Harding highly recommended applying probabilistic simulation methods (e.g, Monte Carlo analysis) to represent uncertain variables. Dr. Clark suggested that ATSDR use the PRP approach (developed by Dr. Steven Buchberger at the University of Cincinnati) to evaluate use at the individual household level. Instead of using household demands, Dr. Walski suggested considering the time that each well is on as the stochastic variable because this would produce the most variability in the results.
4.2.4 Suggested Modeling Approaches, Modifications, and Considerations
During the meeting, ATSDR detailed its modeling approaches and responded to panelists’ questions regarding activities conducted to date and those planned for the future. After a detailed discussion, the panelists offered the views presented below. Overall, panelists recommended that ATSDR perform extensive data discovery (e.g., obtaining information on events chronology and interconnections) and use simplified mixing models instead of developing more complex historically reconstructed water-distribution system models.
Groundwater
ATSDR is conducting groundwater-flow modeling as a basis for the fate and transport analysis. Transient modeling was initially conducted from 1978–1994; a period that corresponds to almost all available water-level data. ATSDR has recently received monthly water-use data at Tarawa Terrace and other WTPs from the base for most of 1980–1985. Additional efforts will be made via data discovery (e.g., ascertainment of deposition documents and examining tax records) to determine the actual use of PCE at ABC Cleaners. ATSDR asked the panel if any modifications should be made to the groundwater-modeling approach and if the model should be expanded to include the Holcomb Blvd. and Hadnot Point areas. A summary of the panelists’ views is presented below.
Panelists did not recommend that ATSDR develop one model to cover the Tarawa Terrace, Holcomb Blvd., and Hadnot Point areas.
Instead of refining the existing model, panelists questioned whether resources should be applied to understanding the impact of other groundwater-contamination sources, particularly regarding the requirements of the epidemiologic study.
Dr. Uber suggested that the team describe the objectives of the groundwater-modeling effort in terms of the needs of the epidemiologic study.
Dr. Walski suggested performing an overall classification of the areas where contamination was known to occur, and the areas without contamination. People in the contaminated areas would be considered exposed and those in uncontaminated areas would be classified as unexposed. He also recommended that ATSDR use modeling to concentrate on the areas where contamination and exposure are unknown. As a next step, he recommended ATSDR prepare a matrix to determine a time frame when contamination did or did not occur.
Dr. Eric LaBolle asked whether ATSDR could use the preliminary groundwater-modeling results to provide a time range when the contamination could have arrived at well TT-26. He made the point that if well TT-26 had contamination during the entire study period, then the role of groundwater modeling might require much less detail than if groundwater modeling was being used to predict an arrival curve to the well.
Dr. LaBolle stated that the calibration of the transport model should focus on periods when the most reliable data are available.
Dr. Dougherty recommended that ATSDR move the northern boundary farther away from the source, but omit the sensitivity analysis.
Dr. Walski considered the historical pattern of contamination at Hadnot Point too complex to model because the numerous sources cannot be correlated to particular wells.
Panelists suggested that ATSDR use smaller time steps, as drying and rewetting of the groundwater-flow model cells could lead to convergence problems. In this regard, Dr. LaBolle also recommended using a solver with dual-convergence criteria.
Dr. Konikow recommended performing grid-sensitivity testing to determine whether the grid spacing is appropriate. He suggested that ATSDR use 100-ft and 25-ft cell spacings to assess any differences. He said to use a 100-ft cell spacing if there are no differences; if there are differences and depending on the nature of these differences, Dr. Konikow suggested using a finer grid spacing. He stated that expanding the modeling effort to Holcomb Blvd. and Hadnot Point areas was dependent on whether ATSDR wanted to apply a fate and transport model to those areas. He indicated that ATSDR needed to have the results from Tarawa Terrace before determining if the models should be applied to other areas.
Dr. Singh recommended that ATSDR consider a variable grid size, using finer grids closer to the source and coarser grids away from the source.
Dr. Clark recommended that ATSDR consider accommodating degradation processes during fate and transport simulations. Not accounting for degradation products (e.g., vinyl chloride) could bias the simulated mass balance of contaminants.
Water-Distribution Systems
ATSDR asked the panel members for recommendations to improve the models and whether three separate models (for Hadnot Point, Holcomb Blvd., and Tarawa Terrace) should be developed. In addition, the agency asked panel members to address whether or not ATSDR should model the Holcomb Blvd. and Hadnot Point WTP service areas separately.
Panelist opinions are detailed below, with most panelists emphasizing the need to collect additional data before refining the modeling approach.
Dr. Clark and Mr. Harding commented that developing three models to address each water-distribution system would be appropriate for understanding present-day conditions. Mr. Harding noted that a simple mixing model would suffice for historical reconstruction purposes.
Panelists agreed that more data discovery is required before determining the appropriateness of ATSDR’s approach to modeling Holcomb Blvd. and Hadnot Point as interconnected water-distribution systems.
Panelists were unsure that refining the models would be necessary because the blended water is distributed to everyone in the Tarawa Terrace system. Refining the model might not increase the information on exposure.
Panelists concurred that the time frame of interconnections might require sophisticated modeling, though not yet.
Dr. Clark recommended using models to enable typical diurnal curve exposures, but Dr. Walski did not see the added value, given the limited data. Dr. Konikow pointed out that if the interconnection was not the only source of water to Holcomb Blvd., then a model could be useful in determining areas that did or did not receive Hadnot Point water.
Panelists emphasized the need to demonstrate that contaminants did or did not arrive at well TT-26. Dr. LaBolle suggested ATSDR use a model that predicts the uncertainty in the arrival time and that ATSDR’s analysis should address geologic uncertainty. Dr. LaBolle noted that ATSDR might want data preceding the proposed time frame if other health outcomes are to be examined (e.g., adult cancer).
If water-distribution systems are not completely mixed, as suggested by field testing, Dr. LaBolle recommended focusing on a restricted area of the system. Dr. Clark commented on the need to consider how the blending in a system could cause different household exposures.
4.2.5 Parameter Estimation
ATSDR asked the panel whether the agency should consider using parameter estimation to assess model parameter sensitivity. The varying views expressed are highlighted below. Most panelists agreed that parameter estimation was needed, but that it should be used in parallel with other efforts to substantiate predictions.
Dr. Clark recommended developing an independent dataset to validate predictions in addition to parameter estimations. He stated that this would be essential for the regression estimations.
Dr. Singh recommended using more efficient and powerful parameter estimation techniques in combination with genetic programming (i.e., load times). Because of the limited amount of data, this would be a much better approach than using only regression.
Dr. LaBolle expressed concern about handling the uncertainty and variability in the subsurface. He stated that the current model constrained the characterization of the subsurface and, therefore, lacks the flexibility to address the uncertainty in the subsurface heterogeneity and its potential effects on exposure. Also, parameter estimation would be needed if ATSDR is to refine arrival times of contaminants at the wells.
Dr. Dougherty commented that model estimation was more significant than parameter estimation.
4.2.6 Groundwater-Recharge Data
ATSDR asked the panel whether its methods to derive monthly groundwater-recharge rates were sufficient and requested recommendations on methods that might provide more refined estimates. Panelists offered varying opinions and issues for ATSDR to consider. A summary of these comments is presented below.
Dr. Clark recommended using meteorological data to obtain estimates.
Dr. Konikow asked whether ATSDR considered the possibility that recharge might be higher than natural recharge in urban areas as a result of various activities and conditions (e.g., car washing and leaky pipes). In addition, septic tanks and collection systems are a source of recharge.
Dr. Dougherty suggested that to reduce the roughness of the estimate of recharge, ATSDR should consider using a simple model to represent the transport through the unsaturated zone to groundwater. At Tarawa Terrace, accretion at the contamination source is especially important because a septic system was employed. In addition to demonstrating the impacts of the preceding panel comments relative to groundwater conditions, such a simple model could smooth out some rewetting problems.
4.2.7 Project Schedule
ATSDR has allotted a total project schedule of 3 years to complete this project, including delivering all historical reconstruction analyses to agency epidemiologists, and planning and organizing a peer review assessment of the final report products. Given panel deliberations thus far, ATSDR asked whether its schedule was appropriate and what, if any, changes should be made to the time frame.
Most panelists agreed that this time frame was appropriate. The main factors that will drive the schedule are (1) data discovery, (2) methods to better understand the uncertainty regarding geohydrologic properties at Tarawa Terrace, and (3) using full-scale fate and dispersive transport models.
4.2.8 Field Testing
In December 2004 and January 2005, Dynasonics, Inc., and AH Environmental Consultants, Inc., under contract to USMC Base Camp Lejeune, installed 16 flowmeters at selected locations throughout the Tarawa Terrace, Holcomb Blvd., and Hadnot Point water-distribution systems. The ATSDR water-modeling team used initial model simulations, field verification, and discussions with AH Environmental Consultants, Inc., staff to select meter locations. Metered flow measurements were considered necessary because of inconsistencies between supervisory control and data acquisition (SCADA) recorded data (provided by USMC Base Camp LeJeune) and a water-conservation analysis study of base water-utility operations. The conservation analysis indicated an approximate 30% difference between water produced and water used. For the epidemiologic study, ATSDR determined that these inconsistencies and differences are unacceptable. Obtaining measured flow data at locations throughout the water-distribution systems would also assist the ATSDR water-modeling team with hydraulic and water-quality model calibrations.
ATSDR asked panel members if the water-distribution system tests could provide sufficient data to reliably calibrate the present-day models, and if these tests could appropriately develop the per capita consumption data and diurnal curve characteristics. ATSDR also asked for the panel’s comments on the novel fire-flow testing method for use with model calibration. Because of difficulties encountered with flowmeter field calibration, ATSDR also requested panel members’ input on the advisability of proceeding with additional calibration efforts.
Overall, the panelists commended ATSDR on the thoroughness and quality of the testing conducted to date. Specific observations and suggestions from the panelists follow.
Regarding the need to proceed with flowmeter calibration, Dr. Walski suggested that ATSDR proceed with the calibration because the meters were already installed, but he did not recommend allocating a lot of resources to this task. Dr. Walski was concerned that useful data would not be obtained because the meters are limited to a 2 ft/s threshold. Nonetheless, he recommended that ATSDR calibrate the meters and collect data for a 1-month period. Depending upon the quality of those data, the team could determine if the effort should be conducted for a longer period.
Dr. Walski suggested that ATSDR use a mass-balance approach and, as noted during the meeting, SCADA data would be required. SCADA equipment at the base, however, is not up-to-date and is of questionable reliability. Dr. Walski explained that it is usually more economical to recalibrate the SCADA system than to install meters.
Mr. Harding noted that reliable storage-tank elevation data were necessary for calibrating the model. Thus, if doubt existed concerning the SCADA system’s reliability, the issue needed to be settled because it is a boundary condition.
Dr. Clark commented that the best approach for developing diurnal patterns would be to use the district metering approach, particularly considering that ATSDR has no other available data.
Mr. Harding cautioned ATSDR to consider the reason for obtaining water-use estimates, which he indicated were unnecessary at Tarawa Terrace except for handling the issue of well cycling. If ATSDR was measuring tank flows and levels at the plant only to establish water-use characteristics at the WTP, then he concurred with ATSDR’s field testing plan.
5.0 Discussions and Responses to Questions from the Public
Mr. Jerry Ensminger (USMC, retired), a public member involved in contamination issues at the base since 1997, asked to address the panel with his comments and questions. Mr. Ensminger read a prepared statement submitted on behalf of Major Thomas A. Townsend (USMC, retired). Major Townsend and his family lived in Tarawa Terrace from January 1955 to May 1956*. The statement is provided verbatim in the meeting transcript (on the CD that accompanies this report) and summarized herein. Panel Chair Dr. Barry Johnson asked for Mr. Ensminger’s and Major Townsend’s comments to be made part of the public record and suggested to Dr. William Cibulas, director of ATSDR’s Division of Health Assessment and Consultation, that the agency provide responses to his serious questions.
*Subsequent to the panel meeting, Mr. Townsend informed ATSDR that he also lived in Tarawa Terrace from August 25, 1965–July 30, 1967.
According to Mr. Ensminger, building of the Tarawa Terrace housing area began in 1952. He provided the history of the eight supply wells constructed in Tarawa Terrace: TT-26 in 1958; TT-52, TT-53, and TT-54 in 1961; and TT-27, TT-31, and TT-25 in 1972, 1973, and 1980, respectively. Mr. Ensminger stated that an additional well, TT-23, was constructed in 1984, but was not used for production because PCE contamination was detected. He provided panel members with supportive documentation for his statements. He read results from sampling events conducted in 1982, 1984, and 1985, indicating that PCE (up to 104 ppb in 1982), TCE (up to 8.1 ppb in 1985), and DCE (up to 12 ppb in 1985) were detected in these on-base supply wells. His specific questions and comments are highlighted below, with responses by the ATSDR team and panelists.
Statement: Mr. Ensminger asked the panel where the base obtained water to distribute to more than 1,800 housing units and commercial operations in Tarawa Terrace following the WTP closure in February 1985.
Response: Dr. Peter Pommerenk indicated that a pipeline was built from the Holcomb Blvd. WTP in about 1984, which directly connected to the raw-water tank. Therefore, he stated his belief that Tarawa Terrace residents received treated water from the Holcomb Blvd. area. According to reports received and reviewed by Mr. Faye, only wells TT-23 and TT-26 were taken offline in February 1985; the remaining wells continued to operate, possibly throughout 1985 and 1986.
Statement: Mr. Ensminger asked the panel members to refer to a document he provided to them dated March 1, 1985, which discusses alternatives for providing water to the Tarawa Terrace area. He questioned why the brief would exist if a pipeline had been installed in 1984. In referring to this same brief, Mr. Ensminger noted the apparant lack of standard terminology to describe the status of wells (e.g., inactive and active).
Response: Dr. Pommerenk acknowledged that this was a good question, and that he was aware of the pipeline’s construction date and his belief—that Tarawa Terrace residents received treated water from the Holcomb Blvd. area—was based on the assumption that water was supplied through the pipeline. Dr. Pommerenk indicated that, in fact, water may not have been flowing through the pipeline at that point in time. Dr. Walski stated that reporting terminology would depend on whoever recorded the information.
Statement: Mr. Ensminger questioned reports that indicate a well was taken offline due to contamination and later taken offline again as a result of contamination, which suggested to him that these wells had been placed back online during some interim period.
Response: Dr. Pommerenk commented that North Carolina required water systems to report when a well was completely taken out of service. He also noted that sometimes a new well was drilled at USMC Base Camp Lejeune and was given the same number as an old well. Mr. Ensminger wanted to know where and for which wells this occurred, but Dr. Pommerenk did not have the exact numbers. According to documents received by Mr. Faye, new wells were sometimes installed and given the number of the well to be replaced (e.g., new HP-645), but this old number did not stay in the system as the new well was given a unique permanent number.
Statement: Mr. Ensminger asked when the eight wells at Tarawa Terrace were completely out of service and abandoned.
Response: Mr. Faye acknowledged that this was a critical question to address, and that he was relatively certain that wells TT-23 and TT-26 were completely removed from service in February 1985. He expressed his belief that the remaining wells at Tarawa Terrace probably continued operating in 1985 and 1986. Though it was possible, he believed that it was improbable that Holcomb Blvd. could have supplied its original service area and that of Tarawa Terrace during 1985–1986. ATSDR has obtained operations records for the WTPs (e.g., monthly discharge rates) from 1980–1984 and 1987–1989. No such records have been located for 1985–1986.
In response, Mr. Ensminger referred to a memorandum from 1991, which indicated that wells TT-23, TT-25, and TT-26 had pumps and would be able to operate; but, these wells were supposedly closed at this time. Mr. Faye explained that this was a note from the base responding to a request asking which wells were operational so that they could be sampled. According to U.S. Navy records, weekly water samples were collected to identify contaminants in the Tarawa Terrace WTP from March 1986 to March 1987.
Statement: Mr. Ensminger asked how ATSDR could determine whether the Holcomb Blvd. WTP received raw water from Tarawa Terrace well fields if an auxiliary line was in place between Tarawa Terrace and the Holcomb Blvd. WTP in June 1985.
Response: Mr. Faye said he had a report suggesting that Tarawa Terrace wells may have been used in 1989 for an extended period (throughout that year or longer) to supplement the water supply to the Holcomb Blvd. WTP. Dr. Walski said that the base would have had to construct another line that went across the systems and a raw-water line because raw and treated water cannot be sent through the same pipes. Mr. Faye agreed that there could have been dual pipes, but a freeze was reported, causing the pipes to collapse into Northeast Creek and no further details are known.
Mr. Maslia clarified that ATSDR recently obtained this report (dated March 1991). The author discussed historical aspects of various well fields, and indicated that the Tarawa Terrace wells supplied water to the Holcomb Blvd. WTP in 1989.
Mr. Ensminger referred the panel and ATSDR back to the March 1985 action brief, which mentions the potential future use of raw water from Tarawa Terrace wells and the availability of water from the Holcomb Blvd. and Hadnot Point WTPs. He said that this statement suggested that the interconnection between Holcomb Blvd. and Hadnot Point was being opened.
Mr. Maslia responded and noted that a previous panel, which convened in February 2005 to address whether additional health studies would be necessary or feasible, repeatedly asked if the interconnection could be modeled. Past statements have suggested that the interconnection was for emergency purposes, but the panel wanted to know if several weeks to many months of interconnection could be modeled, which would require application of complex models.
Statement: Mr. Ensminger asked how the water-distribution systems at the base compared against civilian water systems during the same time frame.
Response: Mr. Maslia shared information about the water-distribution system obtained from field tests and USMC Base Camp Lejeune water-utility and EMD staff. In general, the systems are operated to maintain nearly constant pressure and water levels in the storage tanks, except for one controlling storage tank in each water-distribution system area. The base uses a completely different operational system than other water-distribution systems he has seen. The agency lacks specific information on diurnal demand and ATSDR is still learning more about the water-distribution systems at the base. Dr. Clark asked if the base currently met the Safe Drinking Water Act standards; Mr. Maslia said that it did. Dr. Walski stated that the base operated its water-distribution systems more conservatively than other systems he has seen throughout the country.
Statement: Mr. Ensminger asked what results could be provided to the public about the flowmeters that were installed and whether the results met ATSDR’s expectations.
Response: According to Mr. Maslia, a recommendation was made by ATSDR to install flowmeters throughout the three water-distribution systems being studied (Hadnot Point, Holcomb Blvd., and Tarawa Terrace) to quantify and understand how water flows to different areas and to attempt to establish demand and diurnal water-use patterns. The agency identified 16 locations where the flowmeters should be installed. Contractors and subcontractors to the base installed flowmeters in December 2004 and January 2005. As of March 2005, the meters have been operating, but have not been successfully calibrated. ATSDR is in the process of working with the USMC and its contractors and subcontractors on calibrations. To date, ATSDR has not obtained useful nor reliable information from the flowmeters.
Statement: Mr. Ensminger asked why the calibration was being delayed.
Response: Mr. Maslia replied that this was due to technical and resource issues. The effort requires that certain valves need to be shut off and would require ATSDR personnel to be onsite to assist with calibration procedures. ATSDR has been able to make some onsite visits to assure quality control associated with flowmeter calibration, but the effort to calibrate the flowmeters has not yet been successful.
Statement: Mr. Ensminger asked if ATSDR has received the historical documentation from the base necessary to conduct its activities.
Response: Mr. Faye said that the base has provided extremely useful information regarding well data, UST removal documents, and RI/FS investigations at Tarawa Terrace. Regarding well data, ATSDR has a considerably complete record of the wells drilled at Holcomb Blvd., Hadnot Point, and Tarawa Terrace dating back to the early 1940s through about 1987 or 1988. These data were provided by the USGS. However, well data do not include operational and construction information. The agency has also received extensive records on additional wells completed by the base and has requested the locations and other data regarding these wells. He noted that the records concerning RI/FS and UST removal studies at Tarawa Terrace have been helpful, and that the numerous reports received from the base are complete. ATSDR has also requested data for the RI/FS and UST removal reports for Holcomb Blvd. and Hadnot Point, which the agency anticipates receiving in the near future.
Mr. Brynn Ashton, with the EMD, USMC Base Camp Lejeune, also responded to Mr. Ensminger’s question. Mr. Ashton has been heading the effort to provide requested documents to ATSDR. He noted that recordkeeping across the base is inconsistent and some information might not be as organized for some of the WTPs. However, the base commandant is making sure that ATSDR receives any requested records that are available.
Statement: According to Mr. Ensminger, the historical well data and water-system data have been extracted from the plant account records*. He questioned why this was not provided to ATSDR.
*Plant Account Facilities Inventory Listing of Buildings and Structures, 30 June 1990, Marine Corps Base, Camp Lejeune, North Carolina.
Response: Mr. Ashton replied that account data are minimal and that the base has provided data that are available to ATSDR. These data contain square footage of buildings, number of facilities, certain category codes, and years of construction. He noted that ATSDR has also been provided with a contact if additional information is needed and available.
Statement: Mr. Ensminger asked how long North Carolina has required separate permits for multiple water systems.
Response: Mr. Ashton was unsure, but could research the dates when the base obtained its permits for the systems.
Statement: Mr. Ensminger questioned if the limited number of wells originally designated to the Holcomb Blvd. water-distribution system could have been adequate for the demand of the service area. Also, regarding the flowmeters, he asked if installing choke points would increase the accuracy of the data.
Response: Dr. Walski replied that this is a remaining question, but he would suggest that ATSDR not invest in installing choke points until the agency knew that the data required additional quality.
Statement: Mr. Ensminger stated that the base’s Installation Restoration Program has accurate data for each well contaminated in the Hadnot Point system, and also has information on the contamination sources. Therefore, data are available for reconstructing the exposures to that system.
Mr. Ensminger made additional statements throughout the 2-day meeting. During discussions on historical dry-cleaning operations, he reminded the group that the Vietnam War took place from 1965–1972, thus increasing the base population and dry-cleaning activities. He suggested obtaining tax records to assess the quantity of PCE used by ABC Cleaners. According to Mr. Ensminger, although the owner of the cleaners is deceased, depositions were conducted before his death and are available for review.
During panel discussions on Tarawa Terrace wells, Mr. Ensminger referenced a PCE detection of 215 ppb collected at the tap in February 1985, immediately before the wells were closed. Regarding contamination of the Hadnot Point water-distribution system, he stated that earlier records were available for the Hadnot Point system than for the Tarawa Terrace system. He cited a report conducted by the U.S. Army Hygienic Team in October 1980, which contained analytical data identifying chlorinated hydrocarbons at high levels in the Hadnot Point system. Mr. Ensminger stated that the well with the highest detected concentration (well 651, 27,000 ppb of VOCs) was constructed in 1972 in the back corner of a disposal lot.
In addition, Mr. Ensminger noted his skepticism of the USMC and its personnel in their involvement in ATSDR’s activities. He expressed concern that the base had intentionally provided ATSDR with incorrect water-distribution system data. ATSDR’s data indicates that Holcomb Blvd. provided water to all housing areas in the main area of the base throughout the 10-year period from 1993–2003, whereas in actuality, it was Hadnot Point that provided the water until August 1973. He hoped that the panel and ATSDR understood his skepticism, but he wanted them to understand that he and a lot of other people would like to know how their children became sick.
6.0 Summary of Recommendations from Panel Members and ATSDR’s Response
At the end of the meeting, the panel chair, the panel members, and ATSDR agreed that panel members would individually provide overall final comments, recommendations, and conclusions to ATSDR. Specific comments and recommentations from each panel member are provided in the verbatim transcript of the meeting (Volume II) on CD-ROM. The recommendations and ATSDR’s responses are grouped into five generalized categories.
6.1 Data Discovery
Panel members recommended that ATSDR expend additional effort and resources in the area of conducting more rigorous data discovery activities. To the extent possible, the agency should augment, enhance, and refine data it is relying on to conduct water-modeling activities.
ATSDR agrees with the panel recommendation. The agency is planning to devote additional resources and work with its partners and contractors to implement data discovery activities.
6.2 Chronology of Events
Panel members recommended that ATSDR focus its next efforts on refining its understanding of chronological events. These need to include documenting periods of known contamination, times when water-distribution systems were interconnected, and the start of operations of the Holcomb Blvd. WTP.
ATSDR agrees with the panel recommendation. The agency is planning to devote additional resources and work with its partners and contractors to obtain updated information so that the water-modeling team can refine its understanding of the chronology of contamination events.
6.3 Groundwater Modeling, Tarawa Terrace Area
Panel members made several recommendations with respect to groundwater modeling and associated activities for the Tarawa Terrace area, including the following:
(1) conduct sensitivity and uncertainty analyses to refine initial estimates of model parameter values,
(2) determine sensitivity of model to grid/cell sizes and boundary conditions,
(3) refine on/off cycling patterns of water-supply wells, and
(4) conduct fate and dispersive transport analyses.
ATSDR agrees in principal with the panel recommendations. The water-modeling team is planning to devote significant effort in conducting sensitivity and uncertainty analyses and in developing a calibrated fate and dispersive transport model for the Tarawa Terrace area.
6.4 Data Analyses, Hadnot Point Area
Panel members recommended that ATSDR proceed with assessment of data to develop an understanding of geohydrologic and groundwater-contamination characteristics for the Hadnot Point area. These activities would be required before initiating additional modeling activities for the Hadnot Point area. Panel members also recommended that additional efforts be put into determining periods of interconnection between the Hadnot Point and Holcomb Blvd. water-distribution systems.
ATSDR agrees with the panel recommendation. The agency is planning to devote additional resources and work with its partners and contractors to implement the panel recommendations.
6.5 Water-Distribution System Analyses
Panel members commended ATSDR for the vigor and quality of its field investigation and current model simulations of the water-distribution systems. Because flowmeters are already installed, members recommended that ATSDR proceed with collecting data from the flowmeters, but not initiate any additional field-testing activities. Panel members recommended that the water-modeling team consider using more simplified mixing models to quantify historical exposures to drinking-water supplies. (More complex modeling might be warranted if data discovery shows that the water-distribution systems had a greater frequency of interconnectivity.)
ATSDR agrees with the panel recommendation. The agency has concluded its water-distribution system field-testing activities. Additionally, the water-modeling team will be using simplified mixing models as a first estimate of historical exposures to contaminated drinking-water supplies.
7.0 Acknowledgments
ATSDR would like to acknowledge the assistance and contribution of Dr. Barry L. Johnson, Assistant Surgeon General (retired), for his efforts in chairing the expert panel. Through his efforts, ATSDR has received valuable comments and recommendations from panel members that will assist the agency in focusing future efforts and resources in completing its analyses.
ATSDR would also like to acknowledge Jane Eggleston, Ron Spencer, and Twila D. Wilson of the U.S. Geological Survey, Tallahassee, Florida, for their editorial, cartographic, and page-design skills in preparing this document.
Expert Peer Review Panel Evaluating ATSDR’s Water-Modeling Activities in Support of the Current Study of Childhood Birth Defects and Cancer at U.S. Marine Corps Base Camp Lejeune, North Carolina
Analyses of Groundwater Resources and Present-Day (2004) Water-Distribution Systems, March 28–29, 2005
Morris L. Maslia, Editor
Appendix A—Preliminary Draft Agenda, Charge to the Panel, and Questions and Issues for Discussion on Groundwater and Water-Distribution Systems
Preliminary Draft Agenda
Day 1 – March 28, 2005
8:30 Housekeeping Rules: Morris L. Maslia
8:35 Opening Remarks and Introduction of Chair: Tom Sinks, Acting Director, NCEH/ATSDR
8:45 Opening Statement and Presentation of Charge: Panel Chair, Dr. Barry L. Johnson, Assistant Surgeon General (Retired)
Introduction of Panel Members, Affiliations, and Related Experiences
9:00 Introduction of Camp Lejeune Epidemiologic Study Team: Frank Bove
Introduction of Water-Modeling Team: Morris L. Maslia
9:15 Summary of Water-Modeling Activities: Morris L. Maslia
Groundwater Modeling—Overview: Morris L. Maslia
Approach, Field Data, and Details: Robert E. Faye
10:15 Break
10:30 Panel Discussion and Answers to Questions & Issues: Groundwater
11:45 Lunch
1:00 Panel Discussion and Answers to Questions & Issues (continued)
2:15 Break
2:30 Panel Chair Accepts Statements and Questions from Observers*
(Repeat Statement of Purpose of Panel): Barry L. Johnson
3:30 Review/Discussion of Panel Responses to Questions & Issues: Groundwater
4:00 Overview of Present-Day (2004) Water-Distribution Systems: Morris L. Maslia
5:00 Adjourn for the evening
Day 2 – March 29, 2005
8:00 Housekeeping Rules: Morris L. Maslia
8:05 Opening Statement and Re-Introduction of Panel: Barry L. Johnson, Panel Chair
8:15 Overview/Refresher of Analyses of Present-Day (2004) Water-Distribution System:
Morris L. Maslia
8:30 Panel Discussion and Answers to Questions & Issues: Water-Distribution Systems
10:00 Break
10:15 Panel Discussion and Answers to Questions & Issues: Water-Distribution Systems
12:00 Working Lunch: Address Panel Charge
1:00 Review/Discussion of Panel Responses to Questions & Issues: Water-Distribution Systems
1:30 Panel Chair Accepts Statements and Questions from Observers*
(Repeat Statement of Purpose of Panel): Barry L. Johnson
2:30 Panel and ATSDR Water-Modeling Staff Meet in Executive Session to Craft Panel Communiqué
3:30 Public Issuance of Panel Communiqué (Response to Panel Charge): Barry L. Johnson
4:00 Meeting adjourned
*The Panel Chair will advise the public attendees of the ground rules and request questioners to supply their names and affiliations. All questions will be addressed to the Panel Chair, only. The Panel Chair will solicit responses from panel members if questions are deemed to be within the panel’s responsibility.
Charge to the Panel
The Agency for Toxic Substances and Disease Registry (ATSDR) is requesting the panel’s opinion with respect to the following questions. ATSDR is seeking a majority opinion with opposing views.
1. Will ATSDR’s approach of using “50-ft cell sizes” for groundwater modeling and “all pipes” networks for water-distribution system models provide sufficient detail required by the epidemiologic case-control study? Should courser/variable-spacing groundwater-model grids or “skeletonized” pipe networks for water-distribution system models be considered in an effort to reduce the length or duration of modeling activities?
2. Is the ATSDR approach of simulating monthly conditions using water-distribution system models sound, or should ATSDR consider using a continuous simulation for the historical period (1968–1985)? If continuous simulation should be used, does this approach:
a. Increase or decrease the work effort with respect to modeling activities?
b. Increase or decrease the level of uncertainty and variability of simulated results?
3. Based on information provided by ATSDR to the panel, are there modifications or changes that ATSDR should consider making in its approach to modeling:
a. Groundwater resources at Camp Lejeune?
b. Present-day (2004) and historical reconstruction of water-distribution systems serving Camp Lejeune?
If, in the panel’s majority opinion, ATSDR should consider changes in its approach, what specific changes does the panel suggest?
4. Compared with other publicly documented historical reconstruction analyses, is the 3-year project schedule for completing all historical reconstruction modeling activities appropriate and realistic for the amount of work and level of detail required by the epidemiologic study? If, in the panel’s majority opinion, ATSDR should modify the project schedule, what specific actions and activities does the panel suggest ATSDR take to modify the project schedule?
Questions and Issues for Discussion
Groundwater (includes fate and transport)
• Based on groundwater-modeling results presented, what modifications, if any, should ATSDR make?
• Should ATSDR use the same level of detail (50-ft cells) and expand the groundwater model to include the Holcomb Boulevard and Hadnot Point areas? If so, what level of increase in effort (time and manpower) does the panel envision for this effort?
• Rather than developing three distinct groundwater-flow models (Tarawa Terrace, Holcomb Boulevard, and Hadnot Point areas), should ATSDR consider developing one model covering all areas (i.e., simulate creeks and rivers as internal drains)?
• Should ATSDR consider using a parameter estimation (non-linear regression) approach to assess parameter sensitivity? If so, when should ATSDR begin this process?
• Should ATSDR consider using probabilistic analyses to assess the variability and uncertainty of model parameters and variability and uncertainty of contaminant concentrations at public supply wells? Are there public domain codes available that the panel would recommend using?
• How should ATSDR address the issue of lack of observed water-level data before 1974 (study is from 1968–1985)?
• How should ATSDR address the issue of lack of monthly groundwater-production data when monthly data are required for the epidemiologic study?
• Is it sufficient to use an annual average recharge or infiltration rate and assess climatic conditions (e.g., droughts and higher than normal precipitation) to derive monthly recharge rates? Are other methods or techniques available to derive monthly recharge data?
Water-Distribution Systems
• Are the distribution-system tests conducted to date and the one planned for summer 2005 sufficient to provide ATSDR with required data for reliable calibration of present-day models?
• Considering the lack of household consumption data and diurnal curve characteristics, will applying the “district metering area (DMA)” approach using the 16 system flowmeters (recently installed) provide adequate and sufficient information to develop per capita consumption data and diurnal curve characteristics? Are panel members aware of other approaches that could be useful?
• Is ATSDR’s approach of developing three water-distribution system models (Tarawa Terrace, Holcomb Boulevard, and Hadnot Point areas) appropriate to address answers needed for the epidemiologic study?
• Based on information provided to ATSDR by the U.S. Marine Corps, pipelines connecting the Hadnot Point water-treatment plant service area with the Holcomb Boulevard water-treatment plant service area were opened for emergency purposes only. Does the panel agree with the ATSDR approach that because of this characteristic, these two areas can be and should be modeled as two separate water-distribution systems?
• Should ATSDR consider using probabilistic analyses to assess the variability and uncertainty of: (1) water-distribution system model parameters, (2) nodal demands, and (3) system operations? If so, what specific methodologies would the panel suggest or recommend?
• An innovative approach for fire-flow testing (for model calibration) was employed at Camp Lejeune using continuous recording-pressure monitors simultaneously at several fire hydrants while different combinations of hydrants were flowed. Is this approach technically sound and beneficial?
• Is it feasible or necessary for ATSDR to simulate the complete 18-year historical period on a continuous basis? Will monthly simulations be adequate?
Appendix B—List of Panel Members, Presenters, and Observers
Panel Members
Barry L. Johnson, PhD, FCR Panel Chair, Assistant Surgeon General (ret.) Adjunct Professor, Rollins School of Public Health, Emory University; Editor, Journal of Human and Ecological Risk Assessment Atlanta, Georgia
Robert M. Clark, PhD, PE, DEE Environmental Engineering & Public Health Consultant Cincinnati, Ohio
David E. Dougherty, PhD Principal, Subterranean Research, Inc. Duxbury, Massachusetts
Benjamin L. Harding, PE Principal Engineer, Hydrosphere Resource Consultants, Inc. Boulder, Colorado
Leonard F. Konikow, PhD, PG Research Hydrologist, U.S. Geological Survey Reston, Virginia
Eric M. LaBolle, PhD Scientist, University of California, Davis, California
Peter Pommerenk, PhD, PE Project Manager, AH Environmental Consultants, Inc. Newport News, Virginia
Vijay P. Singh, PhD, DSc, PE A.K. Barton Professor, Department of Civil and Environmental Engineering, Louisiana State University Baton Rouge, Louisiana
James G. Uber, PhD Associate Professor, Department of Civil and Environmental Engineering, University of Cincinnati, Ohio
Thomas M. Walski, PhD, PE, DEE Vice President, Engineering Bentley Systems Nanticoke, Pennsylvania
List of Presenters and Project Team Attendees
Mustafa Aral, PhD, PE
Georgia Institute of Technology
404-894-2243
maral@ce.gatech.edu
Frank Bove, DSc
Agency for Toxic Substances and Disease Registry (ATSDR)
404-498-0557
fjb0@cdc.gov
Robert Faye, MSCE, PE
Robert E. Faye & Associates, Inc.
706-219-1738
refaye@alltel.net
Joseph Green, MA
Oak Ridge Institute for Science & Education
404-498-0413
dgq1@cdc.gov
Morris Maslia, MSCE, PE, DEE
ATSDR
404-639-0674
mgm4@cdc.gov
Shannon Rossiter, MPH
ATSDR
404-498-0556
snr3@cdc.gov
Perri Ruckart, MPH
ATSDR
404-498-0573
afp4@cdc.gov
Jason Sautner, MSCE
ATSDR
404-639-0674
zlc9@cdc.gov
Claudia Valenzuela, MS, Env. Eng.
Oak Ridge Institute for Science & Education
404-498-0415
cdv7@cdc.gov
List of Observers
Barbara Anderson
ATSDR
404-498-0465
bha6@cdc.gov
Brynn Ashton
U.S. Marine Corps Base Camp Lejeune
ashtonbt@lejeune.usmc.mil
Gary Campbell
ATSDR
404-498-0384
ghc1@cdc.gov
William Cibulas
ATSDR
404-498-0007
wic1@cdc.gov
Jerry Ensminger
Public Member
jmensminger@hotmail.com
Mark Evans
ATSDR
404-498-0363
mxe7@cdc.gov
Linnet Griffiths
ATSDR
404-498-0661
lig5@cdc.gov
Joel Hartsoe
U.S. Marine Corps Base Camp Lejeune
hartosejr@lejeune.usmc.mil
Carole Hossom
ATSDR
404-498-0372
cjd0@cdc.gov
Chris Mazzolini
The Daily News
Jacksonville, North Carolina
Cmazzolini@freedomenc.com
Susan Moore
ATSDR
404-498-0505
sym8@cdc.gov
John Oh
U.S. General Accountability Office
ohj@gao.gov
Danielle Organek
U.S. General Accountability Office
organekd@gao.gov
Ken Orloff
ATSDR
404-498-0506
keo1@cdc.gov
Alex Spiliotopoulos
S.S. Papadopoulos & Associates, Inc.
alex@sspa.com
Steven Whited
U.S. Marine Corps Base Camp Lejeune
whitedsu@lejeune.usmc.mil
Scott Williams
U.S. Marine Corps Base Camp Lejeune
williamssr@lejeune.usmc.mil
Sharon Williams-Fleetwood
ATSDR
404-498-0007
sow1@cdc.gov
David Williamson
ATSDR
770-488-1054
dxw2@cdc.gov
Appendix C—Curriculum Vitae for Panel Members
Robert M. Clark, PhD, PE, DEE
Education
1960 BS, Civil Engineering and Mathematics, Oregon State University
1961 BS, Mathematics, Portland State University, Oregon
1964 MS, Mathematics, Xavier University, Cincinnati, Ohio
1968 MS, Civil Engineering, Cornell University, New York
1976 PhD, Environmental Engineering, University of Cincinnati, Ohio
Work Experience
Dr. Clark is a registered engineer and worked as an environmental engineer at the U.S. Public Health Service and the U.S. Environmental Protection Agency (EPA) since 1961. He was director of the EPA Water Supply and Water Resources Division from 1985–1999. In 1999, he was appointed to a senior expert position at the EPA. After September 2001, Dr. Clark was appointed senior scientist to the EPA Water Protection Task Force, where he served until he retired in August 2002. He has made major contributions to the field of public health and has been professionally active at the national and international level. He has served as a member of a number of internationally recognized organizations and held national level offices for the American Society of Civil Engineers (ASCE) and the American Water Works Association (AWWA). Dr. Clark is an active researcher, having authored or coauthored more than 350 papers and publications and five books; he is now an independent consultant.
Current Work
Dr. Clark is currently working on projects relating to homeland security. He is a consultant to Shaw Environmental and Infrastructure under a contract with the EPA. He is responsible for developing methodology for calibrating water-quality models in drinking-water distribution systems and for research on the effects of hydrodynamics on the transport and deposition of contaminants in networks. Dr. Clark is also a consultant to the University of Cincinnati under a contract with Sandia National Laboratories, which is currently reworking its risk assessment methodology for water-system vulnerability. He has worked with Rutgers University’s Center for Information Management, Integration and Connectivity to assist in the development of an early warning system for drinking-water utilities. In addition to his work in homeland security, he has worked with the U.S. Department of State to develop criteria for drinking-water treatment in U.S. embassies. He is working with AH Environmental Consultants, Inc., on a project with the U.S. Marine Corps to study volatile organic compound exposure at Camp LeJeune, North Carolina.
Professional Societies and Honors
Dr. Clark is a national and international expert in the field of environmental engineering. He has received numerous awards including:
• ASCE, Lifetime Achievement Award (2004). Environmental and Water Resources Institute. In recognition of a life-long and eminent contribution to the environmental and water-resources engineering disciplines through practice, research, and public service.
• EPA, Distinguished Service Career Achievement Award (2002). For leadership as a researcher and manager in protecting the Nation’s public health through his research in drinking water.
• EPA, Diversity Leadership Award (1998). Office of Research and Development. For enhancing the careers of ORD staff.
• ASCE, Rudolph Hering Medal (1996). For the best paper published by the Environmental Engineering Division.
• EPA, Gold Medal (1993). For work during the 1993 Cryptosporidia outbreak in Milwaukee, Wisconsin.
• AWWA, A.P. Black Award (1993). For outstanding achievements in water-supply research.
• AWWA Publication Award (1990).
• ASCE, Outstanding Research Paper (1987). From Water Resources Planning and Management Division.
• U.S. Public Health Service Meritorious Service Award (1983).
• Walter L. Huber Civil Engineering Research Prize (1980).
David E. Dougherty, PhD
Education
1975 BS, Engineering, Swarthmore College
1976 MSCE, Civil Engineering, Tufts University
1983 MA, Civil Engineering, Princeton University
1985 PhD, Civil Engineering, Princeton University, Water Resources Program
Work Experience
1994–present Principal and Cofounder, Subterranean Research, Inc.
2001–2004 Research Associate Professor, Department of Civil and Environmental Engineering, University of Vermont
1994–2001 Associate Professor, Department of Civil and Environmental Engineering (secondary appointment in Computer Science), University of Vermont
1990–1994 Assistant Professor, Department of Civil and Environmental Engineering, University of Vermont
1991–1994 Engineer and Participating Guest, Lawrence Livermore National Laboratory
1986–1990 Assistant Professor, Department of Civil and Environmental Engineering, University of California, Irvine
1981–1982 Engineer, GeoTrans, Dames & Moore
1976–1979 Engineer, Moretrench American and Ground/Water Technology
Selected Professional Activities
Committee Participation
• American Society of Civil Engineers (ACSE) Long Term Monitoring Optimization Task Committee (2000–present, Chair 2004–present)
• American Geophysical Union (AGU) Groundwater Technical Committee (1994–present, Chair during 1998–2000)
• ASCE Task Committee on Computational Issues for Groundwater Remediation Optimization (1994–1996)
• High Performance Computing Research Centers External Advisory Committee, Los Alamos National Laboratory and Oak Ridge National Laboratory (1992–1997)
• ASCE Groundwater Committee, Water Resources Planning and Management Section (2003–present)
• Vermont–EPSCoR, Management Committee (1996–1999)
Panel Member/Program Reviewer
• Optimization of Long Term Monitoring at Hanford Site, U.S. Department of Energy Office of Cleanup and Acceleration (2004)
• MODFLOW 2000, U.S. Geological Survey (1999–2000)
• Hydraulic Optimization Demonstration Project, U.S. Environmental Protection Agency (EPA) Technology Innovation Office (1998–1999)
• Environmental Management Science Program, U.S. Department of Energy (1999)
• Hazardous Waste Research Centers Program, EPA (1998)
• Strategic Environmental Research and Development Program, U.S. Department of Defense (1998)
Selected Publications
Dougherty, D.E., and Marryott, R.A., 1991, Optimal groundwater management: 1. Simulated annealing: Water Resources Research, v. 27, no. 10, p. 2493-2508.
Dougherty, D.E., and others, 2002, Optimization and modeling for remediation and monitoring, Chapter 3, in Chien, C.C., and others, eds., Environmental Modeling and Management: Theory, Practice, and Future Directions: Today Media, Inc.
Dougherty, D.E., and Wilson, D.A., 2003, Using on-going monitoring data and site models to evaluate performance of remediation systems: Proceedings MODFLOW and More 2003: Understanding through modeling: Golden, Colorado, International Ground Water Modeling Center.
Dougherty, D.E., and Young, S., 2003, Hydrologic data assimilation applied to groundwater plume monitoring planning: Proceedings MODFLOW and More 2003: Understanding through modeling, International Ground Water Modeling Center.
Eppstein, M.J., and Dougherty, D.E., 1996, Simultaneous estimation of transmissivity values and zonation: Water Resources Research, v. 32, no. 11, p. 3321-3336.
Eppstein, M.J., Dougherty, D.E., Troy, T.L., and Sevick-Muraca, E.M., 1999, Biomedical optical tomography using dynamic parameterization and Bayesian conditioning on photon migration measurements: Applied Optics, v. 38, p. 2138-2150.
Kosegi, J.M., Minsker, BS, and Dougherty, D.E., 2000, A feasibility study of thermal in situ bioremediation of dense nonaqueous phase liquids: Journal of Environmental Engineering, v. 126, no. 7, p. 601.
Rizzo, D.M., and Dougherty, D.M., 1994, Characterization of aquifer properties using artificial neural networks, Neural kriging: Water Resources Research, v. 30, no. 20, p. 483-497.
Rizzo, D.M., and Dougherty, D.M., 1996, Design optimization for multiple management period groundwater remediation: Water Resources Research, v., 32, no. 8, p. 2549-2561.
Rizzo, D.M., and Dougherty, D.M., 2000, Artificial neural networks in subsurface characterization, in Govindaraju, R.S., and Rao, A.R., eds., Artificial Neural Networks in Hydrology: Kluwer.
Rizzo, D.M., and Dougherty, D.M., and Yu, M., 2000, An Adaptive Long-Term Monitoring and Operations System (aLTMOs™) for optimization in environmental management: ASCE 2000 Joint Conference on Water Resources Engineering and Water Resources Planning and Management, Minneapolis, Minnesota.
Task Committee on the State of the Art in Long-Term Groundwater Monitoring Design of the Environmental and Water Resources Institute, 2003, Long-term groundwater monitoring: The State of the Art: American Society of Civil Engineers, 103 p.
Xue, G., Lillys, T.P., and Dougherty, D.E., 2000, Computing the minimum cost pipe network interconnecting one sink and many sources: SIAM J. Optimization, v. 10, no. 1, p. 22.
Yu, M., and Dougherty, D.E., 2000, Modified total variation method for 3-D electrical resistance tomography inverse problems: Water Resources Research, v. 36, no. 7, p. 1653.
Benjamin L. Harding, PE
Education
1971 BS, Civil Engineering, University of Colorado
Memberships and Registrations
• Registered Professional Engineer, State of Colorado, 1979
• Member, American Society of Civil Engineers
• University of Colorado, Department of Civil, Environmental and Architectural Engineering, Professional Advisory Board Member, 1995–2003; Chair, 2000–2002
Work Experience
Mr. Harding has more than 35 years of diverse experience in water-resources engineering. For more than 20 years he has focused his practice on the design, development, and use of hydrologic and river/reservoir system models, decision support systems, hydraulic models, water-quality models, GIS, and databases. This experience includes over 20 years of project management, successfully directing engineers, scientists, and programmers in these areas.
Mr. Harding is fluent or has a working knowledge of several computer languages and has experience with the management of software and database development projects.
Mr. Harding’s work has been reported in papers published in Water Resources Research, Water Resources Bulletin and Industrial Wastes.
Project Experience
Colorado River Water Availability. Project manager and lead engineer for development of probabilistic estimates of water availability on the Colorado River under different assumptions regarding operating rules and legal interpretations of compacts.
Water Acquisition Study. Project manager and lead engineer for evaluation of water acquisition as a means of maintaining habitat for endangered fish in a water-short river system. This analysis involves both engineering and institutional factors.
Central Oahu Water-Distribution System. In support of litigation, project manager, and chief engineer for analysis of the fate and transport of pesticides in the water-distribution system of Honolulu, Hawaii. Performed and directed water-distribution fate and transport modeling. Developed and utilized Monte Carlo risk-assessment methods to quantify human intakes of pesticides and associated risk of cancer. Directed the development of GIS databases used for analysis of water demand, development of water-distribution models, and geocoding of exposure locations. Provided expert testimony in deposition and at trial in Federal court. Trial is ongoing.
Snowmaking Water Quality Studies. Project engineer for design of a field sampling program for hydrology and water quality of meltwater from artificial snow, and associated model studies.
Redlands Toxic Chemical Exposure Analysis. In support of litigation, project manager and chief engineer for analysis of the fate and transport of toxic chemicals in the water-distribution system of Redlands, California. Performed and directed water-distribution fate and transport modeling to reconstruct historical conditions at different spatial and temporal scales. Developed and utilized Monte Carlo risk assessment methods to quantify human intakes of contaminants and associated risk of cancer. Provided expert testimony at deposition. Case is ongoing.
Burbank TCE Exposure Analysis. In support of litigation, project manager and chief engineer for analysis of the fate and transport of TCE in the water-distribution system of Burbank, California. Performed and directed water-distribution fate and transport modeling to reconstruct historical conditions at different spatial and temporal scales. Provided expert testimony at deposition. Case was settled.
Phoenix TCE Exposure Analysis. In support of litigation, project manager and chief engineer for analysis of the fate and transport of TCE in the water-distribution systems of Scottsdale and Phoenix, Arizona. More than 10 hydraulic and water-quality models of both systems were constructed and calibrated. These models were run over a study period spanning 20 years or more. Mr. Harding managed and conducted the development of a comprehensive historical spatial database of parcel and land use data, beginning with current land use data and developing historical data from aerial photographs and other sources. These databases were used to estimate historical water use, to develop water-distribution models, and to geocode exposure locations. Provided expert testimony at deposition and at trial in state court. Case resolved at trial.
Selected Publications
Grayman W., Clark R.M., Harding B.L., Maslia, M., and Aramini, J., 2004, Reconstructing Historical Contamination Events, in Mays, L., ed., Water Supply Systems Security: McGraw-Hill.
Harding, B.L., 1999, Evaluation of Historical Concentrations of Dissolved Contaminants in the Burbank Water Distribution System: February 15, 1999.
Harding, B.L., 1999, Evaluation of Historical Concentrations of Dissolved Contaminants in the Burbank Water Distribution System: Supplemental Report, May 7, 1999.
Harding, B.L., and Grayman, W., 2002, Historical Reconstruction of Contamination in a Distribution System Incorporating Uncertainty: Proceedings of the 12th Conference of the International Society of Exposure Analysis (ISEA) and 14th Conference of the International Society for Environmental Epidemiology (ISEE), August, 2002, Vancouver, British Columbia, Canada.
Harding, B.L., and Grayman, W., 2003, Movement of Contaminants in the Central Oahu Distribution System.
Harding, B.L., and T.M. Walski, 1999, Long Time-Series Simulation of Water Quality in Distribution Systems: Proceedings of the 26th Annual Water Resources Planning and Management Conference, ASCE.
Harding, B.L., and T.M. Walski, 2000, Long Time-Series Simulation of Water Quality in Distribution Systems: ASCE, Journal of Water Resources Planning and Management, v. 126, no. 4.
Walski, T.M., and Harding, B.L., 1997, Historical TCE Concentrations in Drinking Water in the Maryvale Area of West Central Phoenix, Arizona: Lofgren, et al., versus Motorola, et al., Superior Court, Maricopa County, Arizona, July 31, 1997.
Walski, T.M., and Harding, B.L., 1997, Historical TCE Concentrations in Drinking Water in South Scottsdale and Adjacent Areas of Phoenix, Arizona: Lofgren, et al., versus Motorola, et al., Superior Court, Maricopa County, Arizona, January 13, 1997.
Barry L. Johnson, PhD, FCR
Education
1960 BS, Electrical Engineering, University of Kentucky, Lexington
1962 MS, Electrical Engineering (minor in mathematics), Iowa State University, Ames
1967 PhD, Electrical Engineering (minors in biomedical engineering, applied mathematics, and physiology), Iowa State University, Ames
Work Experience
1986–1999 Assistant Administrator, Agency for Toxic Substances and Disease Registry
1999 Adjunct Professor, Rollins School of Public Health, Emory University
1972–1986 Director, Division of Biomedical and Behavioral Science, National Institute for Occupational Safety and Health
1970–1972 Research Scientist, U.S. Environmental Protection Agency
1962–1970 Electrical Engineer, neurotoxicologist, U.S. Public Health Service
Professional Societies
• Environment and Health Committee, Physicians for Social Responsibility
• National Academy of Sciences’ Board on Environmental Studies and Toxicology
Editorial Boards
• Journal of Industrial Health and Toxicology, 1983–1999
• Archives of Environmental Health, 1980–1994
• NeuroToxicology, 1978–1993
• Risk Analysis, 1987
• Clean Technology and Environmental Sciences, 1990–present
• Contaminated Soils, 1991–present
• International Journal of Occupational and Environmental Medicine, 1994–present
• Editor-in-Chief, Journal of Human and Ecological Risk Assessment, 1999–present
Publications
Johnson, B.L., 1987, The Prevention of Neurotoxic Illnesses in Working Populations: Wiley & Sons, London.
Johnson, B.L., 1990, Advances in Neurobehavioral Methods in Environmental and Occupational Health, Lewis Publishers, Chelsea, Michigan.
Johnson, B.L., 1992, National Minority Health Conference: Focus on Environmental Contamination, Princeton Scientific Publishers, Princeton, New Jersey.
Johnson, B.L., 1994, Behavioral Toxicology: Department of Health and Welfare, Washington, D.C.
Johnson, B.L., 1994, Hazardous Waste and Public Health, Princeton Scientific Publishing, Princeton, New Jersey.
Johnson, B.L., 1999, Human Health Impact of Hazardous Waste, Lewis Publishers, Boca Raton, Florida.
Johnson, B.L., 2005, Environmental Policy and Public Health Practice (submitted for publication).
Authored numerous peer reviewed papers. A list is available upon request.
Leonard F. Konikow, PhD, PG
Education
1966 BA, Geology, Hofstra University, Hempstead, New York
1969 MS, Geology, Pennsylvania State University
1973 PhD, Geology, Pennsylvania State University
Registration
• Professional Geologist, Pennsylvania (1996–present)
Work Experience
1980–present Project Chief, Water Resources Division, U.S. Geological Survey, Research Project “Digital modeling of transport in saturated zone”
1978–1980 Ground Water Branch, U.S. Geological Survey, Reston, Virginia
1974–1978 Project Chief, Research Project “Solute Transport in Ground Water,” U.S. Geological Survey, Central Region, Lakewood, Colorado
1972–1974 Project Chief, Subsurface Waste Investigations, U.S. Geological Survey, Lakewood, Colorado
1969–1971 Research assistant, Pennsylvania State University
Other Experience
Instructor and lecturer at:
7/66–9/66 Geology Department, Hofstra University, Hempstead, New York
1/69–6/69 Geology Department, Pennsylvania State University
1991 & 1992 Department of Environmental Sciences, University of Virginia; Department of Geological Sciences, Stanford University
Professional Societies
•American Geophysical Union (AGU) (1970–present; elected Fellow, 2001)
• AGU Spring Meeting Program Chairman for Hydrology (1984–1987)
• Groundwater Committee (1977–1986; Chairman, 1980–1982)
• Geological Society of America (1974–present; Fellow since 1990)
• Management Board, Hydrogeology Division, Geological Society of America (GSA) (1991–1995)
• Chairman, Hydrogeology Division, GSA (1993–1994)
• International Association of Hydrogeologists (IAH) (1985–present)
• Chairman, U.S. National Chapter, IAH (2001–2004)
• U.S. Executive Committee and Liaison with AGU (1986–1990)
• Association of Ground Water Scientists and Engineers (AGWSE) (Technical Division of National Ground Water Association) (1990–present)
• AGWSE—Board of Directors (1996–2000)
• American Institute of Hydrology (Certified as Professional Hydrogeologist) (1991–present)
• California Groundwater Resources Association (2002–present)
Honors and Awards
• Birdsall Distinguished Lecturer (1985–86), GSA, Hydrogeology Division
• M. King Hubbert Science Award (1989), National Ground Water Association
• O.E. Meinzer Award (1997), GSA, Hydrogeology Division
• C.V. Theis Award (1998), American Institute of Hydrology
• Distinguished Service Award (1999), U.S. Department of Interior
• Award for Distinguished Service (2000), GSA, Hydrogeology Division
• Elected as Fellow (2001), AGU
• President’s Award (2001), IAH
Selected Professional Activities
• Rocky Mountain Arsenal (Colorado) Technical Review Committee (1975–77)
• Associate Editor, Water Resources Research (1981–1984)
• National Research Council, Panel on Groundwater Contamination (1981–1982)
• National Research Council, Water Science & Technology Board, Committee on Ground-Water Modeling Assessment (1987–1989)
• National Research Council, Waste Isolation Plot Plant Committee (1989–1997)
• Peer Review Panel, U.S. Environmental Protection Agency, Environmental Monitoring Systems Lab, Las Vegas, Nevada (1991)
• National Science Foundation, Review Panel for Hydrologic Sciences and interim staff assistant (1992)
• Member of Modeling Project Subcommittee, Science Advisory Board, U.S. Environmental Protection Agency (1993)
• Editorial Board, Ground Water Journal (1993–1995)
• Adviser to U.S. AID project studying seawater intrusion in Gaza and Morocco (1994–1997)
• National Research Council, Hydrogeology/Water Management Peer Review Panel for U.S. AID (2000)
• National Research Council, Committee on Principles and Operational Strategies for Staged Repository Systems (2001–2002)
• Farvolden Distinguished Lecturer, University of Waterloo, Ontario (2002)
Publications
Author or coauthor of numerous articles in peer-reviewed journals, government publications, conference proceedings, book chapters, and talks given at professional society meetings (detailed list available on request).
Eric M. LaBolle, PhD
Education
1999 PhD, Hydrologic Science, University of California, Davis
1993 MS, Civil and Environmental Engineering, University of California, Davis
1987 BS, Environmental Engineering (minor in Water Resources), Humboldt State University, Arcata, California
Registration
• California Engineer-in-Training license
• Occupational, Safety, and Health Administration hazardous-waste site management certificate, 29 CFR 1910.120, not current
Work Experience
1999–present Researcher, Hydrologic Sciences, University of California, Davis
In conjunction with the U.S. Geological Survey (USGS), developing a random walk component for the MODFLOW suite of groundwater flow and transport codes, GWT-2000. Studying the role of heterogeneity in our ability to monitor for natural attenuation. Using high-performance computational clusters to study the role of uncertainty and variability in groundwater and water-distribution system flow and contaminant transport on perchlorate exposure history and associated health risks in Rancho Cordova. Conducted verification of Integrated Groundwater and Surface Water Model. Mentoring and supervision of graduate and postdoctoral students.
1994–present Hydrogeologist, Independent Consultant
Water resources management and planning, groundwater-banking/conjunctive-use, model peer review, environmental simulations, groundwater-flow and contaminant transport, software development, and expert witness/litigation support for environmental contamination cases of the South Lake Tahoe Public Utilities District (methyl-tertiary-butyl ether (MTBE), settled); Citizens for a Better Environment (MTBE, settled); City of Santa Monica (MTBE, settled); City of Dallas versus Explorer Pipeline, et al. (MTBE, settled); City of Dinuba (MTBE, settled); Methanex versus the United States of America (MTBE, in litigation); and City of Modesto (PCE, in litigation). Additional clients include Coachella Valley Water District, Azurix-Madera, and iAqua-Dallas.
1993–1998 Postgraduate Researcher, Hydrologic Sciences, University of California, Davis
Evaluated aquifer remediation strategies for Lawrence Livermore National Laboratory, Livermore, California, using models of flow and transport in high-resolution three-dimensional geostatistical characterizations of the alluvial-fan hydrostratigraphy. Investigated roles of diffusion in subsurface transport and remediation. Developed the theory of diffusion processes in composite media, a generalization of standard diffusion theory. Developed new computational methods and software for simulating transport in porous media.
Research Assistant
1991–1993 Hydrologic Sciences, University of California, Davis
1989–1990 Humboldt State University, Arcata, California
1989–1991 Project Engineer, Winzler & Kelly, Eureka, California
Conducted analyses and provided recommendations for water- and sewer-systems upgrades, allocation of water resources, negotiations for purchase of water, and management of finances related to public utilities. Developed specifications for water-telemetry system. Developed initial design specifications for wastewater-effluent irrigation system. Collaborated in managing construction of three wastewater-treatment systems. Participated in remedial investigations of hazardous-waste sites.
1987–1988 Hydrologist, Golder Associates, Redmond, Washington
Developed and applied stochastic hydrologic software to assess risk to radiation exposure from proposed geologic repositories for high-level radioactive wastes in Deaf Smith County, Texas, and Yucca Mountain, Nevada. Modeled fate and transport of radionuclides in proposed geologic repositories for high-level radioactive wastes. Collaborated in developing and verifying finite-element fracture-flow software. Participated in hydrogeologic characterizations and remedial investigations of hazardous-waste sites.
1994–2003 Guest Lecturer, Hydrologic Sciences, University of California, Davis
Professional Societies and Awards
• Year 2000 Universities Council on Water Resources Award for Outstanding Water Resources
• PhD dissertation in the fields of natural science and engineering
• American Geophysical Union
• National Groundwater Association
• Groundwater Resources Association of California
• International Association of Hydrogeologists
Publications
• Approximately 25 journal articles, special papers/reports, and consulting report
• More than 30 abstracts and conference presentations
• PhD dissertation
• Approximately 10 proposals
Peter Pommerenk, PhD, PE
Education
1989 MS Aerospace Engineering, Universität der Bundeswehr München
1996 MS Environmental Engineering, Old Dominion University
2001 PhD Environmental Engineering, Old Dominion University
Memberships and Registrations
• Member, American Water Works Association
• Registered Professional Engineer, Virginia
Work Experience
2002–present Specializes in water quality and treatment, including process design studies (bench, pilot and full-scale plant studies), optimization of new and existing raw water supply, treatment and water-distribution system facilities for compliance purposes, impact assessment of pollutant discharges on ambient water quality and computer-aided modeling of physicochemical processes and transport in aqueous systems. As a project manager with AH Environmental Consultants, Inc., his projects have included:
Distribution System Hydraulic and Water Quality Modeling for City of Goldsboro, North Carolina; Fort Eustis, Virginia; Fort Story, Virginia, and Naval Service Warfare Center, Carderock Division, Maryland.
2002–2004 Served as project manager for completion of distribution system hydraulic and water-quality models. Tasks performed include: Development of water-quality sampling and hydraulic monitoring plans, model calibration, development of scenarios to identify solutions to distribution system water-quality problems.
U.S. Marine Corps Base Camp Lejeune, North Carolina.
• Performed feasibility studies and preliminary design and developed cost estimates for the replacement of five water-treatment facilities with membrane nanofiltration, lime softening, and ion exchange plants.
• Designed and conducted an investigative study to determine the source of trihalomethane precursor material at a well field at the U.S. Marine Corps Air Station New River and developed well utilization schedules to minimize disinfection byproduct formation.
• Developed and conducted a study to evaluate the effect of pH adjustment and corrosion inhibitor addition on the leaching of lead from brass faucets. This work included bench-scale tests and chemical equilibrium modeling of the effects of process chemistry on the solubility of lead phosphate and carbonate minerals.
• Developed and completed study to minimize disinfection byproduct formation in the consecutive water system at the Rifle Range.
• Developed raw-water master plan for 80 groundwater wells at the base.
• Provided technical support to the base for the epidemiological study being conducted by the Agency for Toxic Substances and Disease Registry.
U.S. Army Corps of Engineers, Washington Aqueduct Division. Developed and conducted a full-scale study to determine the effect of backwash water recycling on granular media filtration efficiency.
City of Virginia Beach, Virginia. As project manager developed long-term plan for alternative water supply, including conceptual design and cost estimation for seawater desalination and surface-water treatment.
U.S. Army Corps of Engineers, Washington Aqueduct Division. Evaluated alternative filter aids for the McMillan plant in a pilot- and full-scale study to minimize the adverse impacts of algae blooms in uncovered reservoirs on filtered water-effluent turbidity and particle-size distribution.
Naval Facilities Engineering Command, Atlantic Division. Performed sanitary surveys for overseas water-treatment facilities at the Naval Station Roosevelt Roads, Puerto Rico; the Naval Station Rota, Spain; the Naval Station Guantanamo Bay, Cuba; the Naval Support Activity Bahrain; and the Naval Support Activity Souda Bay, Greece.
Army National Guard, Camp Atterbury, Indiana. Evaluated the influence of water-softening strategies on the leaching of lead from brass faucets. This work included bench-scale tests and chemical equilibrium modeling of the effects of process chemistry on the solubility of lead.
City of Goldsboro, North Carolina. Responsible for providing technical support to the city on numerous projects including evaluation of alternatives to upgrade or replace the existing Neuse River intake; safe yield analysis of the Neuse River; and evaluation of trihalomethane control alternatives, tracer studies, and computational fluid dynamics analysis of the clearwell.
Recent Publications and Presentations
Pommerenk, P., Hiltebrand, D.J., Theiss, R.J., and Brashear, K., 2001, Use of CFD modeling and tracer studies to select the point of ammonia addition for chloramines, in Proceedings 2001 Water Quality Technology Conference: Nashville, Tennessee, American Water Works Association.
Pommerenk, P., and Schafran, G.C., 2002, Effects of prefluoridation on removal of particles and organic matter: Journal of the American Water Works Association, v. 94, no. 2, p. 99–108.
Vijay P. Singh, PhD, DSc, PE
Education
1967 BS, Engineering, U.P. Agriculture, University, India
1970 MS, Engineering, University of Guelph, Canada
1974 PhD, Civil Engineering, Colorado State University, Ft. Collins
1998 DSc, Engineering, University of the Witwatersrand, Johannesburg, South Africa
Professional Registration
• PE (Louisiana) since 1973
• PH (American Institute of Hydrology) since 1984
Work Experience
1999–present Employment: Arthur K. Barton Endowed Professor
1981–1999 Professor of Civil Engineering and Coordinator of Water Resources Program
1983–1985 Director (Acting), Louisiana Water Resources Research Institute
l978–1981 Louisiana State University; Associate Professor of Civil Engineering, Mississippi State University
1977–1978 Associate Research Professor of Civil Engineering, George Washington University
1974–1977 Assistant Professor of Hydrology, New Mexico Institute of Mining and Technology
Other Experience
Visiting Professor
• Department of Environmental Engineering and Physics, Univ. of Basilicata, Italy (1990, 1997)
• Department of Water Resources Engineering, Lund University, Sweden (1994)
• Swiss Federal Institute of Technology, Switzerland (1990, 1992, 1994, 1995, 1997)
• Vrije Universiteit Brussels, Belgium (1988)
• Water Resources Development Training Centre, University of Roorkee, India (1997)
• University of Technology, Graz, Austria (1998)
• University of Technology, Vienna, Austria (1998)
• U.S. Department of Interior, Denver, Colorado (1999)
• Nanyang Technological University, Singapore (2001)
• Senior Research Engineer, U.S. Army Engineer Waterways Experiment Station, Vicksburg, Mississippi (1982, 1984, 1985, 1986, 1995)
Consultant to local, state, national, and international organizations on 21 projects
Honors, Awards, and Recognition
• Earned 35 awards, including 2 best paper, 10 books, 3 service, 3 scholarship, teacher of the year, researcher of the year; outstanding service award from Italian CNR-IRPI, Fulbright Scholar Award, International Man of the Year Award, 20th Century Award for Achievement, DSc Degree, Research Fellow Award, Distinguished Faculty Award, The Brij Mohan Distinguished Professor Award, Achievement in Academia Award, and James M. Todd Technological Medal, 2001 Honor Alumnus Award, Certificate of Appreciation for Dedicated Service, and Arid Lands Hydraulic Engineering Award; 9 honors, including 6 fellowships in ASCE, AWRA, I.E., IWRS, IAH and ISAE, one I.H.D. endowment lecture award, and U.S.-India exchange scientist award; and included in 14 WHO’s WHO.
Professional Academies and Societies
• Academician, Georgia Fazisi Academy, Republic of Georgia
• Fellow
Amer. Inst. of Hydrology, Senior Vice Pres.1999–2000; Pres., Louisiana Chap. 1987–94
American Water Resources Association (AWRA)
American Society of Civil Engineers (ASCE)
Indian Association of Hydrologists (IAH), Vice President, 1995–present
Institution of Engineers (IE) (India)
Indian Society of Agricultural Engineers (ISAE)
Indian Water Resources Society (IWRS)
• Member
American Geophysical Union
International Association for Hydraulic Research
International Association of Hydrological Sciences
U.S. Committee of the International Commission on Irrigation and Drainage
Indian Association of Soil and Water Conservationists
British Hydrological Society
Georgia Academy of Sciences, Republic of Georgia
Hazard Forum
Russian Academy of Water Management Sciences, Russian Federation
Sigma Xi
• Served on two national panels and member of 28 professional society committees
The University of Guelph Alumni Association
Colorado State University Alumni Association
Other Experience
Member of editorial boards of 14 journals including: Stochastic Hydrology and Hydraulics (1987–present), Water Resources Management (1986–present), Irrigation Science (1988–present), Agricultural Water Management (1988–present), Hydrology (1980–present), Natural Hazards (1987–1991), Hydroelectric Energy (1986–1992), Hydrological Processes (1994–present), Journal of Hydrologic Engineering, ASCE (1995–present), Environmental Fluid Mechanics (2000–present), International Journal of Sedimentation Research (2001–present), Acta Geophysica Polenica (2001–present), New Global Development: International Journal of Comparative Social Welfare (2001–present), and Water Engineering and Research (2000–present).
Editor-in-Chief, Water Science and Technology Library Book Series, Kluwer Academic Publishers (1991–present); Member of Editorial Board (1988–1991), Kluwer Academic Publishers; Member, National Board of Advisors (1982–present).
Guest editor of special issues of Stochastic Hydrology and Hydraulics on Risk and Reliability Analyses (v. 4, 1990; v. 5, 1991); special issue of Irrigation Science on Advances in Surface Irrigation (1993); two special issues of Hydrology Journal of Indian Association of Hydrologists on Hydrology and Water Resources (v. XVII, no. 1 & 2, 1994).
External examiner of 20 PhD dissertations abroad. Referee for proposals submitted to National Science Foundation, Canada’s NRCSE, and Australia’s ARC; referees articles submitted to 30 journals and technical contributions of U.S. Department of Agriculture and U.S. Geological Survey. Participated in 24 keynote speeches; lecturer at 19 courses; 200 invited talks/seminars organized 12 international conferences; chaired sessions at 28 international conferences; and assisted in organization of 23 international conferences.
Publications
Authored 11 books, 48 book chapters, 5 book reviews, 318 journal articles, 180 conference papers, and 70 technical reports. Edited 33 books.
James G. Uber, PhD
Education
1983 BS, Civil Engineering, Bradley University, Peoria, Illinois
1985 MS, Environmental Engineering, University of Illinois at Urbana-Champaign
1988 PhD, Environmental Engineering, University of Illinois at Urbana-Champaign
Work Experience
1997–present Associate Professor; University of Cincinnati, Department of Civil and Environmental Engineering
1990–1997 Assistant Professor; University of Cincinnati, Department of Civil and Environmental Engineering
1988–1990 Assistant Professor; University of Alabama-Huntsville, Department of Mechanical Engineering
Advised/sponsored 19 graduate students and 3 postdoctoral candidates
Professional Research Activities
Annual Symposium on Water-Distribution Systems Analysis. Initiated by Uber in 1999 and organized annually, this symposium attracts 40–60 papers per year from a broad international audience, and is the primary North American outlet for theoretical developments and applications of systems analysis to water-distribution systems.
Interdisciplinary Research to Broaden Understanding About Drinking Water Quality. Collaborative work with epidemiologists and water-quality scientists (C. Moe and P. Tolbert, Emory University; J. Eisenberg, University of California, Berkeley; D. Moll, Center for Disease Control) is estimating the microbial and chemical health risks associated with drinking water, especially the contribution of water-distribution systems. Collaborative work with electrical and controls engineers (M. Polycarpou, University of Cyprus; M. Bryds, University of Birmingham, United Kingdom) initiated the first work on automatic feedback control of water quality in spatially distributed distribution systems.
Computational Tools for Analysis and Improvement of Water Quality in Distribution Systems. Development and application of the first general simulation tool to integrate multi-species water-quality dynamics with water-distribution system hydraulic models. Participated in initial water-security research to design and analyze monitoring and surveillance systems to mitigate the risks associated with intentional contamination of drinking water. Developed first framework to quantify microbial health risk associated with pathogen intrusion in drinking-water distribution systems, by linking disinfectant residual and pathogen inactivation kinetics with network hydraulic models and Monte-Carlo sampling.
Field-Methods for Measurement of Water Quality in Distribution Systems. Designed and conducted improved field-scale tracer tests using continuous monitoring to assess and improve the accuracy of water-distribution system water-quality models.
Collaborated with numerous researchers from Sandia National Lab, Center for Disease Control, and several universities.
Publications
Boccelli, D.L., Shang, F., Uber, J.G., Orcevic, A., Moll, D., Hooper, S., Maslia, M., Sautner, J., Blount, B., and Cardinali, F., 2004, Tracer tests for network model calibration, in Proceedings, ASCE/EWRI World Water and Environmental Resources Congress, Salt Lake City, Utah.
Boccelli, D.L., Tryby, M., Uber, J.G., Rossman, L.A., Zierolf, M.L., and Polycarpou, M.M., 1998, Optimal scheduling of booster disinfection in water distribution systems: ASCE Journal of Water Resources Planning and Management, v. 124, no. 2, p. 99–110.
Bush, C., and Uber, J., 1998, Sampling design methods for water distribution model calibration, ASCE Journal of Water Resources Planning and Management, v. 124, no. 6, p. 334–344.
Murray, R., Janke, R., and Uber, J., 2004, The threat ensemble vulnerability assessment (teva) program for drinking water distribution system security, in Proceedings, ASCE/EWRI World Water and Environmental Resources Congress, Salt Lake City, Utah.
Polycarpou, M.M., Uber, J.G., Wang, Z., Shang, F., and Brdys, M., 2002, Feedback control of water quality: IEEE Control Systems Magazine, v. 22, no. 3, p. 68–87.
Propato, M., and Uber., J.G., 2004, A linear least squares formulation for operation of booster disinfection systems: ASCE Journal of Water Resources Planning Management, v. 130, no. 1.
Propato, M., and Uber, J.G., 2004, Vulnerability of water distribution systems to pathogen intrusion: How effective is a disinfectant residual?: Environmental Science and Technology, v. 38, no. 13, p. 3713–3723.
Shang, F., Uber, J.G., and Polycarpou, M.M., 2002, A particle backtracking algorithm for water distribution system analysis: ASCE Journal of Environmental Engineering, v. 128, no. 5, p. 441–450.
Uber, J., Janke, R., Murray, R., and Meyer, P., 2004, Greedy heuristic methods for locating water quality sensors in distribution systems, in Proceedings, ASCE/EWRI World Water and Environmental Resources Congress, Salt Lake City, Utah.
Uber, J., Shang, F., and Rossman, L., 2004, Extensions to epanet for fate and transport of multiple interacting chemical or biological components, in Proceedings, ASCE/EWRI World Water and Environmental Resources Congress, Salt Lake City, Utah.
Thomas M. Walski, PhD, PE, DEE
Education
1972 BA, King’s College, Wilkes-Barre, Pennsylvania
1979 MS, PhD, Vanderbilt University, Nashville, Tennessee
Registration
• Professional Engineer, Pennsylvania, Mississippi
• Certified Water and Wastewater Operator, Pennsylvania
Work Experience
2004–present Senior Advisory Product Manager, Bentley Systems, Inc.
2000–2004 Vice President Engineering, Haestad Methods, Inc.
1996–1999 Engineering Manager, Pennsylvania American Water Company
1992–1996 Associate Professor, Environmental Engineering, Wilkes University
1989–1992 Executive Director, Wyoming Valley Sanitary Authority
1987–1989 Operation Manager, Austin, Texas, Water & Wastewater Utility
1975–1987 Environmental Engineer, U.S. Army Corps of Engineers
Other Experience
Served on several committees preparing/editing American Water Works Association (AWWA), American Socity of Civil Engineers (ASCE), and Water Environment Federation publications
Former editor, Journal of Environmental Engineering
Expert Witness, 1995–1997, Lofgren, et al., versus Motorola, et al.
Expert Panel, 1998, Modeling Water Quality in Dover Township, New Jersey Water-Distribution System
Professional Society Memberships
• Has served on numerous professional committees including:
• AWWA, Fire Protection Committee (past chair)
• ASCE
Systems Committee (past chair)
Water Supply (past chair)
Task Committee on Water System Rehabilitation (past chair)
Journal of Environmental Engineering (editor)
• Water Environment Federation
Publications
Authored several books and over 100 journal papers and conference presentations. Authored water-quality modeling publications and presentations, including:
Walaski, T.M., 1991, Understanding Solids Transport in Water Distribution Systems,” in Proceedings Water Quality Modeling in Distribution Systems: Cincinnati, Ohio.
Walaski, T.M., 1999, Modeling TCE Dynamics in Water Distribution Tanks: ASCE Water Resources Planning and Management Conference, Tempe, Arizona.
Walaski, T.M., 2001, Analysis of Water Quality and Pumping Energy in a Small Water System: ASCE Environmental and Water Resources Institute Conference, Orlando, Florida.
Walaski, T.M., 2002, Identifying Monitoring Locations in a Water Distribution System Using Simulation and GIS: American Water Works Association IMTech Conference, Kansas City, Missouri.
Walaski, T.M., and Draus, Steve, undated, Using Pipe Network Models to Help Solve Water Quality Problems in Water Distribution Systems.
Walaski, T.M., and Darus, Steve, 1994, An Evaluation of Water Quality at Fort Monmouth, New Jersey, using the EPANET Model: U.S. Army Corps of Engineers, Waterways Experiment Station, MP EL-95-6.
Walaski, T.M., and Draus, Steve, 1996, Predicting Water Quality Changes During Flushing: American Water Works Association Annual Convention, Toronto.
Walaski, T.M., and Hardin, Ben, 1999, Long Time-Series Simulations of Water Quality in Distribution Systems: ASCE Water Resources Planning and Management Conference, Tempe, Arizona. Also accepted for Journal of Water Resources Planning and Management.
Walaski, T.M., and Lutes, Teresa, 1994, Low Pressure Problems Caused by Hydraulic Transients: Journal of American Water Works Association, v. 86, no. 12, p. 24.
Walaski, T.M., and Male, James, 1990, Troubleshooting Water Distribution System Problems: Lewis Publishers.
Appendix D—Panel Members’ Premeeting Comments
Robert M.Clark, PhD, PE, DEE
Comments
All of the data presented, including water-distribution system, calibration studies, and demand information, is collected for the configuration and operation of the current system. This work is very impressive and uses state-of-the-art technology and techniques. Having conducted a number of modeling and calibration studies I know how difficult it can be and I am impressed with the level of detail supplied.
However, it is my understanding that an attempt will be made to use these data to simulate exposure patterns from water containing volatile organic compounds (VOC) as the system existed in 1968–1985. I didn’t find any references to that effort or any suggestions as to how that will be done in my material. My questions, therefore, are as follows:
1. Is there enough information on potentially exposed population distributions as they existed in the target time period to make an exposure assessment?
2. Does the Marine Corps have as-built drawings and operational information for the target time period comparable to the data contained in the report entitled “Analysis of Groundwater ….?”
3. For the target period, can you show changes in network and system operation that can be matched against exposed populations during that time period?
4. If not, then what kind of assumptions will be required to develop that kind of information?
5. What kind of errors might be inherent in those assumptions?
6. As we know from waterborne disease investigations, for an infection to occur, water must be consumed by the target population at the same time the contaminate is present?
7. Do you have sufficient information on water consumption, and water-use patterns and target population behavior patterns to make an estimate as who was exposed and when? For example, if members of the target population could be assumed to take showers in the morning were VOCs present in the water at a point where contaminated water could have been drawn into the household plumbing system during the showering period?
8. Water use as shown by Steve Buchberger at the University of Cincinnati seems to follow the Poisson Rectangular Pulse pattern. Has any attempt been made to characterize the water use of the target population as a stochastic variable and assess what effect such a characterization would have on the exposure patterns of the affected population?
David E. Dougherty, PhD
Comments
The following comments are preliminary and have not been sorted into any particular structure. They also reflect limitation in the amount of available time to review and prepare comments.
Some abbreviations used below:
ABC— ABC One-Hour Cleaners
PHA— PHA for Marine Camp Lejeune
PHA/ABC— PHA for ABC One-Hour Cleaners
Panel Brief— draft report prepared for this Expert Peer Review Panel
PPT— powerpoint presentation
PCE— tetrachloroethylene
TT— Tarawa Terrace
HP— Hadnot Point
HB— Holcomb Boulevard
T&E— testing and evaluation
This section is organized by transport-and-fate chain of events
Sources of Waste
1. How are the sources going to be represented in the simulation models for water movement and distribution? Have they been characterized with equivalent adequacy for all three areas?
2. The Panel Brief does not adequately discuss the signatures of sources (i.e., source concentration locations and histories) that will used for the TT, HP, and HB areas.
a. TT: The ABC location is described, but there is no indication of how specifically this will specified for simulation purposes or for any uncertainty analyses that may be performed.
b. TT: The PHA/ABC provides some additional information relating to TT. Moreover, the Panel Brief (Groundwater Modeling section, page 20, last paragraph) suggests that PCE concentrations found in 1993 as much as 1,200 ft west of ABC may be suggestive of one or more sources of PCE west of ABC. Additional discussion and data are needed.
c. HP: Other than general discussion of underground tanks, etc., source characterization and modeling information is not provided.
d. HB: Similar to HP.
Groundwater Flow, Transport, and Fate
1. What type of simulation modeling will be performed in addition to saturated groundwater-flow simulation with MODFLOW 2000? Will there be a transport model? Will a MODPATH (or similar) model be used only? Is there any sorption? Other processes in addition to advection? (Panel Brief, Background section, page 1. Also, page 13 of the October 8, 2003, PPT says groundwater-modeling requirements include “calibrated HYDRAULIC model” and the next page says “fate/transport parameter layers” are needed.)
2. One major question the panel is supposed to address is the adequacy of the 50 ft grid. Additional information is needed. Some is related to downstream analyses for dose-duration curves. (For example, what duration of exposure will be examined. The March 18, 2005, supplemental information suggests that a 1-week exposure may be significant.
Some others are appropriate here:
a. Are there distance-drawdown data that have been plotted that show the region of influence of the TT wells in the subunits (as used in this study) of the Castle Hayne aquifer and in the overlying surficial materials?
b. See the next, broader, point.
3. Additional information on aquifer heterogeneity (e.g., spatially variable hydraulic conductivity) is crucial.
a. Drilling logs are needed. Both driller and geologist logs will be useful. The resistivity logs provided in the March 18, 2005, supplemental is inadequate.
b. Cross sections would be very useful. To help focus a response, a “pathline cross section” that passes through source area and is aligned with paths that idealized “particles” would take through the aquifer.
c. Cross sections that show the MODFLOW simulation model grid juxtaposed with the textural information would be quite helpful.
d. The supplemental information provided March 18, 2005, indicates that the preliminary epidemiologic study makes use of PCE contamination at TT. Is there any reason to believe that any in situ processes that caused partial dechlorination (e.g., PCE=>TCE) should be considered or should be ignored?
e. No information on HP and HB groundwater-modeling plans or activities was provided.
4. The northern boundary of the TT groundwater model (Figure 8 of the Groundwater Modeling section of the Panel Brief) appears not to extend sufficiently far north and to be too close to the contaminant source area. Further discussion and justification is requested.
Wells
1. TT: A cross sectional style drawing with the as-built information for each water-supply well that was pumped during the study period would be helpful. Screen and gravel pack location, seal location, grout/backfill location. This should also indicate the model layer boundaries for the stack of cells in which each well is located.
2. TT: A single table/chart is needed that indicates, for every produced well, when installed, when operated, when permanently removed from service, and as much pumping rate versus time information as may be available. Dates of well rehabilitation and measures of well efficiency are also needed.
3. HP and HB: No information was provided, but similar information as above is indicated.
Water-Distribution System
1. Census information would be useful (i.e., number of housing units, number of residents, and number of study residents versus time) for the three water supplies.
2. What is the status of historical water-distribution network definition? Status of historical water-distribution network simulation work?
3. Have field studies to date led to any assessments of uncertainty and variability of key hydraulic properties (e.g., roughness, mixing at junctions)?
4. What kinds of operational record for the groundwater wells exist?
Individuals
1. Is prior housing (during pregnancy) being considered?
2. Did water-use patterns change significantly from 1968 to 1985? Are they significantly different from today’s usage (e.g., cooling and other appliances, conservation measures)?
Exposure
How much uncertainty can be tolerated at this end of the chain of analyses?
Schedule
1. Can you provide additional information on time allotted and time used by each of the scheduled activities? Can you provide percent-complete approximations for each activity?
2. What do you currently extrapolate would be the schedule to perform the groundwater-related activities for HP and HB? To perform the historical network construction, T&E, and simulations?
3. Do you have a PERT network and critical path analysis?
4. Have time estimates for activities proven to be sufficiently accurate? If not, which activities have “exploded” the schedule?
5. Looking forward, where are the greatest potential scheduling pitfalls?
6. Comparing the 3-year proposed schedule and the revised schedule (both appearing in the July 28, 2004, PPT) there appears to have been a revision of 10 months for background information, 6 months for current distribution network, 9 months for historical distribution network, 3 months for methods, and 14 months for reporting. (These overlap and are not cumulative.) Anything new to report?
Questions, Requests, and Comments on Materials Provided (no particular order)
October 8, 2003, PPT
Page 32 refers to “Simulation using BRAGS model data.” Is this significant to our work?
March 18, 2005, Supplemental
Feedback on item #2. Thanks for the electric logs. However, see previous comment about logs and cross sections.
Panel Brief
1. Geohydrologic Framework chapter, page 11. The Geologic Framework section describes the top of the marl (the Local Confining Unit) as the top of the Castle Hayne. However, other information includes the overlying River Bend unit.
2. Geohydrologic Framework chapter, Figure 2: Need to map the hydrogeologic units here to the names used on Figure 6.
3. Geohydrologic Framework chapter, Figure 29: Why closed contours (i.e., circular knoll feature) for high K (horizontal hydraulic conductivity)? Why not more of a linear (ridge) configuration, such as would be indicative of a channel? Same question for Figure 28.
4. Groundwater Contamination chapter, page 8: Although PCE was only purportedly used at ABC, is there evidence of dechlorination that would be significant to this study?
5. Groundwater Contamination chapter, Figure 2: Is it possible to provide water-supply well information for the TT-series of wells? (Posted with well identifier.) Range of dates of service, pumping rate capacity (with date), for example?
6. Groundwater Contamination chapter, Figure 11ff: How were these samples collected and handled before laboratory analysis?
Are all of the protocols consistent? Are there additional observations for dates after July 1, 1991? Since there are no data before early 1980s and study goes back to 1968, we need information from the recent past. For example, TT-26 Figures (#12 for PCE, #14 for TCE, and #15 for DCE) are suggesting dechlorination. Additional data might be used to do breakthrough/travel time estimates using the arrival of clean water (assuming the source has been interrupted).
7. Groundwater Modeling chapter, page 16, top 2 lines: The sentence reads “
[c]
alibration was achieved rapidly with little or no adjustment of hydraulic characteristic arrays or recharge rates” (emphasis added). What was adjusted to accomplish the calibration?
8. Groundwater Modeling chapter, page 16: The static calibration curve (Figure 11) seems pretty good. However the text says “static water levels…were obtained using air line measurements…accurate within an estimated range of ±12 ft.” Is this error independent of water level (i.e., homoscedastic)?
9. Groundwater Modeling chapter, page 16, last paragraph: Text says TT-25 was represented in model layer 7 (MCH), but Table 1 of this chapter indicates TT-25 is representing UCH and MCH. The same paragraph describes TT-23 as in layer 5 representing the UCH, though Table 1 describes it as in UCH and MCH. As indicated in remarks above, under bullet #1 of the WELLS heading, a cross sectional style figure with all the wells, the textural log information, and the local model layer boundaries would be useful.
10. Groundwater Modeling chapter, page 18: lines 3–5: Are there any records indicating that water-supply well maintenance (in particular, redevelopment, acidization, etc.) was performed?
11. Groundwater Modeling chapter, page 18–19: The text discusses the assignment of porosities to various HSUs and/or model layer numbers. Please provide a side-by-side correspondence tableau of HSU names, geologic framework names, and model layer numbers, and give appropriate parameter values for each (e.g., porosity, horizontal hydraulic conductivity, hydraulic conductivity anisotropy ratio).
12. Groundwater Modeling chapter, page 18, last paragraph, continuing on page 19: In discussing the seeding of particles, please indicate the layer in which the particles were placed. Sentence 3 talks about “the immediate vicinity of ABC”, sentence 4 talks about particles “placed in model layer 3,” sentence 5 talks about “particles were then placed at …” without a layer, and so on.
13. Groundwater Modeling chapter, page 19, first paragraph, last sentence: Since the average pore velocity is inversely proportional to porosity, can you explain why cutting porosity in third did not change materially the breakthrough times? Is the majority of the particle travel time in other layers, in which porosity is not changed, so the overall impact of layer 5 porosity is diminished?
14. Groundwater Modeling chapter, page 20, paragraph 2: For particle pushing using the MODFLOW simulation result (“advective transport simulation”), was any sorption incorporated to determine travel times? Linear or other isotherm? For typical values, the introduction of PCE source more than 10 years before the start of the study period and the continuation of the PCE source throughout the study period, and depending on the source release model (undefined, as noted earlier), sorption may be inconsequential for this study.
15. Groundwater Modeling chapter, page 20, paragraph 3: The reported inconsistency of results at TT-23 cannot obviously be concluded to be the result of a source of PCE located much closer to the well, although it could be. Wouldn’t an inverted statement—such as, “the inconsistency leads to the obvious conclusion that the advective transport simulations are incorrect, assuming that the source characterization study previously undertaken for ABC is essentially correct”—have a stronger case in fact? Following this line of thought, in the 15 years since the PHA/ABC, has solid or circumstantial evidence of additional potential sources come to light? In midparagraph is the statement that “PCE concentrations were also noted in samples collected in 1993 at several monitoring wells…located north and west of ABC…The westernmost well location was about 1,200 ft from ABC.” Please give more information (locations, dates, values) relating to these samples.
There may be other alternatives, too. Since the pumping rates assigned to each well are only estimates for the period 1978–1994, according to page 16, and since the contamination was in the groundwater for almost 15 years before the beginning of the study period, isn’t it possible that if a greater proportion of the pre–1978 pumping came from the more southern supply wells then this would cause the plume to have an initial condition that differed substantially from simply the source condition, and this “pre-migrated PCE plume” is the plume that was actually detected?
As previously noted, it seems plausible that the no-flow northern boundary of the groundwater model is located too close to ABC and the TT wells. This could influence the pathlines of particles and their travel times.
In summary, the current form of this discussion leaves too many loose threads.
16. Groundwater Modeling chapter, page 20, paragraph 3, last sentence: The suggestion at the end of the paragraph that “dispersivity is possibly responsible for a substantial transfer of PCE mass from one [well’s capture zone] to [the TT-23 capture zone]” seems implausible. (Note that the process is dispersion, and that dispersivity is a material property.)
17. Groundwater Modeling chapter, Figure 2: Are there any additional pumping wells offsite to the north of TT?
18. Groundwater Modeling chapter, Figure 11: Have the data on Figure 11 been regressed? The plotted data appear to have a slope of about 0.5, rather than the ideal 1.0.
19. Groundwater Modeling chapter, Figure 13: The text relating to this figure says most data plotted here are air line data. Could you indicate which are not?
Benjamin L. Harding, PE
Initial Response to Charge
This is in response to the request by ATSDR that Camp Lejeune Expert Peer Review Panel participants write down their initial response to the charge and questions provided to the panel. The following comments reflect my best understanding at this time. Because I recognize that my understanding is probably incorrect and incomplete, these are provided for discussion purposes only and should not be distributed outside the Panel, ATSDR staff, and consultants.
Situation
1. Residential and working areas at Camp Lejeune, North Carolina, were supplied by three water-distribution systems, designated Holcomb Blvd., Tarawa Terrace, and Hadnot Point. The history of development of the three systems has not been described other than that the Hadnot Point WTP reportedly once served all three systems and that the systems are now separated.
2. The study period for this investigation is from 1968–1985.
3. The groundwater supplies to the Tarawa Terrace and Hadnot Point WTPs were apparently contaminated before 1982. Some contaminated water from the Hadnot Point system was known to have been introduced into the Holcomb Blvd. system for a period of about 2 weeks. It is possible that the Holcomb Blvd. system was interconnected with the Hadnot Point system at other times. It is also possible that the Holcomb Blvd. system was interconnected with the Tarawa Terrace system.
4. The Tarawa Terrace and Hadnot Point WTPs were supplied by well fields. Not all wells in either well field were contaminated to the same levels.
5. Only spotty records of production from the WTPs have been made available to the Panel to date. I do not know the extent of historical production data.
6. No production data for individual wells have been made available to the Panel to date. I do not know the extent of historical production data.
7. Only very limited metering was done on these systems and none was done on residential units.
8. Based on information to date, it appears that these systems operated most of the time as separate systems each, with a single point of supply.
9. The contaminants are VOCs.
10. Some measurements of the contaminants are available, both from the groundwater system and from the water-distribution system.
11. The types of contaminants and level of contamination are such that any disease would arise from chronic rather than acute exposure.
12. ATSDR is undertaking an epidemiologic study of residents and workers on the base.
Outstanding Questions
1. What is known of the history of development of the systems, particularly their interconnection and their sources of supply?
2. Are historical aerial photographs of the base available over the study period?
3. What production data (for individual wells and/or for the WTPs) are available?
4. What were the policies for dispatch of individual wells?
5. What were the seasonal, weekly, and diurnal patterns of water use?
6. What are the precision requirements for the epidemiologic study, in terms of the arrival time of contaminants and the accumulated human intakes of contaminants?
Responses to Issues and Questions
These responses are based on the information I have at this time and are subject to change:
Groundwater
1. No groundwater model is necessary for the Holcomb Blvd. system, since there is no indication that the wells in this system were contaminated. A groundwater model is necessary for the Hadnot Point system, as wells that served that WTP were contaminated.
2. I can’t comment on the advisability of developing single model covering the entire base area.
3. ATSDR should quantify the effect of variability and uncertainty on contaminant concentrations at public water-supply wells.
4. ATSDR should address the issue of lack of observed water-level data before 1974. If nothing else, this will increase the uncertainty of results before this time.
5. ATSDR should attempt to reconstruct monthly groundwater-production data. The uncertainty of these reconstructions should be quantified.
Water-Distribution Systems
1. I think at this time that the ATSDR has collected more than enough information on the current system. Emphasis should be placed on reconstructing historical systems. The most important piece of information to know is the extent to which the systems were interconnected. During periods when the systems were not interconnected and were operated as single-source systems, the modeling can be greatly simplified, e.g., hydraulic modeling may not be necessary.
2. The information to date should provide for adequate calibration of the current system model, with the understanding that the historical systems will be far more poorly understood.
3. ATSDR should consider separating water uses into classes (e.g., indoor residential, outdoor residential, indoor commercial, etc.) and estimating these components separately based on appropriate variables (population, floor area, irrigated area, etc.) and methods. Because these systems are likely single-source systems the distribution of water use will have very little impact on the long-term levels of exposure.
4. For periods when the systems operated separately, and assuming they are indeed single-source systems, no sophisticated models are required. Whether or not models are required for periods of interconnection depends on the extent of interconnection. It may be that no hydraulic model is required at all.
5. If the interconnections to the Holcomb Blvd. system were made only on an emergency basis, and based on my understanding of the role of the suspected contaminants in the causation of disease, I think it is appropriate to treat the Hadnot Point and Holcomb Blvd. systems separately.
6. ATSDR should use probabilistic approaches to quantify estimates of the uncertainty and variability of estimates of exposures, intakes and risks resulting from the modeling. The question of which variables have the greatest influence on the model results depends on the answers to questions about the configuration of the water-distribution systems, and can be informed by sensitivity analyses.
7. The fire flow testing seems sound.
8. Whether or not the use of monthly vignettes for simulation is sufficient depends on the dynamics of the systems.
9. It is feasible for ATSDR to use a continuous analysis, but it is probably not necessary given my feeling that the systems are not very dynamic (except, perhaps, if there were substantial periods of interconnection.)
10. Sophisticated techniques to integrate the groundwater and water-distribution models are not necessary. It is necessary to have one set of well production data that is used by both models. ATSDR should consider using the concept of superposition in the water-distribution system to calculate exposure concentrations based on well-head concentrations developed by the groundwater models.
Responses to Charge
These are my initial impressions and are subject to change:
1. No comment on groundwater modeling. “All pipes” networks should be used if sophisticated hydraulic modeling is required.
2. If the data show the system operation is dynamic, and for periods when there is more than one source, continuous simulation should be considered. It does not appear at this time that this will be necessary.
3. (A) No comment on groundwater. (B) Given the dearth of information about the historical systems, the present-day reconstruction probably does not need additional refinement.
4. I can’t comment on this because I don’t know the complexities of the groundwater modeling. But, it should easily be possible to complete a reconstruction of the water-distribution systems within 3 years unless the process is substantially constrained by the public documentation process.
Leonard F. Konikow, PhD, PG
Comments
These preliminary comments focus on the first five chapters of the draft report for the review panel:
Introduction
Page 1: It says the 1997 PHA determined the drinking-water exposures. So why exactly is this study needed? Was the earlier work flawed or incomplete?
Background
1. Page 1: Five questions are listed as being addressed. None clearly indicate a desire or need to estimate the level of contamination, as opposed to the timing of the contamination. Isn’t there a relation between dose and health effects? This issue relates to the need for a solute-transport model that computes concentrations of contaminants in the supply wells and water-distribution system versus an advection model that estimates travel times.
2. Page 1: Goal 3 is development of fate and transport models. However, an advective transport model is not normally considered to be a “fate and transport” model because it does not consider concentration gradients, dispersion, or reactions.
Geohydrologic Framework
1. Page 9: It says recharge to the water table was simulated at a rate of 11 in/yr. However, the subsequent model description indicates the rate used was about 10% higher than stated here. Does the estimate of recharge include an accounting of leaks, lawn watering, and septic tank discharge that occurs in urban areas and yields effective recharge greater than would occur under natural conditions?
2. Figures: Many of the figures in this and other chapters include contours that don’t look particularly realistic. Also, many of these maps don’t show control points, include a description of how they were derived, or indicate contour intervals.
3. Figure 11: This shows several large areas where the indicated top of the Tarawa Terrace aquifer lies above the elevation of the land surface or above the water surface. This is obviously impossible. If this contour map was used as a basis for computing the thickness of the TT aquifer, then that map also includes serious errors. Have such errors propagated down to other layers? Were these erroneous thickness and elevation maps actually used in the simulation model?
4. This section does not include any cross sections. Such illustrations would help the reader to better understand the geohydrologic framework. This is especially true for assessing hydrologic boundary conditions in the aquifer and flow directions in three dimensions. The same goes for presentation of model results in later chapters.
5. Page 15, Why is a 1-ft-thick clay layer “considered not to be of geohydrologic significance for this study?” If such a layer is present in the area of contamination, it could certainly have a major impact on contaminant transport.
6. If kriging was used to interpolate and contour values, it should also have been capable of estimating confidence intervals. These would certainly be of value and should be presented.
7. Page 20: Why wasn’t a parameter estimation model used to estimate the hydraulic conductivity (K) distribution? What about vertical hydraulic conductivity?
8. Page 20: Clarify why a predevelopment head surface is needed and what will be done with it. It is based on data collected over a broad time span, including some data from the 1960s, 1970s, 1980s, 1990s, and 2000s. How can these observations all be considered to represent predevelopment conditions? Where are the potentiometric surfaces for the time during which development (and contamination) occurred? That seems to be the critical time for contaminant transport. Why isn’t a water-table map shown? Why are heads (in Figure 30) where the aquifer underlies the New River significantly above the water level in the New River?
9. Figures: Why is the northern extent of the contouring where it is—the boundary here seems to lie too close to the area of the contamination source.
Groundwater Contamination
1. Page 7: At what depths were the contaminated supply wells screened? Were they constructed with a gravel pack that extended vertically above or below the screen interval?
2. Page 13: If the center of mass actually migrated at 0.3 ft/d, then we can solve Darcy’s Law for porosity (ε) using the approximate values from the maps for K and hydraulic gradient in this area (about 1 ft per 180 ft, or about 0.0056). This approach results in an estimate of ε = 0.28 (assuming that the retardation factor, Rf, =1.0). This estimate should be compared with the values of 0.15 or 0.20 used in the model, and the inconsistency explained. Were there any tracer tests conducted in the area that can be used to cross check estimates of effective porosity and perhaps dispersivity coefficients? (A recent U.S. Nuclear Regulation Commission report indicates that tracer tests were conducted at Camp Lejeune, although the report does not indicate the complete nature or location of these tracer tests; it would be worthwhile to get more information on these prior tests.)
3. Page 14: Why is = 0.15 used as basis to compute the mass of contaminant in the aquifer? Why is “effective porosity” used here instead of total porosity? It doesn’t seem likely that this aquifer material would include disconnected porosity that is not contaminated. In the model a specific yield for the upper layer of 0.20 is used. It seems likely that the total porosity would be equal to or (more likely) greater than the specific yield. Thus, there may be a large error in this estimate of contaminant mass.
4. Figure 5: There are a few mislabeled contours in this figure.
Groundwater-Flow Model
1. Page 9: It is not clear why K was selectively assigned values of 0.00073 or 5.0 ft/d. Where did these particular values come from and what triggered the selective assignment?
2. Page 14 and Figure 8: The boundary conditions & domain boundary seem inadequate. Setting the southern flow boundary on Northeast Creek might be appropriate for the shallow layers, but seems dubious for the deeper layers. The maximum depth of the channel is about 10 ft in this area. Why would deep groundwater discharge vertically upward here than continue to flow laterally towards the nearby coast. I think this condition needs to be justified. Also, the northern extent of the domain seems too close to the contamination source. The indicated boundary condition will force vertically downward flow at and near the northern boundary, and it doesn’t look like this location represents a divide for the shallow flow, let alone the deeper flow.
3. Figure 11 and predevelopment calibration results: There seems to be a bias in these results. That is, areas where heads are relatively high tend to be underestimated, and in areas with lower heads (discharge areas) the calculated heads consistently are too high. This bias may be related to errors in the imposed boundary conditions that are too constraining. This bias should be corrected if possible.
4. Page 16: Not clear what the initial conditions were for the transient model. If the predevelopment potentiometric surface, did those predevelopment conditions really apply or exist in 1978? Monthly stress periods were used, but what time steps were used for each stress period?
5. Figures 13–18: There seem to be a fair number of errors greater than 10 ft. At or about t = 2,000 days, the calculated head is too high by about 20 ft in TT26, and 20 ft too low in TT31. That’s a 40-ft error in the gradient, which drives flow.
6. Page 17 and calibration process: Why was recharge adjusted to 16 in/yr in places, and where and why was this done? How was the calibration process implemented? Were recharge and pumpage rates the only parameters that were adjusted? Why not use an automated parameter estimation model?
7. Page 18–19, Advective Transport Model: Actually, MODFLOW computes fluxes (or specific discharge) between cells, not velocities. You set porosity = 0.15 in all layers except layer 1. Wouldn’t we expect the porosity in the clayey confining layers to be substantially greater than in the sandy aquifer layers? In MODPATH, why not place initial particle locations at top of layer 1, since that is exactly where the contaminants reach the water table and enter the saturated zone? It’s not clear why particles were also placed 600 ft away from the ABC Cleaners site. Are there vertical components to the calculated particle pathlines that are not being illustrated but might be important?
8. Figure 19: Is there an observed potentiometric surface for mid-1980s to compare to the calculated one?
9. Why was the porosity adjusted to 0.05 in layer 5? How could that not affect the velocity in layer 5?
10. Page 19, Summary and Discussion: It says that “simulated potentiometric levels and flow directions were highly similar in all model layers.” This is certainly not surprising because identical boundary conditions were imposed in all layers. What are budget numbers under transient conditions?
11. Page 20: It states that “the conclusion is obvious that …” But, it is not “obvious” to me that the source of PCE in TT-23 was not ABC Cleaners. What reasons support this important conclusion?
12. Advection model: It seems inadvisable to rely on a single realization of particle tracking and related travel times. The system includes heterogeneities (and uncertainties) at several scales, as well as some transient conditions, that are not represented in the model, and these will yield a variance in arrival times and source area definitions. This should be evaluated—perhaps using a coupled geostatistical and Monte Carlo approach.
Eric M. LaBolle, PhD
Response to Primary Charge Questions
1. The choice of groundwater-model cell size depends in part upon (a) the subsurface heterogeneity, specifically the scale of significant hydrofacies or upscaled heterogeneity to be modeled, and (b) the discretization necessary to obtain an accurate numerical solution to the problem posed. Discretization may also be constrained by the available computing power. The documentation lacks information on the hydrofacies scale variability necessary to assess an appropriate horizontal cell size. However, I assume that hydrogeologists building the model have chosen 50 ft based on constraints imposed by this variability. If this is indeed the case, then one would successively refine (instead of coarsen as implied by the question) the grid (while maintaining the heterogeneity associated with the 50-ft grid) in numerical experiments to determine if 50 ft is sufficient to obtain an accurate numerical solution to the problem posed.
2. One should not overlook the importance of the vertical resolution. Points (a) and (b) above also apply here. The length scales of hydrofacies in the vertical appear to be on the order of feet (or less). The modelers have upscaled these features. Therefore, the level of detail in the vertical needed to accurately model the character of fate and transport in this system potentially warrants further consideration. Additionally, if the upscaled model is to be used in its current state, the coarse vertical grid may result in unphysical, rapid vertical transport due to numerical errors and ensuing exposure misclassifications. For example, with some numerical methods used to solve the transport equations, a source to a layer will instantly mix over the entire vertical dimension within the layer, regardless of its dimensions, whereas the numerically accurate solution may predict vertical transport over days, decades, or centuries. Furthermore, coarse vertical discretization can result in an inaccurate representation of screened intervals. Numerical experiments should be performed in which one maintains the upscaled heterogeneity while refining the vertical discretization to assess the vertical resolution needed to obtain an accurate numerical solution to the problem.
3. If the water-distribution system model is necessary (see below), numerical accuracy this model is also a potential concern. Numerical experiments, similar to those suggested above, could be performed to assess the discretization in space and time necessary to obtain an accurate solution to the problem posed.
4. With regards to the temporal resolution of the water-distribution system model, I believe that ATSDR should first seek to determine if, and at what time(s), there was more than one source of water to the water-distribution system. A water-distribution system model is unnecessary to compute exposure during the time intervals when there was a single source of water to the system (only source concentrations are needed in this case). Limiting the analysis to these times can eliminate the added expense and time associated with further development of the distribution model. If a water-distribution system model is needed (for those times when there was more than one source of water to the system), then one should weigh the benefits of resolving the temporal resolution of the water-distribution system model given the inherent uncertainty in exposure estimates due to the unknown heterogeneity of the subsurface and unknown contaminant source characteristics.
5. For times when there were multiple sources to the system, then given the temporal resolution of the available data, a representative 24-hour period within a month appears appropriate for the water-distribution system model provided that typical cycling of the sources of water can be represented by a single day. Otherwise, a longer period may be needed. In either case, my experience has been that no day within the month will necessarily represent an average because there is memory in the system, particularly with regards to transport, that can (a) carry mass from the previous month into the current month (in the actual system and in the model if it is run continuously), and (b) generate patterns that do not follow a 24-hour cycle. Computing a representative day may require a continuous model with exposure averaged over several days.
6. My primary concern with the schedule is consideration for the time and methodology to compute alternative exposure scenarios, if required. Exposure misclassifications can lead to a false null result depending upon the degree of misclassification and the dose response relationship (uncertainty in the model and variability in individual response). Conversely, exposure misclassifications are not expected to yield a false correlation/dose response (because apparent responses are expected to be distributed randomly in space and time). If the dose response is weakly correlated, even a small degree of exposure misclassification can mask detection. Thus a model approach that offers the flexibility to compute numerous alternative exposure scenarios is most likely to be successful in detecting a response, if one exists (particularly if the dose response is weakly correlated). A null result, therefore, should not lead one to conclude lack of a dose response relationship and/or effects within the population due to exposure. What does ATSDR intend to do should the study initially yield a null result? How does ATSDR intend to conclude the work should the end date be reached with a null result?
7. My concern in this regard is the lack of an approach to address the hydrogeologic uncertainty and variability in the groundwater-flow and transport models. The subsurface heterogeneity, highly variable and uncertain, is likely the greatest source of uncertainty in exposure. An approach that restricts one to a single characterization of the heterogeneity limits flexibility in computing alternative exposure scenarios, and will therefore unnecessarily constrain model outcomes to a particular range of exposure estimates (based on tuning model parameters with constraints imposed by the characterization). The model response, constrained by a single characterization of the heterogeneity, may be associated with a null result due to inherent exposure misclassifications.
Response to Charge
Additional Comments
1. Hydraulic conductivity estimates appear to assume that the entire screened interval contributes significantly to the transmissivity, whereas typical high-K volume fractions can range from 20–80%. Has ATSDR accounted for high-K volume fractions (estimated from detailed logs) within the screened intervals in estimating initial K values? Is this accounted for by scaling the effective porosity?
2. The relatively small vertical gradients between aquifers suggest the possibility of significant vertical connectivity. Do the well tests include monitoring within the different aquifers to assess connectivity and degree of confinement?
3. How does ATSDR intend to deal with the acknowledged biodegradation of PCE and its byproducts in the fate and transport model, its calibration to observations, and exposure estimates?
4. Has the model been simultaneously calibrated to all available hydraulic and contaminant data (past to the present), including for example, the well test data?
5. ATSDR has noted that overcapacity in the distribution system resulted in substantial cycling, and therefore significant down time, of wells during the study period. Capture zones are a direct result of the duration and magnitude of pumping. Has ATSDR investigated the effect of using monthly averaged, versus temporally varying nominal, pumping rates on the predicted capture of contaminants? Is the use of a monthly hydraulic model appropriate to predict contaminant capture when there is significant cycling and down time of the wells (even if one does not know the actual pumpage due to data limitations)?
6. I have prepared the following table regarding exposure misclassifications and their potential effects on the result; this could be relevant given a weak dose response relationship and pertains to my response to question 3 in the primary “Charge to the Panel” questions.
Effect of Misclassification of Exposure on Ability to Detect an Association between Exposure and Health Effects
Peter Pommerenk, PhD, PE
Fate and Transport Modeling
Occurrence of Contaminants
1. Page 7: Well TT30 is mentioned in text and shown in Figure 2. Why was no further information provided, particularly with respect to the fact that no contaminants were found in this well despite its close vicinity to TT26?
2. Why were not more water-level data from locations south and west of ABC cleaners incorporated to obtain a more complete depiction of gradients in the TT and Upper Castle Hayne (UCH) aquifers?
3. On page 12 (first full paragraph) it is stated that “Well TT-23 is not located on an advective pathway from ABC One-Hour Cleaners…” referring to Figures 4 and 5 that show the 1992 potentiometric surfaces (5 years after the wells were shut down). Could it be that during the 40 years of ABC Cleaners’ operation highly variable, multiple advective pathways were present that are not reflected by Figures 4 and 5?
4. Figure 30 in the Geologic Framework section suggests a strong gradient to the south for the TT area under predevelopment conditions. Could it be expected that these conditions were reestablished by 1992, 5 years after the TT wells were shut down? If so, do Figures 4 and 5 represent a complete picture of the gradients in the TT area?
5. Based on the observation that “the lobes of PCE mass extending northwest and southwest of ABC One-Hour Cleaners are either directly opposite or somewhat orthogonal to the hydraulic gradient within the TT aquifer” (Page 13) it was suggested that pumping by other (unknown) wells caused PCE migration. Therefore, can Figures 4 and 5 be considered an adequate temporal and spatial representation of over 30 years of advective contaminant transport in the TT area?
Simulation of Ground Water Flow
1. Is it possible to elucidate how pumping rates were established to simulate withdrawals? On page 17 it is implied that pumping rates were simulated by balancing the annual withdrawals. Can this approach account for the well operation practice that has been established at the existing Camp Lejeune water systems? Because the existing wells are operated for only 6–12 hours daily and rotated every 2 to 4 weeks, is it likely that the TT wells were operated in a similar manner?
2. Camp Lejeune personnel logs both static (non-pumping) and operating (pumping) water levels for all operable wells. The “observed” hydraulic heads in Figures 14 through 18 suggest that measurements during static conditions were included for calibration. Is it appropriate to compare simulated water levels with these measurements?
3. Daily fluctuations due to nightly well shutdown do not appear to be simulated in the model. Were the pump capacities in Table 4 adjusted to account for less than 24/7 operation? How does the monthly averaging of pump rates affect the hydraulic gradients?
4. Given the relatively large discrepancy (10 ft for 2 to 3 years, or 24 stress periods) between simulated water level and observed water level in Wells TT31, TT25, and TT52 and the importance of both relative and absolute water levels to advective transport, is additional calibration warranted?
5. What is the rationale for selecting 1978 as the beginning of the model simulation?
Water-Distribution System Modeling
1. Is it possible to include a discussion of how present-day water-distribution system modeling will aid in reconstructing a past water-distribution system? For example, will C-factor testing of existing pipes allow estimates of pipe roughness 30 years ago? Are current node demands representative of past consumption considering, for example, changes in fixtures (e.g., low-flow toilets) and effects of landscaping on irrigation water demands, etc.?
2. Can a discussion be included on how the output from the groundwater model will be used as input to the water-distribution system model and what time steps will be used?
Water-Distribution System Modeling of Present Day Conditions
1. Page 4: It was assumed that domestic irrigation is more intensive from May through September. It is not clear what this means. It this a reasonable assumption considering that June through September are the wettest months in this area?
2. Pages 3–5: Is the assumption of seasonal variation in water demand (due to irrigation, heating plant and cooling system consumption) supported by historical water-production data?
3. Pages 3–5: Were troops that are currently on deployment excluded from the population estimates?
4. Page 8: What may have been the cause for the large discrepancy in accounted-for and measured water consumption for the Hadnot Point system?
5. Table 15: Is it reasonable to assume the same C-factor for a wide range of sizes and ages of pipe of the same material?
6. Figures 12–14: Are the lines showing “simulated” flow not merely input data to the model?
7. Figures 49: Are the lines showing “simulated” chloride concentrations not merely input data to the model?
8. Page 19: What are the criteria for a “calibrated” model? Figure 2 seems to indicate that daily demand patterns are highly variable; therefore, would a demand pattern modified to match hydraulic heads on a particular day be expected to be representative?
9. Page 20: What is the basis of assuming that the storage tanks behave as continuous stirred tank reactors as opposed to some other configuration, e.g., last-in-first-out?
10. Figure 54: Is there an explanation for the significant lag between simulated and measured chloride peak?
Vijay P. Singh, PhD, DSc, PE
Questions and Comments
Groundwater Modeling
1. How deep are wells?
2. Point parameters have been used for a given aquifer. What is the basis for it? Is the aquifer homogeneous and isotropic? How were the parameters computed?
3. What are the hydraulic conductivity values in both directions?
4. How was recharge estimated? What time interval was assumed? How was evaporation computed? How was infiltration computed? How was soil moisture balance maintained? How good are recharge estimates? Is there no contamination from the land surface to groundwater? How about contamination due to chemical fertilizers being applied to lawns, leaking of pipes, stormwater runoff; etc.?
5. Cell size: Why not use a variable cell size, finer near the source and coarser away from it?
6. Figures 11–18 do not show a good agreement between observations and simulations? What is concluded from these figures? Do they form the basis for accepting the goodness of the model?
7. In order to address a practical problem, a number of assumptions have been made in the modeling system, and justifiably so. The question arises: How good are the model results? What confidence can one put in the results? What is level of uncertainty associated with these results? What is main cause of uncertainty? What is the overall model reliability?
8. What is the most important parameter in the modeling system that is unknown and needs estimation?
9. Is the modeling system being used adequate? Does it need further refinement or can it be further simplified?
10. How good are the data being used? Are the data subject to quality control?
Water-Distribution System
Is the C-factor going to remain constant? It seems it will not, because of aging of pipes, deposition of contaminants, roughness growth, and so on.
Epidemiologic Study
In establishing a relation between water pollution and birth defects, is the assumption that the defects will be solely due to water pollution? How about the effects of life style, smoking, living in a chemical environment at home, intake of chemicals though food, and so on? How were the effects of these factors eliminated or singled out in the study?
James G. Uber, PhD
Observations and Key Questions
Following are my observations and key questions. I’ve included my observations as they capture the essence of my current understanding, which may need clarification or correction.
1. The simulation model studies are to quantify the exposure magnitudes and routes (including locations and times) of groundwater contamination via treated drinking water. In general, the significant source of uncertainty are associated with source characteristics, geohydrology, and transport through the water-distribution system. The study aims and goals are motivated by such sources of uncertainty and their presumed impact on the final epidemiologic analyses.
2. It appears that there is significant evidence about the source locations and also about the time intervals over which they were acting. Geohydrologic uncertainty will influence the arrival time of the plume at drinking-water wells and, thus, the time of exposure (and thus also the individuals exposed due to the transient nature of base populations). Geohydrologic uncertainty seems less important for its influence on the wells that would ultimately be within the plume capture zone, because of the relatively close proximity of sources to the drinking-water wells and the “relatively simple” geohydrology.
3. The water-distribution systems distributing treated water to the three base areas that are the focus of the study all treat (or treated) water collected and blended from multiple supply wells at a single treatment plant, before distribution. Due to the relatively short transport times in the water-distribution system compared to groundwater-transport times, the temporal exposure characteristics will be governed by the groundwater transport and the pattern of use of drinking-water wells. The water-distribution system has little influence over the temporal uncertainty in exposure.
4. Insofar as spatial uncertainty in exposed populations, the water-distribution system has a role to play, but due to well blending and single point of entry (treatment) to each base area, the spatial uncertainty is governed by the degree to which the water from different treatment plants are/were commingled within the water-distribution system. This aspect would seem to deserve more direct focus in the report and should be highlighted in an obvious way in summaries, conclusions, key questions, etc.
5. While there is direct evidence of contamination of tap water, this reviewer missed any significant discussion of the effectiveness of treatment operations to remove the various contaminants present in the supply wells. Perhaps this is obvious (or I missed it) but I am not aware if the contaminants of interest would be aerobically degraded during treatment operations, adsorbed onto filter media, or oxidized by interaction with free chlorine present during treatment and in the water-distribution system. As a relatively minor point (perhaps) there may be volatilization in storage reservoirs with a free surface, and perhaps also adsorption/desorption to/from pipe surfaces.
Thomas M. Walski, PhD, PE, DEE
Comments on Water Modeling
I reviewed the documents provided to me in preparation of the Water-Modeling Expert Peer Review Panel Meeting, with an emphasis on the water-distribution modeling work, which is my area of expertise.
1. Overview. Overall, the development of the 2004 water-distribution system model represents an excellent piece of work. The quality and detail of the model and calibration data collection is better than the usual state of the art.
2. Need for distribution model. As good as the work is for the 2004 model, I have to question the development of that model as a tool to represent the behavior of the Camp Lejeune system in the 1968–1985 study period. While it should be possible to describe the physical parameters of the system during this time period by deconstructing the current year model, the movement of contaminants in the water-distribution system depends heavily on the location of demands and the operation of the source. I don’t see where there is sufficient data to accurately model the movement of chemicals in the system.
The use of a water-distribution system model to determine exposure of individuals in the system is important if different locations can receive different concentrations of the chemicals of interest. However, in this system, it appears that all of the water in each system passes through essentially the same treatment plant in each system. Therefore, all water users should get essentially the same water. If that really is the case, a water-quality model, no matter how good, provides very little useful information beyond that using the average water quality throughout the system.
From what it appears to me on initial reading of the report, virtually everyone will get the same exposure, which would be:
Mass contaminant introduced
x (fraction of water consumed + fraction on contaminant inhaled)
x fraction of the exposure period which individual resided/worked at Camp Lejeune
= average exposure (mass units)
If good information is available from the groundwater model on the mass introduced, it may be possible to calculate the above value on an annual (or other time interval basis) it may be possible to perform the above calculation on an annual basis to account for temporal variations in source concentration. I’m not certain why we need to calculate spatial variation in exposure if the exposure is pretty uniform.
3. Discussion of 1968–1985 modeling. I would like to see a more thorough discussion of how the distribution model will be used. Most importantly, how will the model source concentration be determined?
4. Limitations on historical modeling. Even if the historical source concentrations can be reconstructed, there is still a great deal of uncertainty in how the contaminants were distributed spatially because of events such as fire, pipe breaks, and valves that were mistakenly closed.
5. Location of sampling. It was unclear to me where the positive volatile organic compound (VOC) samples were collected. If the samples were taken before the treatment plant, then what method was used for the volitalization of VOCs in the treatment plants as the water flows over weirs and is exposed to a free surface?
6. Timing of treatment. It would be good to have a time line of the evolution of treatment processes in each system. Did they use the upflow reactors during the entire period of interest?
7. Controlling tank. What is a controlling tank and how does it differ from the other tanks?
8. Tank overflow levels. I’m assuming that the tank overflow can be determined by adding the bottom of tank elevation to the maximum water level. I’m assuming that each system is a single pressure zone. However I see a wide range in overflow levels (e.g., the French Creek tank is at 169.8 ft whereas S29 is 153.9 ft). In a small system like this, either the lower tank would stay full or the taller tank would never fill. How does this work?
9. Water quality measurement. It sounds as if water quality was measured at hydrants. What steps were taken to ensure that the water being sampled was representative of the water in the main at that point?
10. Hydrant flow tests. I like the idea of using data loggers to document hydrant flow tests. However, it would be good to have someone visually watch a single residual gauge to ensure that the pressures stabilized and to make sure that pressures were not drawn down too far.
If I had this many data loggers, I would have spread out their locations.
Flow tests are very good for determining pipe roughness for the current system but roughness values do very little to affect the distribution of contaminants in the system. Because of this, I would not have done as much work on flow testing.
11. Rating curve. There was a comment that the relationship between chloride and conductivity is not linear. That is understandable in waters where chloride is not the primary ion. It is still possible, however, to develop a rating curve between chloride and conductivity, and I’m sure the study team will figure it out.
Responses to Charge
1. Sufficient detail. The water-distribution model probably has too much detail given the quality of the data that will drive it.
2. Monthly time steps. The size of the time steps depends on the time scale of source variations. Given the rate of change of conditions, annual time snapshots may even be adequate.
3. Level of detail. My advice is “keep it simple.” If the data don’t support a given level of detail, don’t go to that level of detail.
4. Project schedule. Given the difficulty of determining historical conditions, ATSDR may be better off simply admitting it can’t provide precise answers on exposure and simply acknowledge that there is a lot of uncertainty in the results instead of building precise models with imprecise data. Three more years of polishing bad data won’t make the data better. There should be more emphasis on hindcasting/archeology/detective work (whatever you want to call it) to get better historical data and less on analysis.
Issues and Questions for Discussion
1. Network model is fine; data are weak.
2. I wouldn’t spend any more time calibrating the 2005 model.
3. Installing 16 flowmeters for current conditions is overkill. I’d trade all those meters for one data point in 1980.
4. Three models are fine.
5. Two models are adequate. The interconnection should be modeled only to the extent that it was documented that it was open.
6. Some simple sensitivity analysis at this time is appropriate. I would avoid getting too fancy because the data don’t support it.
7. The approach is very good for current year models but doesn’t add much to the 1980 model.
8. If you don’t have data describing daily variations, it would be a waste of time to try to analyze them in the model.
9. Unless ATSDR gets better data on daily operation, a continuous model is not justified.
10. I don’t understand what benefit would be gained from applying genetic algorithms. I would need to get a better understanding of what parameters are being solved for and how it will be done. Without knowing more, I’m skeptical.
Summary
The bottom line is that I believe ATSDR has done a great job, given the lack of historical data. I’m not convinced that more analysis will significantly reduce the uncertainty.