- Disclaimer
- List of Tables
- List of Figures
- List of Appendices
- Executive Summary
- Introduction
- Methods
- Results
- Summary of Results, 1993-2003
- Public Use Dataset
- Prevention Activities
- Uses of HSEES Data
- References
- Appendices
- Distribution of a comprehensive report on anhydrous ammonia releases to
more accurately determine the precise cause of such releases. The report was
based on a survey distributed in 2001-2002 to previously responsible parties.
The goal of the report was to increase awareness of the stringent safety and
security measures that must be taken to prevent these types of releases and to
reinforce the need for education of employees, responders, and the general
public about the hazards of anhydrous ammonia.
- Distribution of a brochure on HSEES data related to carbon monoxide events
to local emergency planning committees (LEPCs), emergency responders, and
local health departments. The goal of the brochure was to prevent injury
and/or death from exposure to carbon monoxide related to improper use of
heating sources such as charcoal, propane, and other heat sources during
extended power outages.
- Continued collaboration in a partnership to reduce mercury in schools by
developing (a) informational brochures, (b) an inventory tool to assist school
personnel in identifying possible sources of mercury and mercury-containing
items, and (c) guidance for cleaning up small mercury spills. The materials
were distributed to schools, the agencies involved in the partnership, and
other interested parties. The goal of this outreach effort is to prevent
mercury contamination in schools and on school grounds.
- Distribution of quarterly reports and county-specific HSEES data to
identify trends in the numbers of events, number of events resulting in
victims, and the number of victims. Information was made available in print
and electronic media to county emergency management personnel, LEPCs, county
and local fire and police departments, area hospitals, local public health
agencies, and other interested parties.
- Collaboration with a hospital association to produce a hospital needs
assessment of facilities with emergency departments. The needs assessment
ascertained the hospital's ability to treat patients presenting with symptoms
of chemical exposure with regard to equipment, decontamination and isolation
areas, resources, and guidelines for treatment. The results of the needs
assessment indicated that many hospitals are not fully equipped to handle
patients exposed to hazardous substances. ATSDR's Managing Hazardous Materials
Incidents guidelines were given to the hospitals to assist in preparing for
patients who present with symptoms of chemical exposure. Additionally, the
hospital association is developing recommendations for treating patients who
have been exposed to hazardous substances.
Download Adobe Acrobat (PDF) version - 1208KB
Historical Document
This document is provided by the Agency for Toxic Substances and Disease Registry (ATSDR) ONLY as an historical reference for the public health community. It is no longer being maintained and the data it contains may no longer be current and/or accurate.
In 1980, Congress created the Agency for Toxic Substances and Disease Registry (ATSDR) to implement health-related sections of laws that protect the public from hazardous wastes and environmental spills of hazardous substances. The Comprehensive Environmental Response, Compensation, and Liability Act of 1980 (CERCLA), commonly known as the "Superfund" Act, designated ATSDR as the lead agency within the Public Health Service to help prevent or reduce further exposure to hazardous substances and the adverse health effects that result from such exposures, and also to expand the knowledge base about such effects.
This publication reports the results and findings of a health study, registry, or other health-related activity supported by ATSDR in accordance with its legislative mandate described above.
Comments regarding this report are welcome. Please send your comments to the following address:
Agency for Toxic Substances and Disease Registry
Attn: Director, Division of Health Studies (E-31)
1600 Clifton Road, N.E.
Atlanta, Georgia 30333
Agency for Toxic Substances and Disease Registry
Julie L. Gerberding, MD, MPH, Administrator
Henry Falk, MD, MPH, Assistant Administrator
Division of Health Studies
G. David Williamson, PhD, Director
Sharon Campolucci, MSN, Deputy Director
Kim Blindauer, DVM, MPH, Assistant Director for Science
Epidemiology and Surveillance Branch
Wendy E. Kaye, PhD, Chief
Hazardous Substances Emergency Events Surveillance Staff
Zahava Berkowitz, MSc, MSPH
Kevin Horton, MSPH
Maureen Orr, MS
Shannon Rossiter, MPH
Perri Zeitz Ruckart, MPH
Casetta R. Simmons
Wendy Wattigney, MStat
Charles Weir, MS
Use of trade names and commercial sources is for identification only and does not imply endorsement by the Agency for Toxic Substances and Disease Registry or the U.S. Department of Health and Human Services.
Contents
List of Tables
Table 2 – Number of substances involved per event, by type of event-Hazardous Substances Emergency Events Surveillance, 2003
Table 3 – Industries involved in hazardous substance events, by category-Hazardous Substances Emergency Events Surveillance, 2003
Table 4 – Number of substances involved, by substance category and type of event- Hazardous Substances Emergency Events Surveillance, 2003
Table 5 – Number of victims per event, by type of event-Hazardous Substances Emergency Events Surveillance, 2003
Table 6 – Frequency of substance categories in all events and events with victims- Hazardous Substances Emergency Events Surveillance, 2003
Table 7 – Frequencies of injuries/symptoms, by type of event-Hazardous Substances Emergency Events Surveillance, 2003
Table 8 – Distribution of personnel who responded to the event-Hazardous substances Emergency Events Surveillance, 2003
Table 9 – Cumulative data by year-Hazardous Substances Emergency Events Surveillance, 1993-2003
Table 10 – Time period each state participated in Hazardous Substances Emergency Events Surveillance, 1993-2003
List of Figures
Figure 1 – Areas of fixed facilities involved in events-Hazardous Substances Emergency Events Surveillance, 2003
Figure 2 – Distribution of transportation-related events, by type of transport-Hazardous Substances Emergency Events Surveillance, 2003
Figure 3a – Primary factors reported as contributing to events-Hazardous Substances Emergency Events Surveillance, 2003
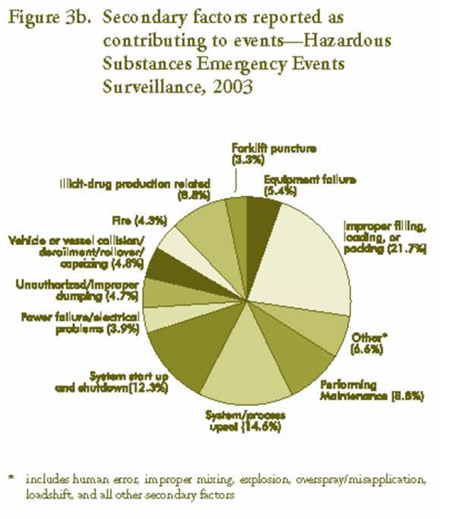
Figure 3b – Secondary factors reported as contributing to events-Hazardous Substances Emergency Events Surveillance, 2003
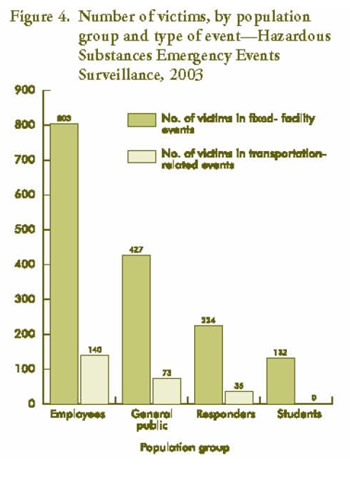
Figure 4 – Number of victims, by population group and type of event-Hazardous Substances Emergency Events Surveillance, 2003
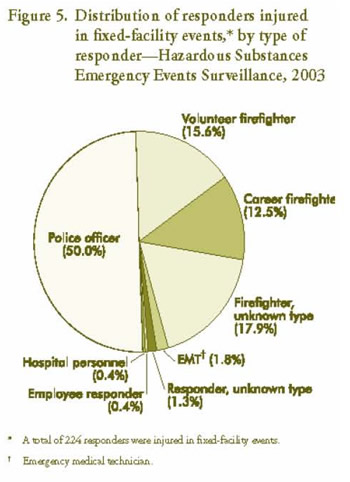
Figure 5 – Distribution of responders injured in fixed-facility events, by type of responder- Hazardous Substances Emergency Events Surveillance, 2003
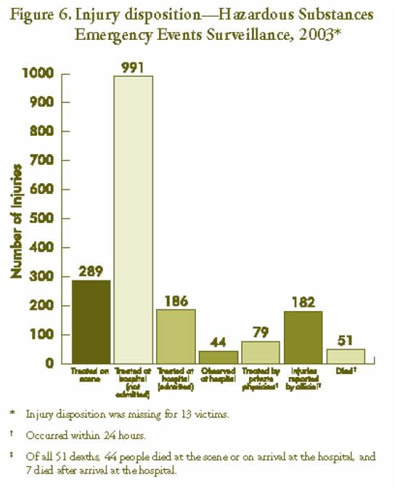
Figure 6 – Injury disposition-Hazardous Substances Emergency Events Surveillance, 2003
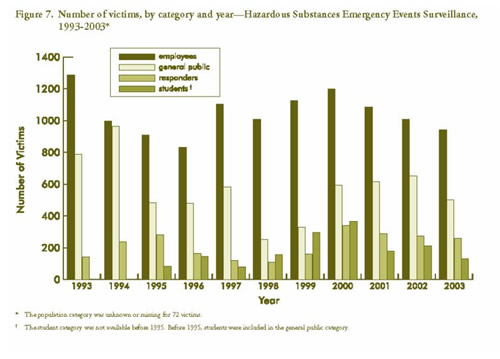
Figure 7 – Number of victims, by category and year-Hazardous Substances Emergency Events Surveillance, 1993-2003
List of Appendices
Appendix
A – The 102 substances most frequently involved in events-Hazardous
Substances Emergency Events Surveillance, 2003
Appendix
B – Publications reference list

Executive Summary
The Hazardous Substances Emergency Events Surveillance (HSEES) system, maintained by the Agency for Toxic Substances and Disease Registry (ATSDR), actively collects information to describe the public health consequences of acute releases of hazardous substances in 15 states. This report summarizes the characteristics of events reported to ATSDR by all participating state health departments in 2003. Information about acute events involving hazardous substances was collected, including the substance(s) released, number of victims, number and types of injuries, and number of evacuations. The data were computerized using an ATSDR-provided Web-based data entry system.
A total of 9,105 events were reported. In 8,060 (88.5%) events, only one substance was released. The most commonly reported categories of substances were other inorganic substances (excluding chemicals in the categories of acids, bases, ammonia, and chlorine), volatile organic compounds, and mixtures involving substances from different categories that were mixed or formed from a reaction before release. During this reporting period, 720 events (7.9% of all reported events) resulted in a total of 1,835 victims, of whom 51 (2.8%) died. The most frequently reported injuries were respiratory irritation, headaches, and gastrointestinal system problems. Evacuations were ordered for 531 (5.9%) events.
The findings regarding the percentage of events with victims and the distribution of the types of injuries reported have been consistent in recent years. Prevention outreach efforts continue to focus on chemicals that are likely to result in victims.
The Centers for Disease Control and Prevention defines
surveillance as the
"ongoing, systematic collection, analysis, and
interpretation of health data essential to the planning, implementation, and
evaluation of public health practice, closely integrated with the timely
dissemination of these data to those who need to know. The final link of the
surveillance chain is the application of these data to prevention and control. A
surveillance system includes a functional capacity for data collection,
analysis, and dissemination linked to public health programs"
[1].
Since 1990, the Agency for Toxic Substances and Disease Registry (ATSDR) has maintained an active, state-based Hazardous Substances Emergency Events Surveillance (HSEES) system to describe the public health consequences of releases of hazardous substances. The decision to initiate a surveillance system of this type was based on a study published in 1989 about the reporting of hazardous substances releases to three national databases: the National Response Center Database, the Hazardous Material Information System (HMIS), and the Acute Hazardous Events Database [2].
A review of these databases indicated limitations. Many events were missed because of specific reporting requirements (for example, the HMIS did not record events involving intrastate carriers or fixed-facility events). Other important information was not recorded, such as the demographic characteristics of victims, the types of injuries sustained, and the number of persons evacuated. As a result of this review, ATSDR implemented the HSEES system to more fully describe the public health consequences of releases of hazardous substances.
HSEES has several goals:
For a surveillance system to be useful, it must not only be a repository for data, but the data must also be used to protect public health.
In the last few years, the last goal of the HSEES system has been emphasized; i.e., to develop strategies to reduce subsequent morbidity and mortality by having each participating state analyze its data and develop appropriate prevention outreach activities. These activities are intended to provide industry, responders, and the general public with information that can help prevent chemical releases and reduce morbidity and mortality if a release occurs.
This report provides an overview of HSEES for 2003 in all participating states, summarizes the characteristics of acute releases of hazardous substances and their associated public health consequences, and demonstrates how data from the system are translated into prevention activities to protect public health.
In 2003, fifteen state health departments participated in HSEES: Alabama, Colorado, Iowa, Louisiana, Minnesota, Mississippi, Missouri, New Jersey, New York, North Carolina, Oregon, Texas, Utah, Washington, and Wisconsin.
Beginning in 2002, a newly updated data-collection form, approved by the Office of Management and Budget, went into effect. Information was collected about each event, including substance(s) released, victims, injuries (adverse health effects and symptoms), and evacuations.
Various data sources were used to obtain information about these events. These sources included records and oral reports of state environmental protection agencies, the U.S. Department of Transportation, the National Response Center, police and fire departments, and hospitals. Census data were used to estimate the number of residents in the vicinity of the events. All data were computerized using a Web-based data entry system provided by ATSDR.
HSEES defines hazardous substances emergency events as acute uncontrolled or illegal releases or threatened releases of hazardous substances. Events involving releases of only petroleum are excluded. Events are included if (a) the amount of substance released (or that might have been released) needed (or would have needed) to be removed, cleaned up, or neutralized according to federal, state, or local law or (b) the release of a substance was threatened, but the threat led to an action (for example, evacuation) that could have affected the health of employees, emergency responders, or members of the general public. HSEES defines victims as people who experience at least one documented adverse health effect within 24 hours after the event or who die as a consequence of the event. Victims who receive more than one type of injury or symptom are counted once in each applicable injury type or symptom. Events are defined as transportation-related if they occur (a) during surface, air, pipeline, or water transport of hazardous substances, or (b) before being unloaded from a vehicle or vessel. All other events are considered fixed-facility events.
For data analyses, the substances released were categorized into 16 groups. The category "mixture" comprises substances from different categories that were mixed or formed from a reaction before the event; the category "other inorganic substances" comprises all inorganic substances except acids, bases, ammonia, and chlorine; and the category "other" comprises substances that could not grouped into one of the other existing categories.
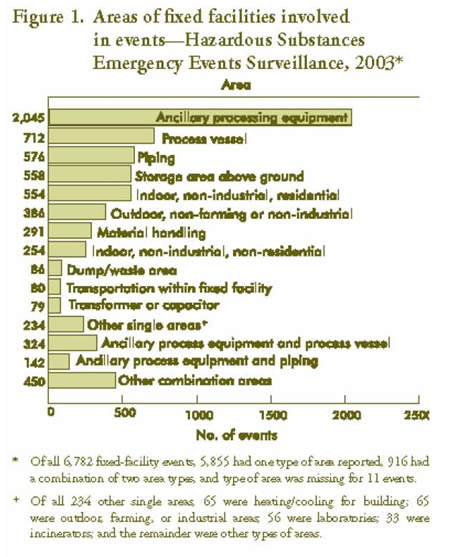
For 2003, a total of 9,105 acute hazardous substances events were reported to HSEES: 300 (3.3%) of these events were threatened releases. Fifty-six (0.6%) were events in which substances were both threatened to be released and actually released. A total of 6,782 (74.5%) events occurred in fixed facilities. Two states, Texas and New York, reported 42.6% of all releases event occurred could be selected. Of all 6,782 fixed-facility events, 5,855 (86.3%) reported one type of area and 916 (13.5%) reported a combination of two area types. Type of area was not reported for 11 (0.2%) events. Among events with one type of area reported, the main areas were classified as follows: 2,045 (34.9%) ancillary processing equipment, 712 (12.2%) process vessel (a reaction chamber in which chemicals are processed), and 576 (9.8%) piping (Figure 1). Of the events with two areas, 497 (54.2%) involved ancillary processing equipment in combination with other types of areas.
Table 1 - Number of events meeting the surveillance definition, by state and type of event
|
STATE REPORTING EVENT |
TYPE OF EVENT |
TOTAL NO. OF EVENTS ( %) | |||
| FIXED FACILITY | TRANSPORTATION | ||||
| NO. OF EVENTS | %* | NO. OF EVENTS | %* | ||
| Alabama | 90 | 48.4 | 96 | 51.6 | 186 (2.0) |
| Colorado | 55 | 29.3 | 133 | 70.7 | 188 (2.1) |
| Iowa | 240 | 73.4 | 87 | 26.6 | 327 (3.6) |
| Louisiana | 587 | 87.1 | 87 | 12.9 | 674 (7.4) |
| Minnesota | 323 | 73.7 | 115 | 26.3 | 438 (4.8) |
| Mississippi | 107 | 56.9 | 81 | 43.1 | 188 (2.1) |
| Missouri | 225 | 52.3 | 205 | 47.7 | 430 (4.7) |
| New Jersey | 508 | 72.5 | 193 | 27.5 | 701 (7.7) |
| New York | 852 | 75.7 | 273 | 24.3 | 1,125 (12.4) |
| North Carolina | 195 | 52.1 | 179 | 47.9 | 374 (4.1) |
| Oregon | 189 | 73.8 | 67 | 26.2 | 256 (2.8) |
| Texas | 2482 | 90.1 | 272 | 9.9 | 2,754 (30.2) |
| Utah | 364 | 76.8 | 110 | 23.2 | 474 (5.2) |
| Washington | 380 | 65.5 | 200 | 34.5 | 580 (6.4) |
| Wisconsin | 185 | 45.1 | 225 | 54.9 | 410 (4.5) |
| Total | 6,782 | 74.5 | 2,323 | 25.5 | 9,105 (100.0) |
* Percentage = (number of events by type of event per state/total number of events in that state) x 100
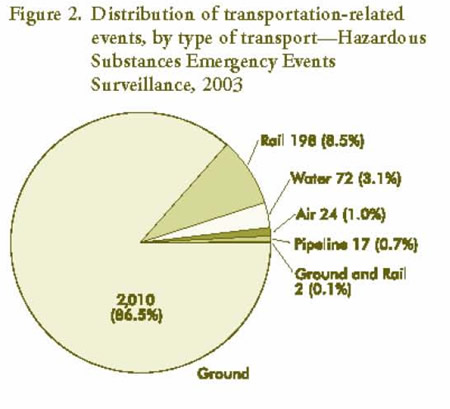
Of the 2,323 transportation-related events, 2,010 (86.5%) occurred during ground transport (e.g., truck, van, or tractor) and 198 (8.5%) involved transport by rail (Figure 2). Fewer events involved water, air, and pipeline transportation modes. Most (82.2%) ground transportation events involved trucks. The largest proportions of transportation-related events occurred during unloading of a stationary vehicle or vessel (900 [38.8%]) and from a moving vehicle or vessel (737 [31.8%]). Of the 2,323 transportation-related events, 635 (27.4%) involved a release en route that was later discovered at a fixed facility. Factors contributing to the events consisted of primary and secondary entries. Primary factors were reported for 9,008 (98.9%) events (Figure 3a). Of the reported primary factors, most (58.7%) fixed-facility events involved equipment failure, and most (65.7%) transportation-related events involved human error.
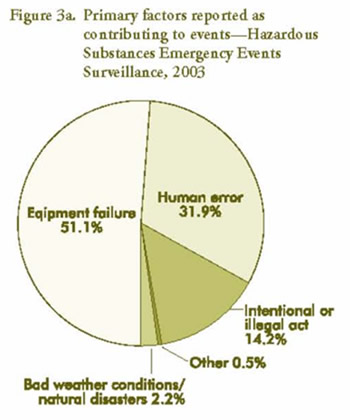
Secondary factors were reported for 6,091 (66.9%) events (Figure 3b). Of the reported secondary factors, most (20.2%) fixed-facility events involved system/process upset, and most (55.7%) transportation-related events involved improper filling, loading, or packing.
More than 88% of all events involved the release of only one substance. Two substances were released in approximately 5% of the events, and approximately 7% involved the release of more than two substances (Table 2). Fixed-facility events were more likely than transportation events to have two or more substances released in an event (13.4% vs. 5.9%).
Table 2 - Number of substances involved per event, by type of event
| NO. OF SUBSTANCES RELEASED | TYPE OF EVENT | ALL EVENTS | |||||||
| FIXED FACILITY | TRANSPORTATION | ||||||||
| NO. OF EVENTS | (%) | NO. OF
SUB- STANCES |
NO. OF EVENTS | (%) | NO. OF
SUB- STANCES |
NO. OF EVENTS | (%) | NO. OF
SUB- STANCES | |
| 1 | 5,873 | 86.6 | 5,783 | 2,187 | 94.1 | 2,187 | 8,060 | 88.5 | 8,060 |
| 2 | 353 | 5.2 | 706 | 90 | 3.9 | 180 | 443 | 4.9 | 886 |
| 3 | 144 | 2.1 | 432 | 28 | 1.2 | 84 | 172 | 1.9 | 516 |
| 4 | 261 | 3.9 | 1,044 | 13 | 0.6 | 52 | 274 | 3.0 | 1,096 |
| ≥ 5 | 151 | 2.2 | 1,416 | 5 | 0.2 | 44 | 156 | 1.7 | 1,460 |
| Total | 6,782 | 100.0 | 9,471 | 2,323 | 100.0 | 2,547 | 9,105 | 100.0 | 12,018 |
The number of events by month ranged from 613 (6.7%) in February to 915 (10.1%) in July, with the largest proportions occurring from June through August. The proportion of events ranged from 15.9% to 17.2% during weekdays, and from 8.7% to 9.5% during weekend days. Of all 8,908 (97.8%) events for which time of day or time category was reported, 34.9% occurred from 6:00 AM to 11:59 AM, 31.8% from 12:00 PM to 5:59 PM, 18.6% from 6:00 PM to 11:59 PM, and the remainder during the early hours of the day.
The largest proportions of HSEES events were associated with the manufacturing (3,880 [42.6%]) and transportation (2,167 [23.8%]) industries (Table 3). Within manufacturing, chemical and allied products manufacturing (1,996 [51.4%]) and petroleum and coal manufacturing (1,251 [32.2%]) accounted for most of the events. The largest number of events with victims occurred from non-industrial illegal activity (illicit drug related) (125 [17.4%]). The total number of victims was greatest in the manufacturing industry (365 [19.9%]) followed by the number of victims in professional services (279 [15.2%]) and illegal activity (illicit drug related) (125 [11.7%]). The subcategory food and kindred products manufacturing accounted for 26.3% of all victims in the manufacturing industry. Although the manufacturing industry resulted in a large proportion of events with victims and a large number of victims, only 3.0% of all manufacturing events resulted in victims. Conversely, 35.5% of all events in the finance and real estate industry resulted in victims, but this industry represents a small proportion (1.5%) of events with victims.
Table 3 - Industries involved in hazardous substance events, by category
| INDUSTRY CATEGORY | TOTAL EVENTS | EVENTS WITH VICTIMS |
% EVENTS WITH VICTIMS |
TOTAL NO. OF VICTIMS (MAXIMUM)* | ||
| NO. | % | NO. | % | |||
| Abandoned† | 147 | 1.6 | 4 | .06 | 2.7 | 6 (3) |
| Agriculture | 185 | 2.0 | 30 | 4.2 | 16.2 | 148 (85) |
| Business and repair services | 64 | 0.7 | 15 | 2.1 | 23.4 | 22 (5) |
| Communication | 7 | <0.1 | 1 | 0.1 | 14.3 | 1 (1) |
| Construction | 107 | 1.2 | 20 | 2.8 | 18.7 | 38 (11) |
| Entertainment | 38 | 0.4 | 9 | 1.3 | 23.7 | 25 (9) |
| Finance and Real estate | 31 | 0.3 | 11 | 1.5 | 35.5 | 57 (16) |
| Illegal activity (illicit drug related) | 515 | 5.7 | 125 | 17.4 | 24.2 | 215 (11) |
| Illegal activity (non-illicit drug related) | 48 | 0.5 | 16 | 2.2 | 33.3 | 54 (15) |
| Manufacturing | 3,880 | 42.6 | 118 | 16.4 | 3.0 | 365 (40) |
| Mining | 252 | 2.8 | 2 | 0.3 | 0.8 | 2 (1) |
| Personal Services | 255 | 2.8 | 60 | 8.3 | 23.5 | 148 (26) |
| Private vehicle or property | 50 | 0.5 | 9 | 1.3 | 18.0 | 17 (5) |
| Professional services | 222 | 2.4 | 77 | 10.7 | 34.7 | 279 (44) |
| Public administration | 88 | 1.0 | 22 | 3.1 | 25.0 | 52 (20) |
| Retail trade | 143 | 1.6 | 42 | 5.8 | 29.4 | 103 (18) |
| Transportation | 2,167 | 23.8 | 94 | 13.1 | 4.3 | 176 (15) |
| Utilities | 533 | 5.9 | 36 | 5.0 | 6.8 | 69 (6) |
| Wholesale trade | 316 | 3.5 | 20 | 2.8 | 6.3 | 44 (10) |
| Unspecified and unknown | 57 | 0.6 | 9 | 1.3 | 15.8 | 14 (3) |
| Total‡ | 9,105 | 99.9 | 720 | 100.3 | 7.9 | 1,835 |
*Minimum number of victims per event=1.
† Includes chemical dumped on highway or other property and currently non-operating former business.
‡Percentages do not total 100% because of rounding.
A total of 12,018 substances were released in all events, of which 1,125 (9.4%) substances were reported as threatened to be released. The substances most frequently released were ammonia, sulfur dioxide, carbon monoxide, and nitrogen oxide (NOX) (Appendix A). Substances were grouped into 16 categories. The substance categories most commonly released in fixed-facility events were other inorganic substances (2,407 [25.5%]), volatile organic compounds (1,666 [17.7%]), and mixtures (1465 [15.5%]) (Table 4). In transportation-related events, the most common substance categories released were volatile organic compounds (493 [19.5%]), acids (362 [14.3%]), and other (250 [9.9%]).
Two types of releases for each substance (e.g., spill and air) could be reported. Only one type of release was associated with the following: air release (5,527 [48.3%]), spill (4,352 [38.0%]), threatened release (1,133 [9.9%]), fire (357 [3.1%]), explosion (60 [0.5%]), and radiation (11 [0.1%]). Of events with two types of releases, the following combinations were reported: spill and air releases (370 [64.6%]), spill and fire (76 [13.3%]), fire and explosion (70 [12.2%]), spill and explosion (47 [8.2%]), and the remaining 10 (1.7%) involved other combinations of release types. The release type was missing for 5 substances.
Table 4 - Number of substances involved, by substance category and type of event
| SUBSTANCE CATEGORY | TYPE OF EVENT | ALL EVENTS | ||||
| FIXED FACILITY | TRANSPORTATION | |||||
| NO. OF SUBSTANCES | (%) | NO. OF SUBSTANCES | (%) | NO. OF SUBSTANCES | (%) | |
| Acids | 660 | 7.0 | 362 | 14.3 | 1,022 | 8.5 |
| Ammonia | 519 | 5.5 | 72 | 2.8 | 591 | 4.9 |
| Bases | 265 | 2.8 | 231 | 9.1 | 496 | 4.1 |
| Chlorine | 202 | 2.1 | 33 | 1.3 | 235 | 2.0 |
| Formulations | 14 | 0.1 | 3 | 0.1 | 17 | 0.1 |
| Hetero-organics | 83 | 0.9 | 44 | 1.7 | 127 | 1.1 |
| Hydrocarbons | 108 | 1.1 | 53 | 2.1 | 161 | 1.3 |
| Mixtures* | 1,465 | 15.5 | 72 | 2.8 | 1,537 | 12.8 |
| Other | 593 | 6.3 | 250 | 9.9 | 843 | 7.0 |
| Other inorganic substances | 2,407 | 25.5 | 230 | 9.1 | 2,637 | 22.0 |
| Oxy-organics | 710 | 7.5 | 171 | 6.8 | 7.4 | |
| Paints and dyes | 168 | 1.8 | 170 | 6.7 | 338 | 2.8 |
| Pesticides | 353 | 3.7 | 242 | 9.6 | 595 | 5.0 |
| Polychlorinated biphenyls | 80 | 0.8 | 3 | 0.1 | 83 | 0.7 |
| Polymers | 142 | 1.5 | 103 | 4.1 | 245 | 2.0 |
| Volatile organic compounds | 1,666 | 17.7 | 493 | 19.5 | 2,159 | 18.0 |
| Total¶ | 9,435 | 99.8 | 2,532 | 100.0 | 11,967 | 99.7 |
* Substances from different categories that were mixed or formed from a reaction before the event.
† Not belonging to one of the existing categories.
‡ All inorganic substances except for acids, bases, ammonia, and chlorine.
¶Of a total of 12,018 substances, 51 were excluded because they were not assigned a substance category: 36 occurred in fixed facilities and 15 during transportation. Percentages do not total 100% because of rounding.
A total of 1,835 victims were involved in 720 events (7.9% of all events) (Table 5). Of the 720 events with victims, 456 (63.3%) events involved only one victim, and 123 (17.1%) involved two victims. Of all victims, 1,586 (86.4%) were injured in fixed–facility events. Fixed-facility events were more likely to have three or more victims per event (21.1%) than were transportation-related events (13.6%). Additionally, 347 persons in 115 events (1.3% of all events) were observed at a hospital or medical facility but did not have symptoms resulting from the event and, therefore, were not counted as victims.
Table 5 - Number of victims per event, by type of event
| NO. OF VICTIMS | TYPE OF EVENT | ALL EVENTS | |||||||
| FIXED FACILITY | TRANSPORTATION | ||||||||
| NO. OF EVENTS | (%) | NO. OF VICTIMS | NO. OF EVENTS | (%) | NO. OF VICTIMS | NO. OF EVENTS | (%) | NO. OF VICTIMS | |
| 1 | 364 | 364 | 92 | 62.6 | 92 |
456 |
63.3 |
456 |
|
| 2 | 88 | 176 | 35 | 23.8 | 70 |
123 |
17.1 |
246 |
|
| 3 | 40 | 120 | 8 | 5.4 | 24 |
48 |
6.7 |
144 |
|
| 4 | 16 | 64 | 5 | 3.4 | 20 |
21 |
2.9 |
84 |
|
| 5 | 15 | 75 | 5 | 3.4 | 25 |
20 |
2.8 |
100 |
|
| ≥6 | 50 | 787 | 2 | 1.4 | 18 |
52 |
7.2 |
805 |
|
| Total | 573 | 100.0 | 1,586 | 147 | 100.0 | 249 | 720 | 100.1 | 1,835 |
To represent the magnitude of the effects of substances involved in injuries, the number of events in a specific substance category was compared with the number of events in the same category that resulted in victims.
In events that involved one or more substances from the same substance category, substances were counted once in that category. In events that involved two or more substances from different categories, substances were counted once in the multiple substance category. Substances released most often were not necessarily the most likely to result in victims (Table 6). For example, events categorized as other inorganic substances constituted 16.9% of all events; however, only 2.9% of these events resulted in injuries. Conversely, events involving chlorine and ammonia exclusively accounted for 2.3% and 5.1% of all events respectively, but 23.4% of the chlorine events and 15.9% of ammonia events resulted in injuries.
Table 6 - Frequency of substance categories in all events and events with victims*
| SUBSTANCE CATEGORY | NO. OF RELEASES | (%) | NO. OF RELEASES WITH VICTIMS | (%) | PERCENTAGE OF RELEASES WITH VICTIMS |
|
Acids |
665 |
7.3 |
95 |
13.3 |
14.3 |
|
Ammonia |
466 |
5.1 |
74 |
10.4 |
15.9 |
|
Bases |
369 |
4.1 |
28 |
3.9 |
7.6 |
|
Chlorine |
205 |
2.3 |
48 |
6.7 |
23.4 |
|
Formulations |
16 |
0.2 |
1 |
0.1 |
6.3 |
|
Hetero-organics |
80 |
0.9 |
4 |
0.6 |
5.0 |
|
Hydrocarbons |
94 |
1.0 |
6 |
0.8 |
6.4 |
|
Mixture† |
4,459 |
16.1 |
47 |
6.6 |
3.2 |
|
Multiple substance category |
842 |
9.3 |
117 |
16.4 |
13.9 |
|
Other‡ |
569 |
6.3 |
82 |
11.5 |
14.4 |
|
Other inorganic substances§ |
1,533 |
16.9 |
44 |
6.2 |
2.9 |
|
Oxy-organics |
550 |
6.1 |
59 |
8.3 |
10.7 |
|
Paints and dyes |
289 |
3.2 |
13 |
1.8 |
4.5 |
|
Pesticides |
407 |
4.5 |
31 |
4.3 |
7.6 |
|
Polychlorinated biphenyls |
79 |
0.9 |
0 |
0.0 |
0.0 |
|
Polymers |
193 |
2.1 |
11 |
1.5 |
5.7 |
|
Volatile organic compounds |
1,256 |
13.8 |
54 |
7.6 |
4.3 |
| Total | 9,072 | 100.1 | 714 | 100.0 | 7.9 |
*Substances in events that involved multiple substances were counted only once in a substance category when all the substances were associated with the same category. If events involved multiple substances from different substance categories, they were counted only once in the multiple substance category.
†Substances from different categories that were mixed or formed from a reaction before the event.
‡Not classified.
§All inorganic substances except for acids, bases, ammonia, and chlorine.
¶Percentages do not total 100% because of rounding. Of a total of 9,105 events, 33 were excluded because they were not assigned a substance category. Of the 33 events, 32 involved one substance each, and 1event involved two substances that could not be categorized. Six of the excluded events had victims.
Employees (943 [51.4%]) constituted the largest proportion of the population groups injured, followed by members of the general public (500 [27.2%]) (Figure 4). In fixed-facility events, 224 emergency response personnel were injured. Of those, 112 (50.0%) were police officers, 35 (15.6%) were volunteer firefighters, and 28 (12.6%) were career firefighters (Figure 5). Thirty-six responders were injured in transportation-related events. Of these, most (34 [94.4%]) were police officers, 1 (2.8%) was a firefighter of unknown type, and 1 (2.8%) was a responder of unknown type. Police officers were injured more frequently in transportation-related events (94.4%) than in fixed facility-events (50.0%).
Victims were reported to sustain a total of 2,964 injuries or symptoms (Table 7). Some victims had more than one injury or symptom. Of all reported injuries/symptoms, the most common injuries/symptoms in fixed-facility events were respiratory irritation (825 [31.1%]), headaches (381 [14.3%]), and gastrointestinal problems (354 [13.3%]). In transportation-related events, trauma (97 [31.5%]), respiratory irritation (78 [25.3%]), and eye irritation (28, 9.1%) were reported most frequently. Most (93.5%) of the trauma injuries in transportation-related events were not substance-related; these injuries resulted from a chain of events, such as a motor vehicle accident leading to the release of a hazardous substance, and not from exposure to the substance itself.
Table 7 - Frequencies of injuries/symptoms, by type of event*
| TYPE OF INJURY | TYPE OF EVENT | ALL EVENTS | ||||
| FIXED FACILITY | TRANSPORTATION | |||||
| NO. OF INJURIES | (%) | NO. OF INJURIES | (%) | NO. OF INJURIES | (%) | |
|
Chemical burns |
91 |
3.4 |
20 |
6.5 |
111 |
3.7 |
|
Dizziness/central nervous system symptoms |
302 |
11.4 |
11 |
3.6 |
313 |
10.6 |
|
Eye irritation |
268 |
10.1 |
28 |
9.1 |
296 |
10.0 |
|
Gastrointestinal system problems |
354 |
13.3 |
15 |
4.9 |
369 |
12.4 |
|
Headache |
381 |
14.3 |
27 |
8.8 |
408 |
13.8 |
|
Heart problems |
10 |
0.4 |
1 |
0.3 |
11 |
0.4 |
|
Heat stress |
11 |
0.4 |
0 |
0.0 |
11 |
0.4 |
|
Other |
28 |
1.1 |
2 |
0.6 |
30 |
1.0 |
|
Respiratory irritation |
825 |
31.1 |
78 |
25.3 |
903 |
30.5 |
|
Shortness of breath |
47 |
1.8 |
7 |
2.3 |
54 |
1.8 |
|
Skin irritation |
162 |
6.1 |
13 |
4.2 |
175 |
5.9 |
|
Thermal burns |
76 |
2.9 |
9 |
2.9 |
85 |
2.9 |
|
Trauma† |
101 |
3.8 |
97 |
31.5 |
198 |
6.7 |
| Total | 2,656 | 100.0 | 308 | 100.0 | 2,964 | 100.1 |
*The number of injuries is greater than the number of victims (1,835) because a victim could have had more than one injury.
† Of the 198 trauma injuries, 39 were chemical-related, 134 were not chemical-related, 7 were both chemical and non-chemical related, and the type of trauma was missing for 13 injuries.
‡ The injuries of one victim were not reported. Percentages do not total 100% because of rounding.
The median age of the 745 (40.6%) victims for whom exact age was reported was 35 years (range: 1-96 years). For the 1,359 (74.1%) injured persons for whom an age category was reported, 11 (0.8%) were <5 years of age, 131 (9.6%) were 5-14 years of age, 62 (4.6%) were 15-19 years of age, 861 (63.4%) were 20-44 years of age, 274 (20.2%) were 45-64 years of age, and 20 (1.5%) were >65 years of age. Of the 476 injured persons for whom age was not reported, 322 (67.6%) were presumably adults (because their population group was reported as responders or employees), and 154 (32.4%) could have been adults or children (because their population group was reported as members of the general public).
Sex was known for 1,447 (78.9%) of the victims; of these, 981 (67.8%) were males. Of all employees and responders for whom sex was reported, 75.4% were males.
Of the 1,835 victims, 991 (54.4%) were treated at a hospital without admission and 289 (15.9%) were treated at the scene. Fifty-one (2.8%) deaths were reported (Figure 6). Severity was unknown for 13 (0.7%) victims.
The status of personal protective equipment (PPE) use was reported for 822 (87.2%) employee-victims and for 234 (90.0%) responder-victims. Most of the employee-victims (91.0%) and 31.6% of the responder-victims had not worn any form of PPE. Employee-victims who wore PPE most often used eye protection (23 [31.1%]) and gloves (17 [23.0%]). Among injured emergency responders who wore PPE, 60 (25.6 %) wore firefighter turnout gear with respiratory protection, 60 (25.6%) wore gloves, and 21 (9.0%) wore firefighter turnout gear without respiratory protection.*
Only one event involved more than 50 injured people. Eighty-five employees were injured due to carbon monoxide exposure from three forklifts that were operating at an onion processing plant. The release was caused by human error. All of the victims reported headaches and gastrointestinal system problems, and 28 (32.9%) also reported dizziness/central nervous system symptoms and respiratory irritation. Seventy-two employee-victims were treated at a hospital and released, and 13 were admitted to a hospital. Ninety-two people were evacuated from the building for 20 hours, and access to the building was restricted. A fire department and certified HazMat team responded to this event.
The proximity of the event location in relation to selected populations was determined using geographic information systems (GIS) or health department records. Residences were within 1/4 mile of 6,155 (68.6%) events, schools within 1/4 mile of 1,007 (11.3%) events, hospitals within 1/4 mile of 119 (1.3%) events, nursing homes within 1/4 mile of 344 (3.9%) events, licensed daycares within 1/4 mile of 1,053 (11.8%) events, industries or other businesses within 1/4 mile of 8,138 (91.1%) events, and recreational areas within 1/4 mile of 910 (10.2%) events. Information for proximity of the event location in relation to selected populations was missing for 131-195 events.
The number of events at which persons were at risk of exposure was determined primarily using GIS. There were 6,082 (70.0%) events with persons living within 1/4 mile of the event; 7,050 (81.2%) events with persons living within 1/2 mile; and 7,866 (90.5%) events with persons living within 1 mile. Information on the number of people living within 1/4, 1/2, and 1 mile of the event was missing for 421, 420, and 411 events, respectively.
*Firefighter turnout gear is protective clothing usually warn by firefighters during structural firefighting operations and is similar to Level "D" protection. The Occupational Safety and Health Administration defines Level "D" protection as coveralls, boots/shoes (chemical-resistant leather, steel toe and shank), safety glasses or chemical splash goggles, and hard hats. Level "D" provides limited protection against chemical hazards.
Evacuations were ordered in 531 (5.9%) of 9,009 events where evacuation status was reported. Of these evacuations, 72.1% were of buildings or affected parts of buildings; 14.7% were of defined circular areas surrounding the event locations; 5.5% were of areas downwind or downstream of the event; and the remainder were of circular and downwind or downstream areas, of no criteria, or not known. The number of people evacuated was known for 461 (86.8%) events and ranged from 1 to 3,300 people, with a median of 15 people. However, 3 ordered evacuations were reported as having no evacuees. The median length of evacuation was 2 hours (range: 12 minutes to 7 days). Evacuation length was missing for 31 (5.8%) events. Of all 9,105 events, 1,827 (20.0%) had access to the area restricted. Fifty-eight events had in-place sheltering ordered by an official.
Of the 1,566 (85.3%) victims for whom decontamination status was known, 1,316 (84.0%) were not decontaminated, 128 (8.2%) were decontaminated
at the scene, 85 (5.4%) were decontaminated at a medical facility, and 37 (2.4%) were decontaminated at both the scene and a medical facility.
In events where uninjured persons were decontaminated, the median number of
uninjured decontaminated individuals was 4 persons per event (range: 1?56
persons). Decontamination at a medical facility was done for 8 uninjured
employees, 27 uninjured responders, 73 uninjured members of the general public,
and 28 uninjured students. Decontamination at the scene was done for 157
uninjured employees, 815 uninjured responders, 77 uninjured members of the
general public, and 4 uninjured students.
Of the 7,929 (87.1%) events with information on who responded to the event, 19.8% reported 2 or more categories of personnel who responded, 9.9% reported 3 or more categories, and 5.7% reported 4 or more categories.. The response team of the company where the release occurred (74.9%) responded most frequently to events, followed by fire departments (17.7%), law enforcement agencies (16.0%), and certified HazMat teams (11.5%) (Table 8).
Table 8 - Distribution of personnel who responded to the event
| Responder category | No. | %* |
| Certified HazMat team | 908 | 11.5 |
| Department of works/ utilities/ transportation | 75 | 0.9 |
| Emergency medical technicians | 464 | 5.9 |
| Environmental agency | 599 | 7.6 |
| EPA† response team | 19 | 0.2 |
| Fire department | 1,405 | 17.7 |
| Health department/health agency | 141 | 1.8 |
| Hospital personnel | 20 | 0.3 |
| Law enforcement agency | 1,272 | 16.0 |
| Other | 135 | 1.7 |
| Response team of company where release occurred | 5,940 | 74.9 |
| Specialized multi-agency team | 73 | 0.9 |
|
State, county, or local emergency managers/coordinators/planning
committees |
92 | 1.2 |
*Percentages total greater than 100% because multiple responder categories could be reported per event.
†Environmental Protection Agency.
During 1993-2003, the largest proportion of events occurred in fixed facilities (Table 9). However, the number of reported transportation-related events has increased in recent years. The increase is partially due to the 1999 addition of the U.S. Department of Transportation's Hazardous Materials Information System as a primary notification source for transportation events. In addition, the total number of events continued to increase. The increase in the number of events may have been due, at least in part, to the expansion of reporting sources.
Table 9 ─ Cumulative data by year—1993-2003*
| YEAR | NO. OF STATES | TYPE OF EVENT | NO. OF
SUB- STANCES RELEASED |
NO. OF DEATHS | NO. OF VICTIMS | EVENTS WITH
VICTIMS
# (%)* | |||
| FIXED FACILITY | TRANSPORTATION | TOTAL | |||||||
| 1993 |
11 |
3,199 |
2,230 |
16 |
634 |
4,361 |
3,833 |
464 |
12.1 |
| 1994 |
12 |
3,321 |
2,181 |
21 |
912 |
5,072 |
4,233 |
414 |
9.8 |
| 1995 |
14 |
4,273 |
1,688 |
14 |
1,037 |
6,027 |
5,310 |
402 |
7.6 |
| 1996 |
14 |
4,327 |
1,622 |
33 |
1,159 |
5,861 |
5,486 |
390 |
7.1 |
| 1997 |
13 |
4,385 |
1,896 |
28 |
1,128 |
6,089 |
5,513 |
372 |
6.7 |
| 1998 |
13 |
4,729 |
1,533 |
36 |
1,252 |
6,486 |
5,981 |
405 |
6.8 |
| 1999 |
13 |
4,634 |
1,912 |
30 |
1,626 |
6,974 |
6,260 |
504 |
8.0 |
| 2000 |
15 |
5,499 |
2,513 |
44 |
2,049 |
8,342 |
7,548 |
752 |
10.0 |
| 2001 |
16 |
6,736 |
2,168 |
22 |
2,242 |
11,764 |
8,978 |
710 |
7.9 |
| 2002 |
15 |
6,493 |
2,150 |
47 |
2,520 |
11,009 |
9,013‡ |
739 |
8.2 |
| 2003 |
15 |
6,782 |
1,835 |
51 |
2,323 |
12,018 |
9,105 |
720 |
7.9 |
| TOTAL |
54,378 |
16,882 |
71,260‡ |
84,003 |
21,728 |
342 |
5872 |
8.2 |
|
* Numbers in the table may differ from those reported in previous years because of adjustments in HSEES qualification requirements for events.
† Percentage of events with victims.
‡The total number of events does not include one event occurring in 2002 because the type of event was not known.
The number of substances released has also increased. The percentage of events with victims was highest in 1993 (12.1%) and lowest in 1997 (6.7%). With the exception of 2000, the average percentage of events with victims during 1999-2003 was 8.0%, which is similar to the percentage of events with victims during the total time period 1993-2003.
Respiratory irritation has consistently been the most frequently reported injury. Employees continue to be the most commonly reported victims of acute chemical releases. However, members of the general public constitute a large proportion of he victims as well (Figure 7). The number of injured responders has increased recently, and this increase likely results from police officers who are injured when responding to events involving the manufacture of methamphetamine.
The number of deaths associated with acute hazardous substances events has increased in recent years. Many of these deaths were attributed to nonchemical circumstances surrounding the events (e.g., a crash resulting from high-speed travel of a truck pulling an ammonia tank).
ATSDR has created a public-use HSEES dataset. This dataset will enable public health professionals and other interested parties to perform their own analyses. A data dictionary provides users with detailed instructions for working with the dataset. This dataset is available for download from the ATSDR Web site. The data contained in the file are related to events that occurred in the 17 participating HSEES states from 1996 to 2001 (Table 10). The public use dataset contains 39,764 records and 71 variables. More information about the public use dataset can be accessed at http://www.atsdr.cdc.gov/HS/HSEES.
Table 10 - Time period each state participated in Hazardous Substances Emergency Events Surveillance, 1993–2003
| State | Years Participated |
| Alabama | 1993–2003 |
| Colorado | 1993–2003 |
| Iowa | 1993–2003 |
| Louisiana | 2001–2003 |
| Minnesota | 1995–2003 |
| Mississippi | 1995–2003 |
| Missouri | 1994–2003 |
| New Hampshire | 1993–1996 |
| New Jersey | 2000–2003 |
| New York | 1993–2003 |
| North Carolina | 1993–2003 |
| Oregon | 1993–2003 |
| Rhode Island | 1993–2003 |
| Texas | 1993–2003 |
| Utah | 2000–2003 |
| Washington | 1993–2003 |
| Wisconsin | 1993–2003 |
During 2003, the state HSEES coordinators performed various prevention activities. These activities included:
During 2003, ATSDR continued to respond to requests for HSEES information from local, state, and federal agencies and organizations. HSEES data have been analyzed for articles published in peer-reviewed journals (Appendix B) and for presentations in international, national, and state conferences. In 2003, ATSDR presented HSEES data at several conferences, including the Medical and Biological Aspects of Chemical Weapons Stockpile Demilitarization symposium in Volgograd, Russia; the American Public Health Association (APHA) annual meeting in San Francisco; the American Occupational Health Conference (AOHC) in Atlanta; the ATSDR Partners Meeting in Atlanta; the Sixth National Environmental Public Health Conference in Atlanta, GA; and a Comprehensive HazMat Emergency Response Capability Assessment Program (CHERCap) meeting in Boston. The ATSDR HSEES Internet Web site page is available at http://www.atsdr.cdc.gov/HS/HSEES/. At this site, annual reports and other information can be downloaded. Internet links to other relevant Web sites and a public use dataset are also available.
Current HSEES-related activities include collaborations with other agencies and organizations that are involved with response to chemical terrorism, emergency response, hazardous substances, and public health (e.g., the U.S. Environmental Protection Agency). HSEES is also collaborating with international partners to pilot test the system in India and Poland. In India, HSEES is partnering with the National Institute of Occupational Health (NIOH) and in Poland, HSEES is partnering with the Nofer Institute for Occupational Health.
An important contribution of HSEES data is that it helps build capacity within each participating state health department to target prevention activities related to acute spills and their associated public health consequences. In 2003, target audiences included school personnel, first responders, industry, local health departments, occupational health and safety professionals, health care providers, and the general public. Activities are conducted by state HSEES coordinators, often in collaboration with other local and state agencies. The activities are evaluated to measure their effectiveness.
1. Centers for Disease Control and Prevention. Comprehensive plan for epidemiologic surveillance. Atlanta: US Department of Health and Human Services; 1986.
2. Binder S. Death, injuries, and evacuations from acute hazardous materials releases. Am J Public Health 1989;70:1042-4.
|
Substance |
No. Events | |
| 1 | Ammonia | 569 |
| 2 | Sulfur dioxide | 537 |
| 3 | Carbon monoxide | 452 |
| 4 | Nitrogen oxide (NOX) | 365 |
| 5 | Hydrochloric acid | 342 |
| 6 | Sodium hydroxide | 250 |
| 7 | Sulfuric acid | 238 |
| 8 | Volatile organic compounds NOS* | 229 |
| 9 | Mercury | 199 |
| 10 | Nitric oxide | 196 |
| 11 | Methamphetamine chemicals NOS* | 169 |
| 12 | Paint NOS* | 159 |
| 13 | Oxides of nitrogen NOS* | 154 |
| 14 | Chlorine | 130 |
| 15 | Acetone | 124 |
| 16 | Benzene | 118 |
| 17 | Ethylene glycol | 112 |
| 18 | Solvent NOS* | 101 |
| 19 | Hydrogen sulfide | 98 |
| 20 | Methyl alcohol | 91 |
| 21 | Ethyl alcohol | 85 |
| 22 | Polychlorinated biphenyls | 81 |
| 23 | Resin NOS* | 79 |
| 24 | Corrosive NOS* | 78 |
| 25 | Toluene | 78 |
| 26 | Lithium | 77 |
| 27 | Acid NOS* | 73 |
| 28 | Flammable liquid NOS* | 72 |
| 29 | Adhesive NOS* | 70 |
| 30 | Phosphoric acid | 70 |
| 31 | Nitrogen dioxide | 69 |
| 32 | Mix: carbon monoxide/hydrogen sulfide/nitrogen oxide (NOX)/sulfur dioxide | 68 |
| 33 | Phosphorus | 67 |
| 34 | Xylene | 67 |
| 35 | Hydrogen peroxide | 65 |
| 36 | Iodine | 65 |
| 37 | Ethylene | 63 |
| 38 | Potassium hydroxide | 63 |
| 39 | Paint or coating NOS* | 61 |
| 40 | Mix: carbon monoxide/hydrogen sulfide/oxides of nitrogen NOS*/sulfur dioxide | 61 |
| 41 | Isopropyl alcohol | 59 |
| 42 | Nitrous oxide | 58 |
| 43 | Sodium hypochlorite | 57 |
| 44 | Vinyl chloride | 57 |
| 45 | Butadiene | 54 |
| 46 | Fluorocarbon | 50 |
| 47 | Ethyl ether | 45 |
| 48 | Freon | 45 |
| 49 | Alcohol NOS* | 41 |
| 50 | Pesticide NOS* | 39 |
| 51 |
Mix: carbon monoxide/oxides of nitrogen NOS*/sulfur dioxide/volatile organic compounds NOS* |
39 |
| 52 | Propane | 38 |
| 53 | Mix: carbon monoxide/nitrogen oxide (NOX)/propylene | 38 |
| 54 | Asbestos | 36 |
| 55 | Diesel fuel | 36 |
| 56 | Hydraulic oil | 32 |
| 57 | Hydraulic fluid | 31 |
| 58 | Propylene | 31 |
| 59 | Ether NOS* | 30 |
| 60 | Methyl ethyl ketone | 30 |
| 61 | Antifreeze | 29 |
| 62 | Battery acid | 29 |
| 63 | Coleman fuel | 29 |
| 64 | Ink NOS* | 29 |
| 65 | Nitric acid | 28 |
| 66 | Ethylene oxide | 27 |
| 67 | Methylene chloride | 27 |
| 68 | Fertilizer NOS* | 26 |
| 69 | Mix: acetylene/carbon monoxide/hydrogen sulfide/of nitrogen NOS* | 26 |
| 70 | Mix: carbon monoxide/nitrogen oxide (NOX) | 26 |
| 71 | Mix: carbon monoxide/oxides of nitrogen NOS*/volatile organic compounds NOS* | 25 |
| 72 | Acetic acid | 24 |
| 73 | Ammonium nitrate | 24 |
| 74 | Mix: carbon monoxide/oxides of nitrogen NOS* | 24 |
| 75 | Ethylene dichloride | 23 |
| 76 | Heptane | 23 |
| 77 |
Mix: carbon monoxide/nitrogen oxide (NOX)/volatile organic compounds NOS* |
22 |
| 78 |
Mix: carbon monoxide/nitrogen oxide (NOX)/sulfur dioxide/volatile organic compounds NOS* |
22 |
| 79 | Chloroform | 21 |
| 80 | Calcium oxide | 20 |
| 81 | EPA f039: multi-code treatment, storage, or disposal leachate | 20 |
| 82 | Latex paint | 20 |
| 83 | Paint thinner NOS* | 20 |
| 84 | Mix: hydrogen sulfide/sulfur dioxide | 20 |
| 85 | Formaldehyde | 19 |
| 86 | Naphtha | 19 |
| 87 | Sodium hydroxide NOS* | 19 |
| 88 | Mix: carbon monoxide/ethylene/nitrogen oxide (NOX) | 19 |
| 89 | 3M light water AFFF | 18 |
| 90 | Ammonium hydroxide NOS* | 18 |
| 91 | Cleaning agent NOS* | 18 |
| 92 | Ephedrine | 18 |
| 93 | Bleach | 17 |
| 94 | Corrosive liquid acidic inorganic NOS* | 17 |
| 95 | Nitrogen fertilizer | 17 |
| 96 | Sodium chloride | 17 |
| 97 | Sulfuric acid NOS* | 17 |
| 98 | Base NOS* | 16 |
| 99 | Caustic NOS* | 16 |
| 100 | Chlorpyrifos | 16 |
| 101 | Coal tar creosote | 16 |
| 102 | Tetrachlorcethylene | 16 |
*NOS = not otherwise specified.
Publications reference list
2005
Ernst KP, Wattigney WA, Kaye WE. Releases from improper chemical mixing, Hazardous Substances Emergency Events Surveillance system, 1996-2001. J Occup Environ Med 2005; 47:287-93.
Centers for Disease Control and Prevention (CDC). Public health consequences from hazardous substances acutely released during rail transit-South Carolina, 2005; selected states, 1999-2004. MMWR 2005;53:64-7.
2004
Berkowitz Z, Horton DK, Kaye WE. Hazardous substances releases causing fatalities and/or people transported to hospitals: rural/agricultural vs. other areas. Prehospital Disaster Med 2004;19(3):213-20.
Centers for Disease Control and Prevention (CDC). Brief report: exposure to tear gas from a theft-deterrent device on a safe-Wisconsin, December 2003. MMWR 2004;53:176-7.
Horton DK, Berkowitz Z, Kaye WE. Hydrofluoric acid releases in 17 states and the acute health effects associated, 1993-2001. J Occup Environ Med 2004;46:501-8.
Centers for Disease Control and Prevention (CDC). Brief report: Injuries associated with homemade fireworks-selected states, 1993-2004. MMWR. 2004;53(25):562-3.
Horton DK, Berkowitz Z, Kaye WE. Surveillance of hazardous materials events in 17 states, 1993-2001: a report from the Hazardous Substances Emergency Events Surveillance (HSEES) system. Am J Ind Med 2004;45:539-48.
Centers for Disease Control and Prevention (CDC). Carbon monoxide releases and poisonings attributed to underground utility cable fires-New York, January 2000-December 2003. MMWR 2004;53:920-2.
Ruckart PZ, Borders J, Villanacci J, Harris R, Samples-Ruiz M. The role of adverse weather conditions in acute releases of hazardous substances, Texas, 2000-2001. J Hazard Mater 2004;115:27-31.
Ruckart PZ, Wattigney W, Kaye WE. Risk factors for acute chemical releases with public health consequences: Hazardous Substances Emergency Events Surveillance in the U.S., 1996-2001. Environ Health 2004;3(1):10.
Ruckart PZ, Orr MF, Kaye WE. Hazardous chemical releases in the home. J Environ Health 2004;67(5):14-9.v
2003
Berkowitz Z, Barnhart HX, Kaye WE. Factors associated with severity of injury resulting from acute releases of hazardous substances in the manufacturing industry. J Occup Environ Med 2003;45:734-42.
Centers for Disease Control and Prevention (CDC). Homemade chemical bomb events and resulting injuries-selected states, January 1996-March 2003. MMWR 2003;52:662-4.
Horton DK, Berkowitz Z, Kaye WE. The acute consequences to children exposed to hazardous substances used in illicit methamphetamine production, 1996 to 2001. J Child Health 2003;1:99-108.
Horton DK, Berkowitz Z, Kaye WE. Secondary contamination of ED personnel from hazardous materials events, 1995-2001. Am J Emerg Med 2003;21:199-204.
Horton DK, Berkowitz Z, Haugh GS, Orr MF, Kaye WE. Acute public health consequences associated with hazardous substances released during transit, 1993-2000. J Hazard Mater 2003;B98:161-75.
Manassaram DM, Orr MF, Kaye WE. Hazardous substances events associated with the manufacturing of chemicals and allied products. J Hazard Mater 2003;104:123-35.
Manassaram DM, Orr MF, Kaye WE. Counterterrorism planning using the hazardous substances events surveillance system. Disaster Manag Response 2003;1:35-40.
Weisskopf MG, Drew JM, Hanrahan LP, Anderson HA, Haugh GS. Hazardous ammonia releases: public health consequences and risk factors for evacuation and injury, United States, 1993-1998. J Occup Environ Med 2003;45(2):197-204.
2002
Berkowitz Z, Haugh GS, Orr MF, Kaye WE. Releases of hazardous substances in schools: data from Hazardous Substances Emergency Events Surveillance system, 1993-1998. J Environ Health 2002;65:20-7.
Berkowitz Z, Orr MF, Kaye WE, Haugh GS. Adverse public health effects associated with releases of hazardous substances in the agricultural industry and related services in four mid-Western states. J Occup Environ Med 2002;44:714-23.v
Horton DK, Berkowitz Z, Kaye WE. The public health consequences from acute chlorine releases, 1993-2000. J Occup Environ Med 2002;44:906-13.
Zeitz P, Orr MF, Kaye WE. Public health consequences of mercury spills: Hazardous Substances Emergency Events Surveillance System: 1993-1998. Environ Health Perspect 2002;110:129-32.
2001
Burgess JL, Kovalchick DF, Harter L, Kyes KB, Lymp JF, Brodkin CA. Hazardous materials events: evaluation of transport to health care facility and evacuation decisions. Am J Emerg Med 2001;19:99-105. Orr MF, Kaye WE, Zeitz P, Powers ME, Rosenthal L. Public health risks of railroad hazardous substance emergency events. J Occup Environ Med 2001;43:94-100. Orr MF, Haugh GS, Kaye WE. Hazardous Substances Emergency Events Surveillance (HSEES), 1993 to 1997. Chemical Health and Safety 2001;35-41. Welles WL, Wilburn RE. Hazardous Substances Emergency Events Surveillance (HSEES) in New York State, 1993 to 1997. Chemical Health and Safety 2001;42-52.2000
Burgess JL, Kovalchick DF, Harter L, Kyes KB, Thompson JN. Hazardous materials events: an industrial comparison. J Occup Environ Med 2000;42:546-53.
Centers for Disease Control and Prevention (CDC). Public health consequences among first responders to emergency events associated with illicit methamphetamine laboratories-selected states, 1996-1999. MMWR 2000;49:1021-4.
Souther L, Small-Johnson J, Messing RB. A description of agricultural releases of anhydrous ammonia in Minnesota. Chemical Health and Safety 2000;16-22.
Weisskopf MG, Drew JM, Hanrahan LP, Anderson HA. Hazardous ammonia releases in Wisconsin: trends and risk factors for evacuation and injury. Wisc Med J 2000;30-46.
Zeitz P, Berkowitz Z, Orr MF, Haugh GS, Kaye WE. Frequency and type of injuries in responders of hazardous substances emergency events, 1996 to 1998. J Occup Environ Med 2000;42:1115-20.
1996
Hall HI, Dhara VR, Kaye WE, Price-Green PA. Public health consequences of hazardous substance releases. Toxicol Ind Health 1996;12:289-93.
Hall HI, Haugh GS, Price-Green PA, Dhara VR, Kaye WE. Risk factors for hazardous substance releases that result in injuries and evacuations: data from 9 states. Am J Public Health 1996;86:855-7.
Wendt RD, Hall HI, Price-Green PA, Dhara VR, Kaye WE. Evaluating the sensitivity of hazardous substances emergency events surveillance: a comparison of three surveillance systems. J Environ Health 1996;58:13-7.
1995
Agency for Toxic Substances and Disease Registry. ATSDR update: Hazardous Substances Emergency Events Surveillance (HSEES) system: 1993 data. Health and Environment Digest 1995;8:83-4.
Hall HI, Price-Green PA, Dhara VR, Kaye WE. Health effects related to releases of hazardous substances on the Superfund priority list. Chemosphere 1995;31:2455-61.
1994
Hall HI, Dhara VR, Price-Green PA, Kaye WE. Surveillance for emergency events involving hazardous substances-United States, 1990-1992. MMWR 1994;43(No. SS-2):1-6.
Hall HI, Dhara VR, Kaye WE, Price-Green PA. Surveillance of hazardous substance releases and related health effects. Arch Environ Health 1994;49:45-8.
Other HSEES documents available:
1995 Annual Report [![]() ]
]
1996 Annual Report [HTML] [![]() ]
]
1997 Annual Report [HTML] [
![]() ]
]
1998 Annual Report [HTML] [![]() ]
]
1999-2000 Biennial Report [HTML]
[![]() ]
]
2001 Annual Report [HTML] [![]() ]
]
2002 Annual Report [ HTML] [![]() ]
]
2003 Annual Report [HTML] [ ![]() ]
]
2004 Annual Report [HTML] [ ![]() ]
]
1993 through 1997 Annual Report [HTML] [![]() ]
]
1998 through 2001 Annual Report [HTML ] [![]() ]
]
Agency for Toxic Substances and Disease Registry, 4770 Buford Hwy NE, Atlanta, GA 30341
Tel: (404) 498-0110 / Public Inquiries: (888) 422-8737