Figure 1. Location of the Oak Ridge Reservation
This Web site is provided by the Agency for Toxic Substances and Disease Registry (ATSDR) ONLY as an historical reference for the public health community. It is no longer being maintained and the data it contains may no longer be current and/or accurate.
In 1942, the federal government established the Oak Ridge Reservation (ORR) in Anderson and Roane Counties in Tennessee as part of the Manhattan Project to research, develop, and produce special nuclear materials for nuclear weapons. In 1989, the ORR was added to the U.S. Environmental Protection Agency's (EPA's) National Priorities List because over the years, ORR operations have generated a variety of radioactive and nonradioactive wastes that are present in old waste sites or that have been released to the environment. The U.S. Department of Energy (DOE) is cleaning up the ORR under a Federal Facility Agreement with EPA and the Tennessee Department of Environment and Conservation (TDEC). DOE, EPA, and TDEC are working together to investigate and remediate site-related chemical releases and waste sites from past and present activities at the site.
Since 1992, the Agency for Toxic Substances and Disease Registry (ATSDR) has responded to requests and addressed health concerns of community members, civic organizations, and other government agencies by working extensively to determine whether levels of environmental contamination at and near the ORR present a public health hazard to communities surrounding the ORR. ATSDR has identified and evaluated several public health issues and has worked closely with many parties. ATSDR is the principal federal public health agency charged with evaluating human health effects of exposure to hazardous substances in the environment. Whereas the Tennessee Department of Health (TDOH) conducted the Oak Ridge Health Studies to evaluate whether off-site populations have been exposed in the past, ATSDR's activities have focused on current public health issues related to Superfund cleanup activities at the site.
To expand on the efforts of TDOH, ATSDR scientists conducted a review and a screening analysis of TDOH's Phase I and Phase II screening-level evaluation of past exposure (1944 to 1990) to identify contaminants of concern for further evaluation. Based on this review, ATSDR scientists have completed or are conducting public health assessments (PHAs) on iodine 131 releases from the X-10 site, mercury releases from the Y-12 plant, polychlorinated biphenyls (PCBs), radionuclide releases from White Oak Creek, uranium releases from the Y-12 plant, uranium and fluoride releases from the K-25 site, and other topics such as contaminant releases from the Toxic Substances Control Act (TSCA) Incinerator and contaminated off-site groundwater. In conducting these PHAs, ATSDR scientists evaluate and analyze the information and findings from previous studies and investigations to assess the public health implications of past and current exposure. This PHA documents ATSDR's screening of recent (1990 to 2003)1 environmental data, addresses whether additional chemicals require further evaluation, and discusses the public health implications related to potential exposures. PCBs and mercury, as well as the groundwater pathway, are not addressed in this PHA; these topics are being evaluated individually in separate PHAs.
According to the information reviewed for this PHA, ATSDR concludes that current and future exposures to ORR site-related chemicals (individually or in combination) in soil, sediment, surface water, biota (other than fish), and air do not pose a public health hazard. Very limited "dioxin" data exist for fish; therefore, ATSDR cannot determine whether exposure to dioxins in fish poses a public health hazard. The available data on dioxins in fish are for fish of an unidentified species from a pond near the K-25 site. In the absence of additional data on dioxins in fish near the ORR, ATSDR recommends following the current State of Tennessee fish advisories. Following current fish advisories will reduce exposure to contaminants in fish.
In 1942, the federal government established the Oak Ridge Reservation (ORR) in Anderson and Roane Counties in Tennessee as part of the Manhattan Project to research, develop, and produce special radioactive materials for nuclear weapons (ChemRisk 1993a; TDOH 2000). Four facilities were built at that time. The Y-12 plant, the K-25 site, and the S-50 site were created to enrich uranium. The X-10 site was created to demonstrate processes for producing and separating plutonium (TDOH 2000). The Clinch River forms the southern and western boundaries of the reservation, and most of the property is within the Oak Ridge city limits (EUWG 1998). (See Figure 1 for the location of the ORR.)
When the federal government acquired the ORR in 1942, the reservation consisted of 58,575 acres (91.5 square miles). Since that time, the federal government has transferred 24,340 acres (38.0 square miles) to other parties, such as the city of Oak Ridge and the Tennessee Valley Authority. The U.S. Department of Energy (DOE) continues to control the remaining 34,235 acres (53.5 square miles) (ORNL 2002). Most of the contamination is located at the three main facilities. These areas are heavily guarded and fenced, and access to them requires a clearance badge.
The Y-12 plant was built in 1943 to house equipment for electromagnetically enriching uranium. The atomic bomb that was dropped in Hiroshima, Japan, contained uranium produced at the Y-12 plant (TDOH 2000). In 1952, the Y-12 facilities were converted to fabricate nuclear weapon components (ChemRisk 1999). During the Cold War, a column-exchange process (Colex) that used large quantities of mercury as an extraction solvent to enrich lithium in lithium 6 was built and operated (TDOH 2000). At the end of the Cold War, the Y-12 missions were curtailed. In 1992, the major focus of the Y-12 plant was the remanufacture of nuclear weapon components and the dismantlement and storage of strategic nuclear materials from retired nuclear weapons systems. The Y-12 plant is now known as the Y-12 National Security Complex and is primarily used for disassembling nuclear weapons and for storing highly enriched uranium (TDOH 2000).
The X-10 site (formerly known as the Clinton Laboratories and now part of what is referred to as the Oak Ridge National Laboratory) was built in 1943, as a pilot plant to produce and separate plutonium. The government had intended to operate the facility for only 1 year; however, operations were continued and expanded (ChemRisk 1993a; TDOH 2000). Over time, operations at the X-10 site grew to include non-weapons-related activities, such as nuclear fission product separation, nuclear reactor safety and development, and radionuclide production for worldwide use in the medical, industrial, and research fields. Today, the Oak Ridge National Laboratory receives worldwide recognition as a facility for research and development in several areas of science and technology (ChemRisk 1993a). In addition, the Oak Ridge National Laboratory produces numerous radioactive isotopes that have significant uses in medicine and research (TDEC 2002).
Figure 1. Location of the Oak Ridge Reservation
From 1945 to 1964, the main objective of the K-25 site (formerly known as the Oak Ridge Gaseous Diffusion Plant) was to use gaseous diffusion to enrich weapons-grade uranium (ChemRisk 1999; EPA 2002a). From 1965 to 1985, the site used uranium hexafluoride in the gaseous diffusion process to manufacture commercial-grade uranium (EUWG 1998). All gaseous diffusion operations ceased at the site in 1985 (ChemRisk 1993a; ORHASP 1999). Since the K-25 site was officially closed in 1987, many activities have been conducted to clean up wastes and to restore the environment around the site. Since 1996, reindustrialization has been the focus of the K-25 site, which has been renamed the East Tennessee Technology Park (ORHASP 1999; TDOH 2000). The site also maintains the Toxic Substances and Control Act (TSCA) Incinerator, which is the only facility in the country authorized to incinerate wastes with radioactive and hazardous contaminants that contain polychlorinated biphenyls (PCBs) (TDEC 2002).
Construction of the former S-50 liquid thermal diffusion plant began on June 6, 1944, and operations were underway by October 1944. The purpose of the plant was to assess the financial and scientific feasibility of separating uranium 235 from uranium 238 through liquid thermal diffusion. Because of several equipment malfunctions and contaminant releases to the Clinch River and to the air, the plant operated for less than a year and was closed in September 1945 (ChemRisk 1999). Because all of the facility's buildings were destroyed and buried in 1946, there are no physical remains of the S-50 site (ChemRisk 1999; TDEC 2002).
II.C. Remedial and Regulatory History
The Federal Facility Agreement, which was implemented on January 1, 1992, is a legally binding agreement that established timetables, procedures, and documentation for remedial actions at the ORR. The Federal Facility Agreement is available online at http://www.bechteljacobs.com/ettp_ffa.shtml |
Because ORR operations have generated a variety of radioactive and chemical wastes, the ORR was added to U.S. Environmental Protection Agency's (EPA's) National Priorities List (NPL) in 1989 (EPA 2002b). DOE is conducting cleanup activities at the ORR under a Federal Facility Agreement, which is an interagency agreement with EPA and the Tennessee Department of Environment and Conservation (TDEC). This agreement allows for input from the public. These parties are working together to investigate and remediate hazardous waste from past and present activities at the site. DOE is integrating required measures from the Resource Conservation and Recovery Act (RCRA) with response actions under the Comprehensive Environmental Response, Compensation, and Liability Act (CERCLA).
Contaminants such as uranium and mercury are present in old waste sites, which occupy 5 to 10 percent of the ORR. The abundant rainfall (an annual average of 55 inches) and high water tables (for example, 0 to 20 feet below ground surface) on the reservation contribute to leaching of these contaminants, resulting in contaminated soil, surface water, sediments, and groundwater (EUWG 1998).
Since 1986 (when initial cleanup activities commenced), DOE has initiated approximately 50 response actions under the Federal Facility Agreement that address contamination and disposal issues on the reservation. To consolidate investigation and remediation of environmental contamination, the contaminated areas were divided into five large tracts of land, generally associated with the major hydrologic watersheds (EUWG 1998). The annual Remediation Effectiveness Reports for the U.S. Department of Energy Oak Ridge Reservation documents the progress of ongoing remedial actions and future planned actions at the site (e.g., SAIC 2004). The Remediation Effectiveness Reports are available at the DOE Information Center.
II.D. Land Use and Natural Resources
The ORR currently occupies a little over 34,000 acres. The three major DOE installations—the East Tennessee Technology Park (formerly the K-25 site and the Oak Ridge Gaseous Diffusion Plant), the Oak Ridge National Laboratory (formerly the X-10 site), and the Y-12 National Security Complex (formerly the Y-12 plant)—occupy about 30 percent of that acreage. The remaining 70 percent was established as a National Environmental Research Park in 1980, to provide protected land for environmental science research and education, and to demonstrate that energy technology development can coexist with a quality environment. Large portions of the reservation have grown into full forests over the past several decades. Some of this land includes areas known as "deep forest" that contain ecologically significant flora and fauna; portions of the ORR are considered to be biologically rich (SAIC 2002).
The ORR also includes an area set aside for residential, commercial, and support services. The city of Oak Ridge, created in 1942 to provide housing to the employees of the ORR, was originally controlled by the military (Friday and Turner 2001). The self-governing portion of the city of Oak Ridge comprises about 14,000 acres and contains housing, schools, parks, shops, offices, and industrial areas. The urban population of Oak Ridge continued to grow over several decades, and some residential properties are next to the ORR boundary line. Outside the urban areas, much of the region (about 40 percent) is still a pattern of farms and small communities, as it was historically (ChemRisk 1993b).
A number of maps of this area indicate a wide range of land types (including urban or built-up land, agricultural land, rangeland, forestland, water, and wetlands) and land uses (including residential, commercial, public and semi-public, industrial, transportation, communication, utility, and extractive [e.g., mining]) (ChemRisk 1993b).
Agriculture (beef and dairy cattle) and forestry had been the two predominant land uses in the area around the ORR; however, both of these uses are currently declining. For many years, milk was produced, bottled, and distributed locally. Corn, tobacco, wheat, and soybeans were the major crops grown in the area. Small game and waterfowl are hunted in the area (both on and off the ORR), and deer are hunted during certain periods (ChemRisk 1993b). Radiological monitoring is performed during the annual deer hunts to "provide assurance that harvested animals do not contain levels of radionuclides which would result in significant internal exposure to humans consuming meat from the animals" (Teasley 1995). Fishing is not permitted on site, but fish from the ORR can move into publicly accessed areas.
Demographic data provide information on the size and characteristics of a given population. ATSDR examined demographic data to determine the number of people living in the vicinity of the ORR and to determine the presence of sensitive populations, such as children (age 6 years and younger), women of childbearing age (age 15 to 44 years), and the elderly (age 65 years and older). According to the 2000 U.S. Census, 153 children, 403 women of childbearing age, and 423 elderly persons live within a quarter mile of the ORR; 778 children, 1,935 women of childbearing age, and 1,681 elderly persons live within a mile of the ORR (see Figure 2).
Demographics also provide details on population mobility and residential history in a particular area. This information helps ATSDR evaluate how long residents might have been exposed to environmental contaminants. The numbers of people living in the counties surrounding the ORR from 1940 to 2000 are listed in Table 1. The numbers of people living in the main cities within these counties from 1940 to 2000 are listed in Table 2.
Table 1. Population of Counties Surrounding the ORR from 1940 to 2000
County |
1940 |
1950 |
1960 |
1970 |
1980 |
1990 |
2000 |
|---|---|---|---|---|---|---|---|
Anderson County |
26,504 |
59,407 |
60,032 |
60,300 |
67,346 |
68,250 |
71,330 |
Blount County |
41,116 |
54,691 |
57,525 |
63,744 |
77,770 |
85,969 |
105,823 |
Knox County |
178,468 |
223,007 |
250,523 |
276,293 |
319,694 |
335,749 |
382,032 |
Loudon County |
19,838 |
23,182 |
23,757 |
24,266 |
28,553 |
31,255 |
39,086 |
Meigs County |
6,393 |
6,080 |
5,160 |
5,219 |
7,431 |
8,033 |
11,086 |
Morgan County |
15,242 |
15,727 |
14,304 |
13,619 |
16,604 |
17,300 |
19,757 |
Rhea County |
16,353 |
16,041 |
15,863 |
17,202 |
24,235 |
24,344 |
28,400 |
Roane County |
27,795 |
31,665 |
39,133 |
38,881 |
48,425 |
47,227 |
51,910 |
Sources: Bureau of the Census 1900–1990, 2000
Table 2. Population of Cities Surrounding the ORR from 1940 to 2000
|
1940 |
1950 |
1960 |
1970 |
1980 |
1990 |
2000 |
|---|---|---|---|---|---|---|---|
Clinton |
2,761 |
3,712 |
4,943 |
4,794 |
7,790 |
8,972 |
9,409 |
Harriman |
5,620 |
6,389 |
5,931 |
8,734 |
8,303 |
7,119 |
6,744 |
Kingston |
880 |
1,627 |
2,010 |
4,142 |
4,561 |
4,552 |
5,264 |
Knoxville |
111,580 |
124,769 |
111,827 |
174,587 |
175,045 |
165,121 |
173,890 |
Lenoir City |
4,373 |
5,159 |
4,979 |
5,324 |
5,505 |
6,147 |
6,819 |
Loudon |
3,017 |
3,567 |
3,812 |
3,728 |
4,199 |
4,026 |
4,476 |
Maryville |
5,609 |
7,742 |
10,348 |
13,808 |
17,480 |
19,208 |
23,120 |
Oak Ridge |
3,000* |
30,229 |
27,169 |
28,319 |
27,662 |
27,310 |
27,387 |
Oliver Springs |
— |
189 |
1,163 |
3,405 |
3,659 |
3,433 |
3,303 |
Rockwood |
3,981 |
4,272 |
5,345 |
5,259 |
5,695 |
5,348 |
5,774 |
Spring City |
1,569 |
1,725 |
1,800 |
1,756 |
1,951 |
2,199 |
2,025 |
Sources: Bureau of the Census 1940, 1950, 1960, 1970, 1980, 1990, 2000; ChemRisk 1993b; City of Oak Ridge 1989; Convention and Visitors Bureau 2003
* Combined population on land that was established as Oak Ridge in 1942, with 13,000 initial residents.
Figure 2. Demographics Within a 5-Mile Radius of the ORR
By presenting decade-by-decade size comparison for the available census intervals, Table 2 understates the city of Oak Ridge's dramatic population growth in contrast with the growth of its neighbors. Oak Ridge was established for the 13,000 people expected to work at the ORR (Friday and Turner 2001); by July 1944, its population had increased to 50,000. The population peaked at 75,000 in 1945, but decreased to 30,229 by 1950, and then to 27,169 by 1960; however, it was relatively stable thereafter (see Table 2) (City of Oak Ridge 1989). In 1959, about 14,000 acres within the city of Oak Ridge became self-governing (ChemRisk 1993b). Almost since its establishment, the city of Oak Ridge has been one of the largest population centers in eastern Tennessee (ChemRisk 1993b).
II.F. Public Health Activities
Since 1992, ATSDR has addressed the health concerns of community members, civic organizations, and other government agencies by working extensively to determine whether levels of environmental contamination at and near the ORR present a public health hazard. During this time, ATSDR has identified and evaluated several public health issues and has worked closely with many parties, including community members, civic organizations, physicians, and several federal, state, and local environmental and health agencies. Since the Tennessee Department of Health (TDOH) conducted the Oak Ridge Health Studies to evaluate whether off-site populations experienced exposures in the past, ATSDR's activities have focused on current and future public health issues. The ATSDR ORR Web site (http://www.atsdr.cdc.gov/HAC/oakridge/phact/index.html) highlights the major public health activities conducted by ATSDR at the ORR.
Oak Ridge Reservation Health Effects Subcommittee (ORRHES). The ORRHES was established in 1999, by ATSDR and the Centers for Disease Control and Prevention (CDC) under the authority of the Federal Advisory Committee Act, and as a subcommittee of the U.S. Department of Health and Human Services' Citizens Advisory Committee on Public Health Service Activities and Research at DOE sites. The subcommittee consisted of people who represented diverse interests, expertise, backgrounds, and communities, as well as liaison members from federal and state agencies. It was created to provide a forum for communication and collaboration between the citizens and the agencies that are evaluating public health issues and conducting public health activities at the ORR. To help ensure citizen participation, the meetings of the subcommittee's work groups were open to the public and everyone could attend and present their ideas and opinions. The subcommittee performed the following functions:
The ORRHES created various work groups to conduct in-depth exploration of specific issues and present findings to the subcommittee for deliberation. Work group meetings were also open to all who wished to attend and participate.
ATSDR Field Office. From 2001 to 2005, ATSDR maintained a field office in the city of Oak Ridge. The office was opened to promote collaboration between ATSDR and the communities surrounding the ORR by providing community members with opportunities to become involved in ATSDR's public health activities at the ORR.
Other Public Health Activities. ATSDR, CDC's National Center for Environmental Health and National Institute for Occupational Safety and Health, TDOH, TDEC, and DOE have responded over the years to workers and communities concerned about potential exposures and reported unexplained illnesses afflicting workers and residents. The Compendium of Public Health Activities (ATSDR et al. 2000) outlines the past and present strategies used to address and evaluate public health issues related to chemical and radioactive substances released from the ORR. The compendium can be found on the ATSDR ORR Web site at http://www.atsdr.cdc.gov/HAC/oakridge/phact/c_toc.html.
Where Can One Obtain More Information on ATSDR's Activities at the ORR?
ATSDR has conducted several analyses that are not documented here, as have other agencies that have been involved with this site. Community members can find more information on ATSDR's past activities in the following three ways:
II.G. Past Screening Evaluation
In 2001, ATSDR scientists reviewed and analyzed TDOH's Oak Ridge Health Studies to identify contaminants that required further public health evaluation. One major aspect of the Health Studies was a pair of screening evaluations, called the Phase I and Phase II screening evaluations. During the Phase I and Phase II screening evaluations, TDOH conducted extensive reviews of available information and conducted qualitative and quantitative analyses of past (1944 to 1990) releases and off-site exposures to hazardous substances from the entire ORR (see Figure 3).
TDOH conducted the Oak Ridge Health Studies to evaluate whether off-site populations have been exposed in the past. Task 7 of the Oak Ridge Dose Reconstruction was a screening-level evaluation of potential chemicals of concern, using data through 1990. This public health assessment documents ATSDR's screening of environmental data from 1990 to 2003, and addresses whether additional chemicals (not identified by Task 7) require further evaluation. |
On the basis of ATSDR's review and analysis of TDOH's Phase I and Phase II screening evaluations, ATSDR scientists have completed or are conducting public health assessments on Y-12 plant uranium releases; K-25 site uranium and fluoride releases; White Oak Creek radionuclide releases; Y-12 plant mercury releases; X-10 site iodine 131 releases; X-10 site, Y-12 plant, and K-25 site PCB releases; and other issues of community concern, such as contaminant releases from the TSCA Incinerator and contaminated off-site groundwater. The public health assessment is the primary public health process ATSDR is using to further evaluate these contaminants.
This public health assessment documents ATSDR's screening of recent (1990 to 2003)2 environmental data to address whether additional chemicals require further evaluation and discusses the public health implications related to estimated exposure doses.
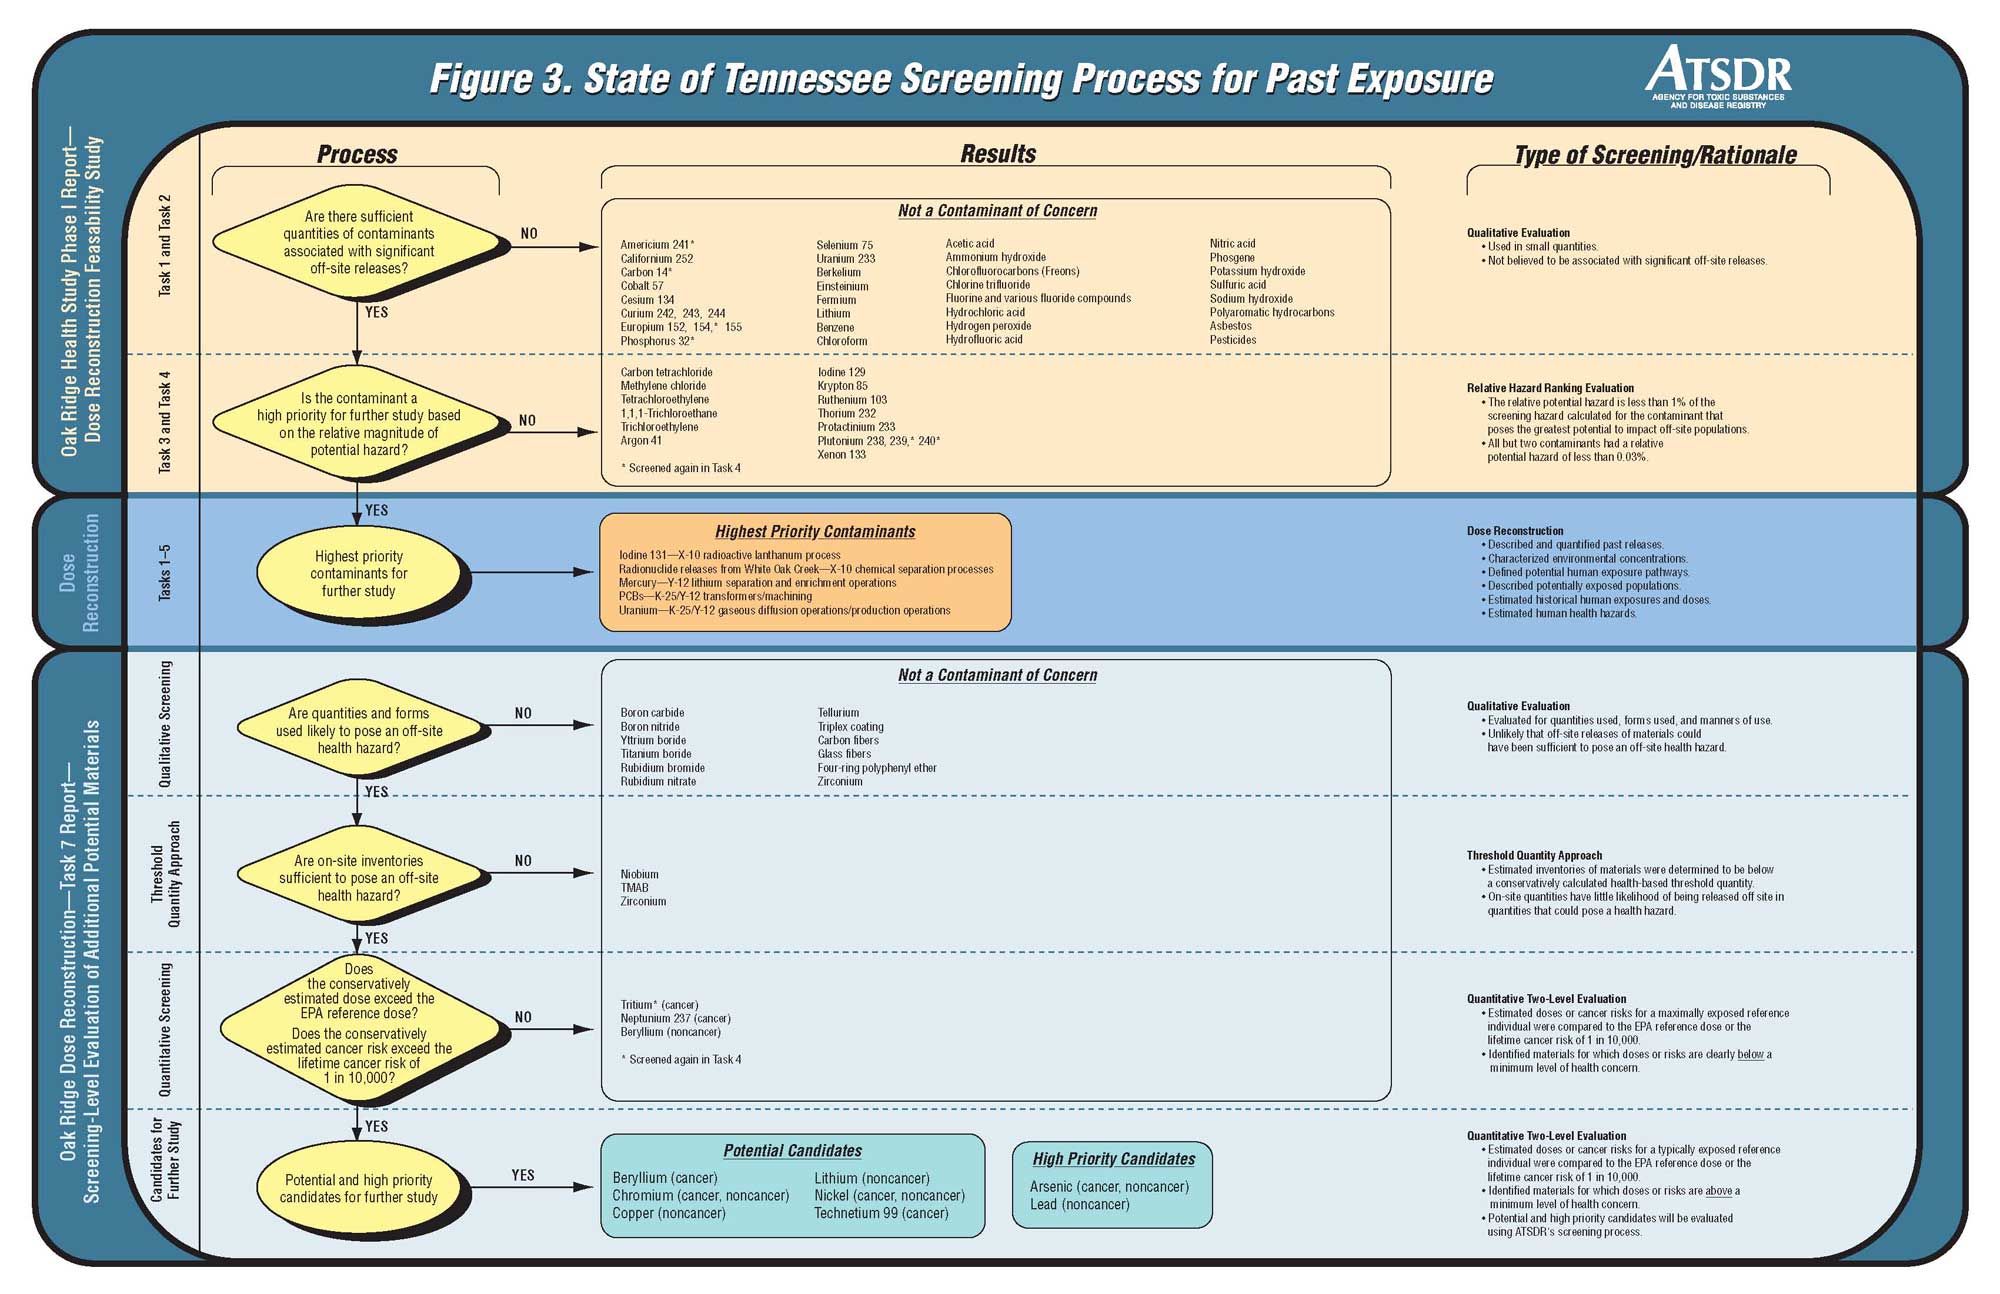
Figure 3. State of Tennessee Screening Process for Past Exposure
A completed exposure pathway has five elements: (1) a source of contamination, (2) an environmental medium (such as soil, water, or air) through which a chemical is transported, (3) a point of exposure, (4) a route of exposure, and (5) an exposed population (receptor population). The source is the place where the chemical was released. The environmental media transport the chemicals. The point of exposure is the place where persons come in contact with the media. The route of exposure (for example, ingestion, inhalation, or dermal contact) is the way the contaminant enters the body. The people exposed are called the receptor population. A potential exposure pathway exists when one or more of the elements is missing, but available information suggests that exposure is possible. |
Chemicals released into the environment have the potential to cause harmful health effects, but a release does not always result in exposure. If no one comes in contact with a chemical—if there is no completed exposure pathway—then exposure does not occur, and thus adverse health effects do not result. Often the general public does not have access to the source area of contamination or areas where contaminants are moving through the environment. Understanding how people have access to these areas becomes important in determining whether people could come in contact with the contaminants.
The route a chemical takes from its source (where it began) to its exposure point (where it ends), and how people can contact it (how people get exposed) is called the exposure pathway. An exposure pathway could involve air, surface water, groundwater, soil, sediment, or even plants and animals. Exposure can occur by breathing, eating, drinking, or by skin contact with a substance containing the chemical contaminant.
How Does ATSDR Determine Which Exposure Situations to Evaluate?
ATSDR scientists evaluate site-specific conditions to determine whether people are being exposed to site-related chemicals. When evaluating exposure pathways, ATSDR identifies whether exposure to contaminated media (soil, water, air, or biota) is occurring through ingestion, dermal (skin) contact, or inhalation.
If exposure is possible, ATSDR scientists then consider whether environmental contamination is present at levels that might affect public health. ATSDR evaluates environmental contamination using available environmental sampling data and, in some cases, modeling studies.
More information about the ATSDR evaluation process can be found in ATSDR's Public Health Assessment Guidance Manual at http://www.atsdr.cdc.gov/HAC/PHAManual/toc.html or by contacting ATSDR at 1-800-232-4636. An interactive program that provides an overview of the public health assessment process ATSDR uses to evaluate whether people will be harmed by hazardous materials is available at http://www.atsdr.cdc.gov/training/public-health-assessment-overview/html/index.html.
If People Are Exposed, Will They Get Sick?
Chemical exposure does not always result in harmful health effects. The type and degree of health effects that occur in an individual as the result of contact with a chemical depend on the exposure concentration (how much), the frequency of exposure (how often), the duration of exposure (how long), the route or pathway of exposure (breathing, eating, drinking, or skin contact), and potentially the combination of chemicals. Once exposure occurs, factors such as age, gender, genetics, lifestyle, nutritional status, and health status influence how a person absorbs, distributes, metabolizes, and excretes the contaminant. Taken together, these factors and characteristics determine the health effects that can occur as a result of exposure to a chemical.
ATSDR screened all available current chemical data to determine whether concentrations were above ATSDR's comparison values (see the description below). Figure 4 illustrates ATSDR's chemical screening process. ATSDR also reviewed relevant toxicologic and epidemiologic data to obtain information about the toxicity of the chemicals to more completely understand the public health implications of exposure.
Comparing Environmental Concentrations to Comparison Values
ATSDR uses comparison values to screen chemicals that require additional evaluation. |
ATSDR selects chemicals for further evaluation by comparing the maximum environmental concentrations against media-specific health-based comparison values. The maximum concentrations are used at this step of the screening process as a conservative measure even though we know that people are exposed to a range of concentrations and not just to the maximum reported levels.
ATSDR uses the term "conservative" to refer to values that are protective of public health in essentially all situations. |
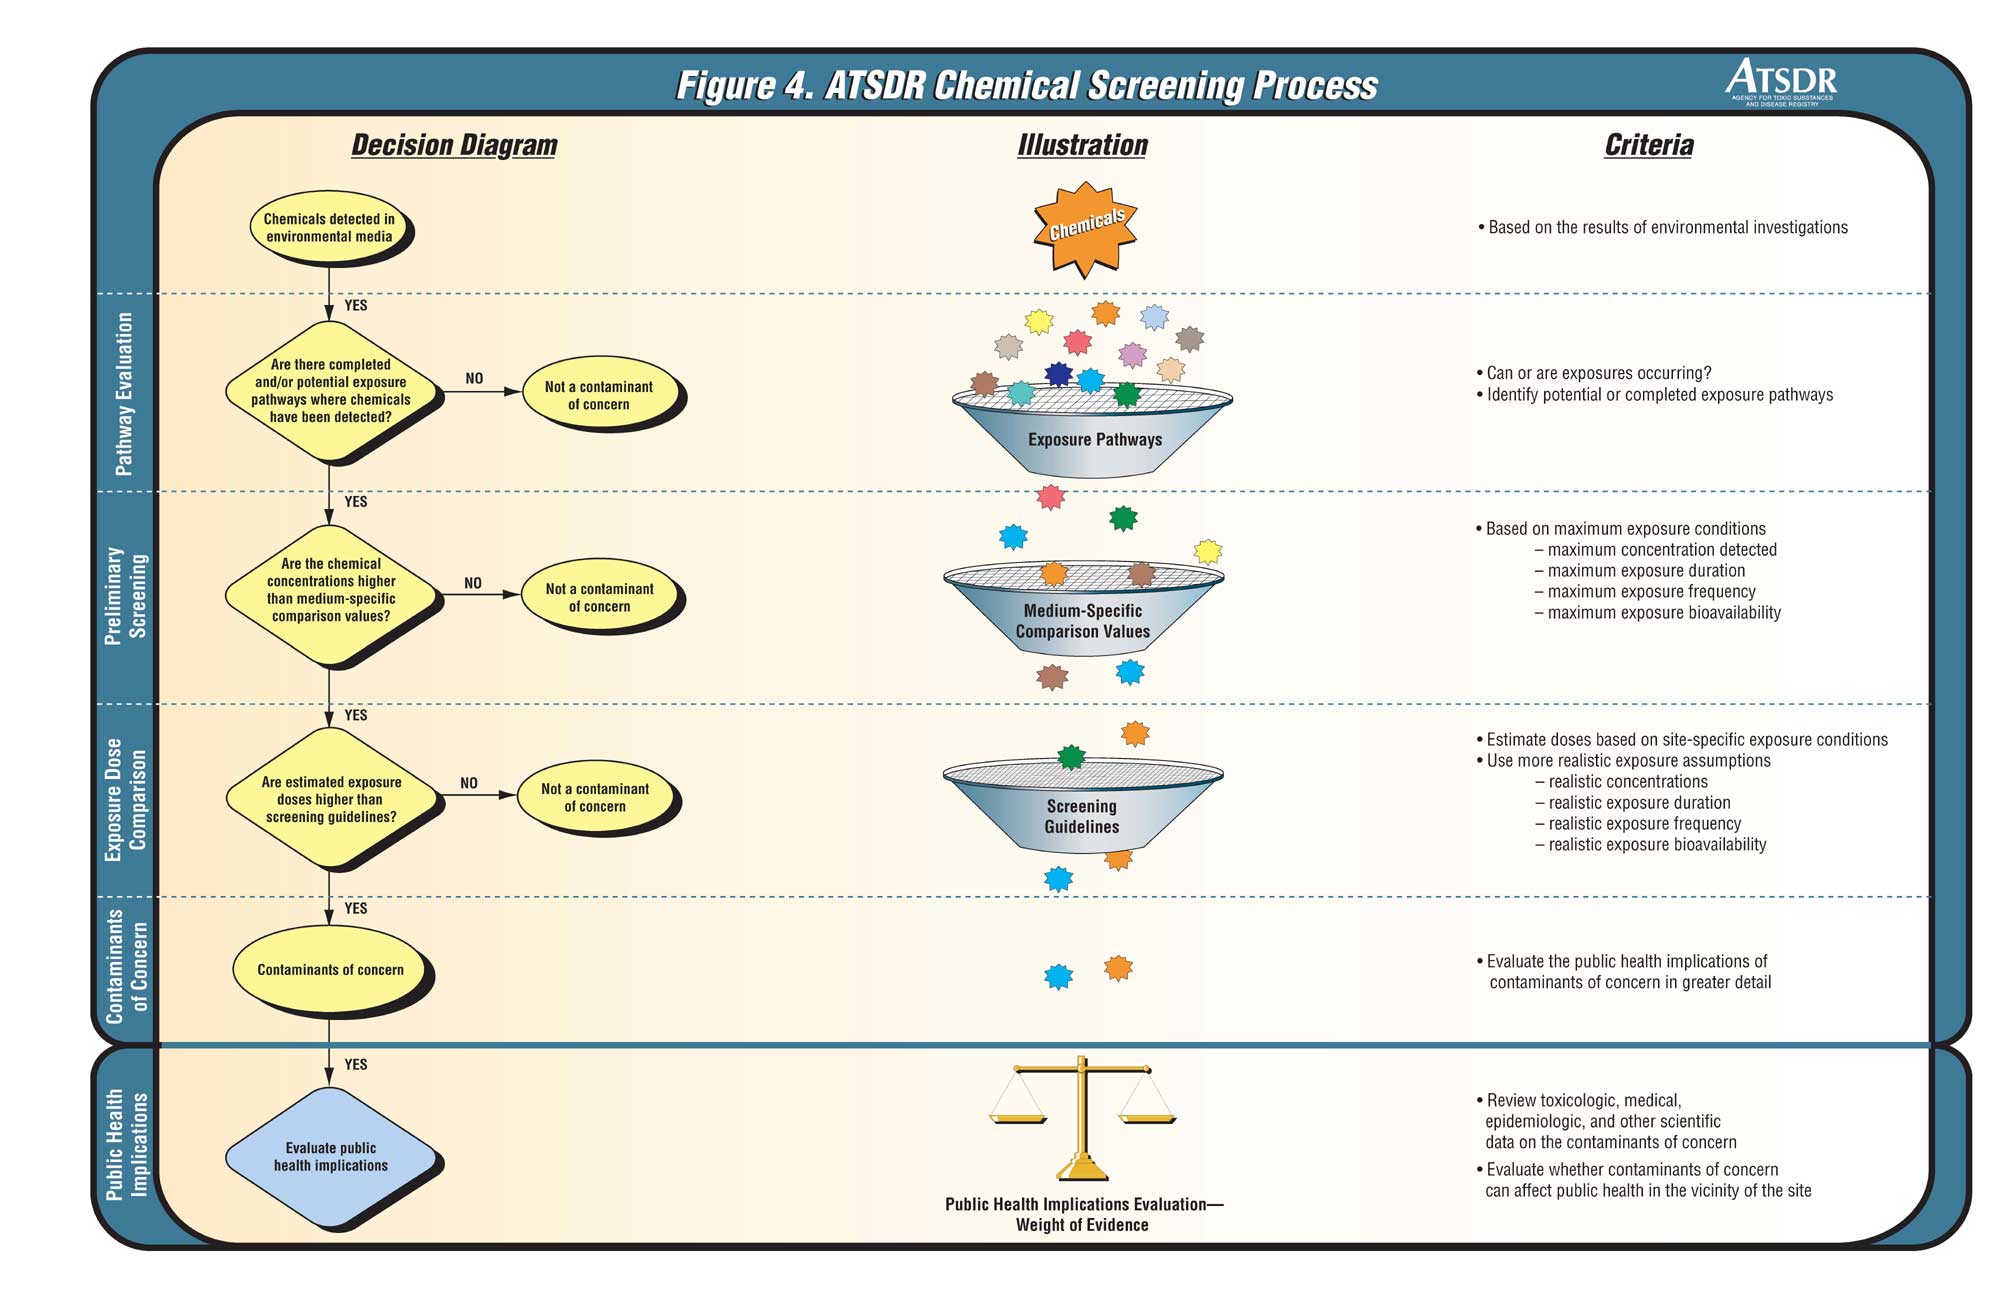
Figure 4. ATSDR Chemical Screening Process
ATSDR's cancer risk evaluation guides (CREGs), environmental media evaluation guides (EMEGs), and reference dose media evaluation guides (RMEGs) are conservative, health-based comparison values developed for screening environmental concentrations for further evaluation. EPA's risk-based concentration (RBC) is a health-based comparison value developed to screen sites not yet on the NPL, respond rapidly to citizens' inquiries, and spot-check formal baseline risk assessments. Please see Appendix A for a glossary of these and other terms used in this public health assessment.
Weight-of-evidence is the extent to which the available scientific information supports the hypothesis that a substance causes an adverse effect in humans. For example, factors that determine the weight-of-evidence that a chemical poses a hazard to humans include the number of tissue sites affected by the agent; the number of animal species, strains, genders, and number of experiments and doses showing a response; the dose-response relationship; statistical significance in the occurrence of the adverse effect in treated subjects compared with untreated controls; and the timing of the occurrence of the adverse effect. |
While concentrations at or below the respective comparison value can be considered safe, it does not automatically follow that any environmental concentration exceeding a comparison value would be expected to produce adverse health effects. Comparison values are not health effect thresholds. ATSDR comparison values represent concentrations that are many times lower than levels at which no effects were observed in studies on experimental animals or in human epidemiologic studies. The likelihood that adverse health outcomes will actually occur depends on site-specific conditions, individual differences, and factors that affect the route, magnitude, and duration of actual exposure. If contaminant concentrations are above comparison values, ATSDR further analyzes exposure variables (such as site-specific exposure duration and frequency) for health effects, including the toxicity of the chemical, epidemiology studies, and the weight-of-evidence.
A NOAEL is the highest tested dose of a substance that has been reported to have no harmful (adverse) health effects on people or animals in a study. |
Essential nutrients (e.g., calcium, magnesium, phosphorus, potassium, and sodium) are minerals that maintain basic life functions; therefore, certain doses are recommended on a daily basis. Because these chemicals are necessary for life, comparison values do not exist for them. They are found in many foods, such as milk, bananas, and table salt. For example, the Food and Nutrition Board of the Institute of Medicine of the National Academy of Sciences has recommended the following adequate intakes (AI) and recommended dietary allowance (RDA) for phosphorus: For infants 0 to 6 months and 7 to 12 months old, the AIs are 100 and 275 milligrams per day (mg/day), respectively. For children 1 to 3 years and 4 to 8 years old, the RDAs are 460 and 500, respectively. For children 9 to 18 years old, the RDA is 1,250 mg/day. Adults 19 years and older have an RDA of 700 mg/day. A no-observed-adverse-effect level (NOAEL) for phosphorus for adults is 10.2 grams/day—or more than 10,000 mg/day. Therefore, calcium, magnesium, phosphorus, potassium, and sodium were not considered for further evaluation.
Comparing Estimated Exposure Doses to Screening Guideline Values
If chemical concentrations are above comparison values, ATSDR further evaluates the chemical and potential exposure. ATSDR does this by calculating exposure doses and comparing the doses to protective screening guideline values, including ATSDR's minimal risk levels (MRLs) and EPA's reference doses (RfDs). Estimated exposure doses that are less than screening guideline values pose no public health hazard and are not evaluated further.
An exposure dose, expressed in milligrams per kilogram per day (mg/kg/day), is the estimated amount of chemical a person is exposed to over time. |
When estimating hypothetical exposure doses, health assessors evaluate chemical concentrations to which people could have been exposed, and assess the length of time (duration) and the frequency of exposure to these contaminant concentrations. Collectively, these factors influence an individual's physiological response to chemical exposure and potential outcomes. Where possible in this public health evaluation, ATSDR used site-specific information regarding the frequency and duration of exposures. When site-specific information was not available, ATSDR employed several protective assumptions to estimate exposures.
The following general equation was used to calculate exposure doses:
![]()
where:
C = Concentration of chemical
IR = Intake rate
EF = Exposure frequency, or number of exposure events per year of exposure
ED = Exposure duration, or the duration over which exposure occurs
BW = Body weight
AT = Averaging time, or the period over which cumulative exposures are averaged
Environmental concentrations of most soil and sediment contaminants are log-normally distributed; meaning that a few samples have high concentrations while most of the samples have much lower concentrations (Shacklette and Boergen 1984). EPA’s soil screening guidance (EPA 1996a, 2002c) recommends use of a spatially averaged concentration (i.e., the 50th percentile concentration over the exposure area). However, ATSDR chose to use a more conservative second-tier screening concentration4 (defined as one standard deviation above the average concentration) to estimate exposure doses during this phase of the screening process (i.e., to identify chemicals for further evaluation) to account for the variability of the samples. Use of the second-tier screening concentration is a health-protective estimate of the concentration; it results in a more protective screening process because the exposure doses are calculated using a concentration that is higher than the average concentration.
Using the general equation given above, the exposure parameters listed in Table 3, and the second-tier screening concentration, ATSDR derived hypothetical exposure doses for residents living near the site. ATSDR compared these estimated site-specific exposure doses against noncancer and cancer screening guideline values. ATSDR’s MRLs and EPA’s RfDs are estimated doses of daily human exposure to substances that are likely to be without appreciable risk of adverse noncancer health effects over a specified duration of exposure. MRLs and RfDs are derived for chemicals using the NOAEL/lowest-observed-adverse-effect level (LOAEL)/uncertainty factor approach. They are derived when reliable and sufficient human or animal data exist to identify the most sensitive health effect for a given route of exposure. MRLs and RfDs are generally based on the most sensitive end point considered to be of relevance to humans. Because of the lack of precise toxicologic information on people who might be most sensitive (for example, infants, the elderly, or persons who are nutritionally or immunologically compromised) to the effects of hazardous substances, MRLs and RfDs have built-in safety factors, making them considerably lower than doses at which health effects have been observed. Therefore, these screening guideline values are below doses that cause adverse health effects in people most sensitive to such effects. Consistent with the public health principle of prevention, ATSDR uses this conservative (protective) approach to maximize human health protection and to address the uncertainty in toxicologic information.
These chemical-specific guideline values, which serve as screening levels, are used to identify chemicals for further consideration. It is important to note that MRLs and RfDs are not thresholds for health effects and are not intended to define cleanup or action levels. They are intended only to serve as a screening tool to help public health professionals decide what chemicals and pathways to look at more closely. While estimated exposure doses that are less than MRLs or RfDs are not considered to be a public health hazard, exposure to doses above these screening values does not automatically imply that adverse health effects will occur. Rather, it is an indication that ATSDR should further examine the health effect levels reported in the scientific literature and more fully review potential exposures.
In addition, to screen for cancer effects, ATSDR multiplied estimated chronic-exposure doses (30-year exposure averaged over 70 years) by EPA’s cancer slope factors (CSFs), which estimate the relative potency of carcinogens. This calculation estimated a theoretical excess cancer risk expressed as the proportion of a population that might be affected by a carcinogen during a lifetime of exposure. For example, an estimated cancer risk of 1 × 10⁻⁶ predicts the probability of one additional cancer over background in a population of 1 million. Because conservative models are used to derive CSFs, the doses associated with these hypothetical risks are typically orders of magnitude lower than doses reported in the toxicologic literature to cause carcinogenic effects. As such, a low cancer risk estimate indicates that the toxicologic literature would support a finding that no excess cancer risk is likely. A higher cancer risk estimate, however, indicates that ATSDR should carefully review the scientific literature before making conclusions about potential cancer risks.
Table 3. Parameters Used in the Exposure Dose Calculations for ORR
|
Soil |
Sediment |
Surface Water |
Biota |
|||
|---|---|---|---|---|---|---|---|
Fish |
Game |
Vegetation |
|||||
Intake Rate |
|
|
|
Subsistence |
Recreational |
|
|
Exposure Frequency |
|
|
|
||||
Exposure Duration |
|
||||||
Body Weight |
|
||||||
Averaging Time |
Noncancer |
Cancer/Lifetime |
|||||
*The surface water intake rate was changed to 0.15 liter/day for the public health evaluation (see Section IV.C) to represent a three-hour swimming event (EPA 1999).
§ The body weight parameter is built into the intake rate for the vegetation dose equation (EPA 1999; Table 13-63).
Exposure doses are not calculated for the air pathway. Screening guidelines are reported in concentrations.
Cancer doses assume a 30-year exposure averaged over a 70-year lifetime.
kg = kilogram
NA = not applicable
Comparing Estimated Exposure Doses to Health Effect Levels
|
If the MRLs or RfDs are exceeded, ATSDR determines the public health implications of estimated exposures by examining the effect levels discussed in the scientific literature and more fully reviews exposure potential. ATSDR reviews available human studies as well as experimental animal studies. This information is used to understand the disease-causing potential of a chemical and to compare site-specific exposure dose estimates with doses shown to cause health effects. This process enables ATSDR to weigh the available evidence in light of uncertainties and offer perspective on the plausibility of harmful health outcomes under site-specific conditions.
Sources for Health-Based Guidelines
By Congressional mandate, ATSDR prepares toxicological profiles for hazardous substances found at contaminated sites. Toxicological profiles were used to evaluate potential health effects at the ORR. ATSDR's toxicological profiles are available on the Internet at http://www.atsdr.cdc.gov/toxpro2.html or by contacting the National Technical Information Service (NTIS) at 1-800-553-6847. EPA also develops health effects guidelines, and in some cases, ATSDR relied on EPA's guidelines to evaluate potential health effects. These guidelines are found in EPA's Integrated Risk Information System (IRIS)—a database of human health effects that could result from exposures to various substances found in the environment. IRIS is available on the Internet at http://www.epa.gov/iris ![]() . For more information about IRIS, please call EPA's IRIS hotline at (202) 566-1676 or send an e-mail to hotline.iris@epa.gov.
. For more information about IRIS, please call EPA's IRIS hotline at (202) 566-1676 or send an e-mail to hotline.iris@epa.gov.
It is important to note that ATSDR is assuming exposure to the contaminated media. The location of each detection was not individually evaluated to determine whether anyone is actually being exposed. |
As discussed earlier, exposure to a contaminant is an important factor in ATSDR's evaluation. If no one comes in contact with a contaminant, then no exposure occurs, and thus no health effects could occur. Therefore, this screening of current and future chemical exposures focuses primarily on contaminants detected in off-site locations, where exposures are more likely to occur (as opposed to on-site locations, where access is restricted).5 However, because there are limited off-site air samples, and people have access to on-site fish and game, on-site exposures to these media are also included. See Figure 5 for the exposure pathways ATSDR evaluated in this health assessment. ATSDR evaluated exposures to chemicals detected in off-site groundwater in a separate, pathway-specific public health assessment. (Copies of the document can be obtained from ATSDR's Web site: http://www.atsdr.cdc.gov/HAC/oakridge/phact/groundwater/index.html.) Appendix D contains maps depicting the number of samples collected from and the number of chemicals sampled at each location in each media.
For this public health evaluation, ATSDR used environmental sampling data collected within the ORRHES Area of Interest (see Figure 6) from 1990 to 2003. The Oak Ridge Environmental Information System (OREIS)—a centralized, standardized, quality-assured, and configuration-controlled environmental data management system—supplied the data. DOE created OREIS to integrate the abundant environmental data on the ORR into one database, facilitating public and government access to environmental operations data while maintaining data quality. DOE's objective was to ensure that the database had long-term retention of the environmental data and useful methods to access the information. OREIS contains data on compliance, environmental restoration, and surveillance activities. Information from all key surveillance activities and environmental monitoring efforts is entered into OREIS. As new studies are completed, the environmental data are entered as well.
ATSDR's database manager scrutinized the data evaluated in this public health assessment to ensure proper quality assurance/quality control. ATSDR did not use any data in this evaluation that were deemed unreliable. For example, surface water data are typically reported in micrograms per liter (µg/L) or milligrams per liter (mg/L). Some surface water data in OREIS were reported in milligrams per kilogram (mg/kg). ATSDR suspected that the media code had been interpreted incorrectly and these data were actually fish data. Since this could not be confirmed, the data were not used in this evaluation.
Scenarios for past, current, and future exposure to PCBs and mercury will be addressed in chemical-specific public health assessments. Two of ATSDR's public health assessments address exposure to uranium from the ORR: one on uranium releases from the Y-12 plant (already released; available at http://www.atsdr.cdc.gov/HAC/oakridge/phact/y12/index.html) and another, still being prepared, that addresses past and current exposure to uranium and fluoride releases from the K-25 site. ATSDR scientists have also released or are conducting public health assessments on the following issues associated with the ORR: iodine 131 releases from the X-10 site, radionuclide releases from White Oak Creek, mercury releases from the Y-12 plant, contaminated off-site groundwater, PCB releases from the X-10 site, the Y-12 plant, and the K-25 site, and contaminant releases from the TSCA Incinerator. The documents released to date are available at http://www.atsdr.cdc.gov/HAC/oakridge/phact/index.html and can also be ordered through a toll-free ATSDR telephone number, 1-800-232-4636.
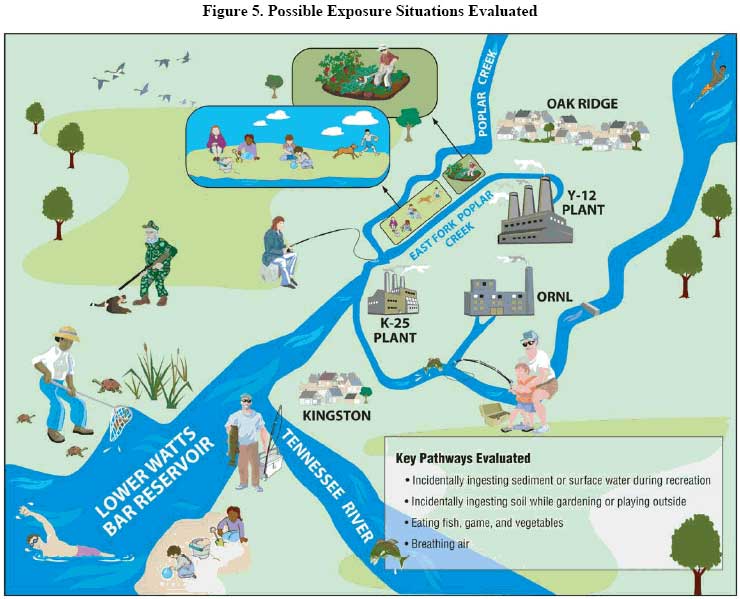
Figure 5. Possible Exposure Situations Evaluated
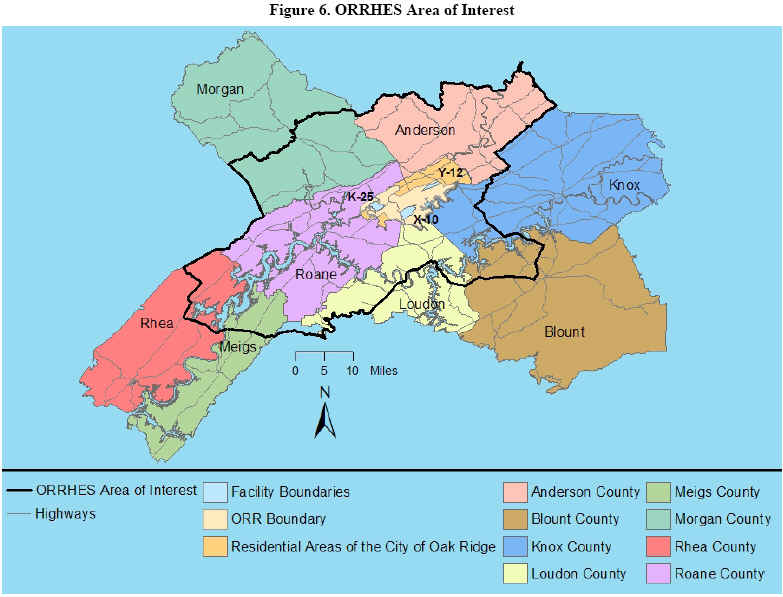
Figure 6. ORRHES Area of Interest
OREIS contains almost 10,000 records6 of chemicals sampled in off-site soil from November 5, 1990, to September 1, 2001. These samples were analyzed for a total of 286 chemicals.6 See Figures D-1 and D-2 in Appendix D for the number of off-site soil samples collected from and the number of chemicals sampled at each location.
ATSDR compared the maximum concentration for each chemical detected off site to that chemical's conservative health-based comparison value. The maximum concentrations for 22 chemicals were detected above comparison values. ATSDR calculated exposure doses for these 22 chemicals, using the equation described in Section III.B, "Methodology," and the exposure parameters listed in Table 3. ATSDR then compared these exposure doses to the acute and chronic noncancer and cancer screening guidelines (see Table 4, Table 16, and Table 17). Four chemicals exceeded noncancer and/or cancer screening guidelines, and are further evaluated in Section IV, "Public Health Implications." Figure 7 shows the results of ATSDR's chemical screening process. Chemicals without screening guidelines are discussed in Appendix B. Pica child exposures are evaluated in Section IV.B, "Children's Health Considerations."
Chemicals Detected Above Comparison Values in Off-Site Soil (22 Chemicals)
Inorganics
|
Organics
|
Chemicals with Exposure Doses Above Cancer/Noncancer Screening Guidelines in Off-Site Soil (4 Chemicals)
Inorganics
|
Organics
|
OREIS contains about 56,000 records7 of chemicals sampled in off-site sediment from January 15, 1990, to September 1, 2001. These samples were analyzed for a total of 319 chemicals.7 See Figures D-3 and D-4 in Appendix D for the number of off-site sediment samples collected from and the number of chemicals sampled at each location.
ATSDR compared the maximum concentration for each chemical detected off-site to that chemical's conservative health-based comparison value. The maximum concentrations for 33 chemicals were detected above comparison values. ATSDR calculated exposure doses for these 33 chemicals, using the equation described in Section III.B, "Methodology," and the exposure parameters listed in Table 3. ATSDR then compared these exposure doses to the noncancer and cancer screening guidelines (see Table 18 and Table 19). None of the chemicals detected in off-site sediment exceeded noncancer or cancer screening guidelines. Therefore, exposure to off-site sediment is not a health hazard. Figure 7 shows the results of ATSDR's chemical screening process. Chemicals without screening guidelines are discussed in Appendix B.
Chemicals Detected Above Comparison Values in Off-Site Sediment (33 Chemicals)
Inorganics
|
Organics
|
OREIS contains more than 93,000 records7 of chemicals sampled in off-site surface water from January 8, 1990, to September 10, 2002. These samples were analyzed for a total of 310 chemicals.7 See Figures D-5 and D-6 in Appendix D for the number of off-site surface water samples collected from and the number of chemicals sampled at each location.
ATSDR compared the maximum concentration for each chemical detected off site to that chemical's conservative health-based comparison value. The maximum concentrations for 75 chemicals were detected above comparison values. ATSDR calculated exposure doses for these 75 chemicals, using the equation described in Section III.B, "Methodology," and the exposure parameters listed in Table 3. ATSDR then compared these exposure doses to the noncancer and cancer screening guidelines (see Table 20 and Table 21). None of the chemicals detected in off-site surface water exceeded noncancer or cancer screening guidelines. Therefore, exposure to off-site surface water is not a health hazard. Figure 7 shows the results of ATSDR's chemical screening process. Chemicals without screening guidelines are discussed in Appendix B.
Chemicals Detected Above Comparison Values in Off-Site Surface Water (75 Chemicals)
Inorganics
|
Organics
|
Fish
OREIS contains more than 16,000 records8 of chemicals sampled in fish (e.g., bass, carp, catfish, crayfish, and sunfish) from May 29, 1990, to August 14, 2002. A total of 147 different chemicals8 were analyzed—43 chemicals in fish collected from East Fork Poplar Creek (EFPC), 64 chemicals in fish collected from the Clinch River, 81 chemicals in fish collected from the Watts Bar Reservoir (WBR), and 124 chemicals in fish collected from on-site locations. See Figures D-7 through D-10 in Appendix D for the number of fish samples collected from and the number of chemicals sampled at each location.
Subsistence-level comparison values do not exist for chemicals detected in fish species. Therefore, as an initial screen, ATSDR calculated exposure doses for chemicals detected in fish samples (whole, filet, muscle, and unknown portions) using (1) the equation described in Section III.B, "Methodology"; (2) the subsistence exposure parameters listed in Table 3; and (3) the average of the maximum concentrations detected for each group/species.9 Exposure doses are most likely overestimated because the inclusion of whole fish and crayfish data—fillet and muscle (edible portions) typically have less contamination. ATSDR compared these exposure doses to noncancer and cancer screening guidelines. Estimated exposure doses for the following 12 chemicals exceeded the screening guidelines for at least one location.
Chemicals with Initial Screen Exposure Doses Above Screening Guidelines (12 Chemicals)
Inorganics
|
Organics
|
As a second screen, ATSDR calculated recreational and subsistence-level exposure doses using the second-tier screening concentrations for the chemicals listed above. Then ATSDR compared these doses to noncancer and cancer screening guidelines (see Table 22 through Table 29). For this level of the evaluation, the fish were grouped by species and by location.10 Chemicals that exceeded noncancer or cancer screening guidelines in at least one fish species during this second level of screening are further evaluated in the Public Health Implications section (see Section IV). Figure 7 shows the results of ATSDR's chemical screening process. Chemicals without screening guidelines are discussed in Appendix B.
Chemicals with Second Screen Exposure Doses Above Screening Guidelines in EFPC Fish (6 Chemicals)
Inorganics
|
Organics
|
Chemicals with Second Screen Exposure Doses Above Screening Guidelines in Clinch River Fish (6 Chemicals)
Inorganics
|
Organics
|
Chemicals with Second Screen Exposure Doses Above Screening Guidelines in WBR Fish (8 Chemicals)
Inorganics
|
Organics
|
Chemicals with Second Screen Exposure Doses Above Screening Guidelines in On-Site Fish (8 Chemicals)
Inorganics
|
Organics
|
Game
OREIS contains more than 2,200 records11 of chemicals sampled in game species (e.g., turtles and wood ducks) from March 28, 1990, to May 23, 1996. A total of 118 different chemicals were analyzed—27 chemicals11 in game collected from off-site locations and 118 chemicals11 in game collected from on-site locations. See Figures D-11 through D-14 in Appendix D for the number of game samples collected from and the number of chemicals sampled at each location.
Comparison values do not exist for chemicals detected in game species. Therefore, as an initial screen, ATSDR calculated exposure doses using (1) the equation described in Section III.B, "Methodology"; (2) the exposure parameters listed in Table 3; and (3) the average of the maximum detected concentrations.12 ATSDR compared these exposure doses to noncancer and cancer screening guidelines. No exposure doses for chemicals detected in game from off-site locations exceeded the screening guidelines. Calculated exposure doses exceeded the screening guidelines for the following eight chemicals detected in game from on-site locations.
Chemicals with Initial Screen Exposure Doses Above Screening Guidelines in On-Site Game (8 Chemicals)
Inorganics
|
Organics
|
As a second screen, ATSDR calculated exposure doses using the second-tier screening concentrations for the chemicals listed above and compared these doses to noncancer screening guidelines13 (see Table 30). For this part of the evaluation, the game samples collected on site were grouped by species. Exposure doses for seven of the eight chemicals exceeded noncancer screening guidelines during this second level of screening, and are further evaluated in the Public Health Implications section (see Section IV). Figure 7 shows the results of ATSDR's chemical screening process. Chemicals without screening guidelines are discussed in Appendix B.
Chemicals with Second Screen Exposure Doses Above Screening Guidelines in On-Site Game (7 Chemicals)
Inorganics
|
Organics
|
Off-Site Vegetation
OREIS contains 236 records14 of chemicals sampled in vegetation (e.g., beets, kale, and tomatoes) from July 30, 1992, to September 8, 1992. These samples were analyzed for a total of six chemicals.14 See Figures D-15 and D-16 in Appendix D for the number of off-site vegetation samples collected from and the number of chemicals sampled at each location.
Comparison values do not exist for chemicals detected in vegetation. Therefore, as an initial screen, ATSDR calculated exposure doses for the six chemicals using (1) the equation described in Section III.B, "Methodology"; (2) the exposure parameters listed in Table 3; and (3) the average of the maximum concentrations.15 ATSDR compared these exposure doses to noncancer and cancer screening guidelines. Calculated exposure doses exceeded the screening guidelines for the following three chemicals detected in vegetation from off-site locations.
Chemicals with Initial Screen Exposure Doses Above Screening Guidelines in Off-Site Vegetation (3 Chemicals)
Inorganics
|
As a second screen, ATSDR calculated exposure doses using the second-tier screening concentrations for the chemicals listed above and compared these doses to noncancer and cancer screening guidelines (see Table 31 and Table 32). For this level of the evaluation, the vegetation samples were grouped by type (beets, kale, tomatoes, and unknown terrestrial plant). All three chemicals exceeded noncancer and/or cancer screening guidelines during this second level of screening, and are further evaluated in Section IV, "Public Health Implications." Figure 7 shows the results of ATSDR's chemical screening process.
Chemicals with Second Screen Exposure Doses Above Screening Guidelines in Off-Site Vegetation (3 Chemicals)
Inorganics
|
OREIS contains about 1,100 records16 of chemicals sampled in the air from July 31, 1997, to June 30, 2002, from air monitoring stations near the East Tennessee Technology Park. Five different chemicals16 were analyzed at these locations. See Figures D-17 and D-18 in Appendix D for the number of air samples collected from and the number of chemicals sampled at each location.
ATSDR compared the maximum detected concentration for each chemical to that chemical's conservative health-based comparison value. Based on this initial screen (see Table 33), ATSDR further evaluated the following three chemicals in Section IV, "Public Health Implications." (Beryllium and lead were not detected above comparison values.)
Chemicals Detected Above Comparison Values in Air (3 Chemicals)
Inorganics
|
The list of chemicals evaluated for public health implications, as shown in Figure 7, is compiled from the list of chemicals exceeding screening guidelines. To eliminate duplication, the chemicals are combined across the different media.
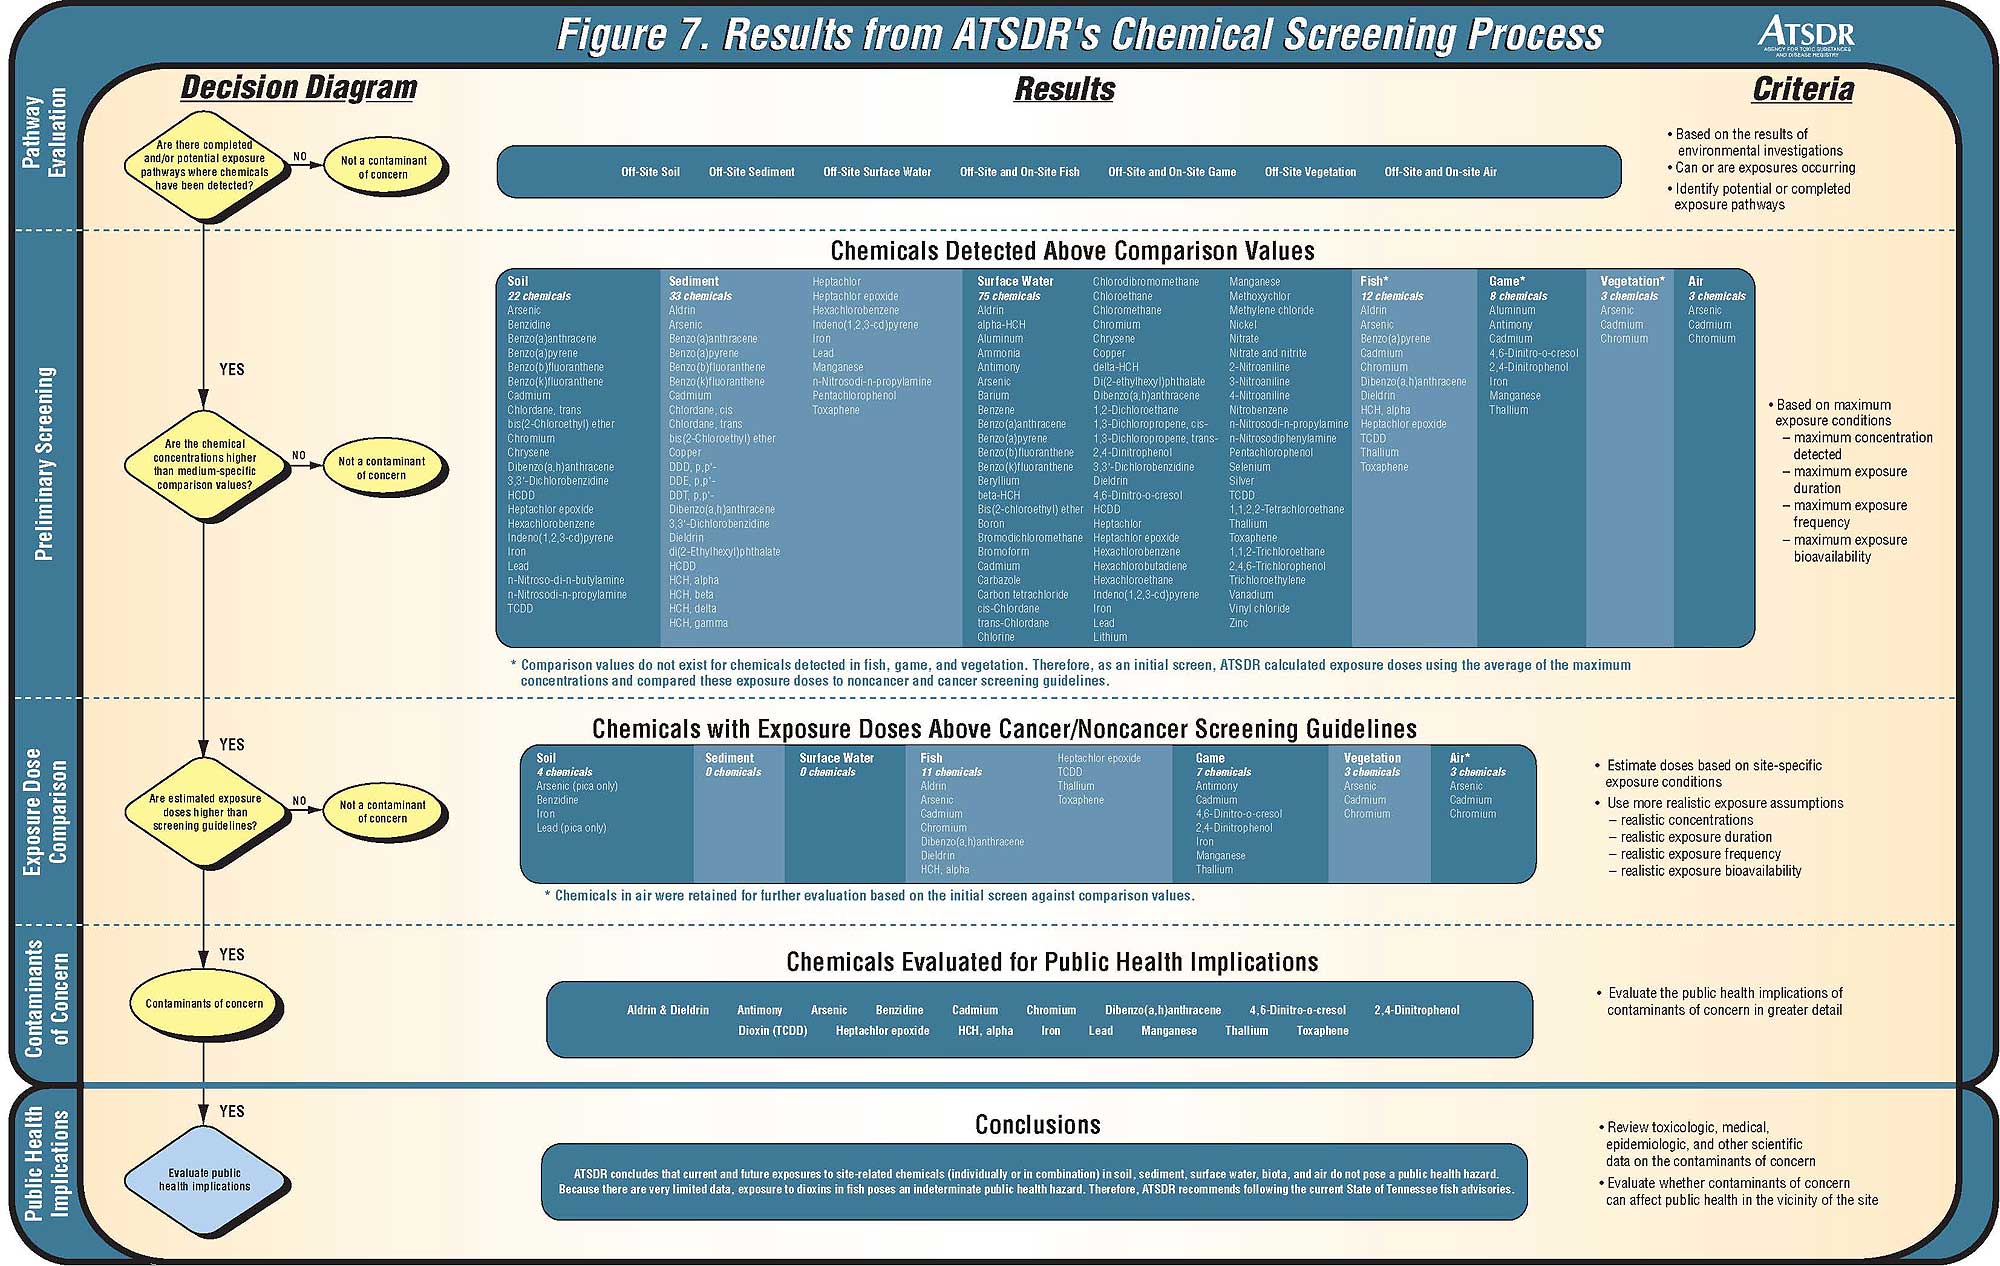
Figure 7. Results from ATSDR's Chemical Screening Process
Next Section Table of Contents