Contact Us:
- Centers for Disease Control and Prevention
1600 Clifton Rd
Atlanta, GA 30333 - 800-CDC-INFO
(800-232-4636)
TTY: (888) 232-6348
24 Hours/Every Day - cdcinfo@cdc.gov
Public Health Assessment
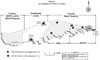
Air Pathway Evaluation,
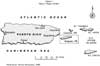
Isla de Vieques Bombing Range,
Vieques, Puerto Rico
To print this report, please select the "Print Friendly View" option in left hand menu and use your browsers print function or the "Print Page" option on the right side of the page. You may also print individual sections of the report by navigating to a section using the left hand menu and following the same steps above.
August 26, 2003
Prepared by:
Federal Facilities Assessment Branch
Division of Health Assessment and Consultation
Agency for Toxic Substances and Disease Registry
Tables
| Parameter | 1990 Census Data | 2000 Census Data | ||
|---|---|---|---|---|
| Number of Residents | Percent of Total Residents | Number of Residents | Percent of Total Residents | |
| Total residents | 8,602 | 100% | 9,106 | 100% |
| Men | 4,234 | 49% | 4,512 | 50% |
| Women | 4,368 | 51% | 4,594 | 50% |
| Women of childbearing age | 1,766 | 21% | 1,701 | 19% |
| Children | 1,106 | 13% | 1,001 | 11% |
| Elderly | 993 | 12% | 1,263 | 14% |
Sources of data: US Bureau of the Census 1990, 2000.
Notes:
According to the 1990 census data, 2,056 families lived on Vieques. In 2000, this number increased to 2,366.
Both the 1990 and 2000 census data include residents living on Navy lands and in the residential area.
Definitions:
Women between the ages of 15 and 44 are considered of childbearing age.
Children are residents who are 6 years old or younger.
The elderly includes all residents of age 65 and older.
| Year | Name of Facility (as Listed in TRI) |
Chemical Released | Air Releases (pounds per year) |
|---|---|---|---|
| 1987 | GE Co. Caribe | 1,1,1-Trichloroethane | 9,314 |
| 1988 | GE Co. Caribe | 1,1,1-Trichloroethane | 8,400 |
| 1989 | No data reported for the island of Vieques | ||
| 1990 | GE Co. Caribe | 1,1,1-Trichloroethane | 10,900 |
| 1991 | Caribe GE Distribution Transformers Inc. | 1,1,1-Trichloroethane | 10,500 |
| 1992 | Caribe GE Distribution Transformers Inc. | Copper | 0 |
| 1993 | Caribe GE Distribution Transformers Inc. | Copper | 0 |
| 1994 | Caribe GE Distribution Transformers Inc. | Copper | 0 |
| 1995 | Caribe GE Distribution Transformers Inc. | Copper | 5 |
| 1996 | GE Power Protection of PR | Copper | 15 |
| 1997 | GE Power Protection of PR | Copper | 30 |
| 1998 | GE Power Protection of PR | Copper | 30 |
| 1999 | GE Power Protection of PR | Copper | 30 |
Source of data: EPA 1997, 2001.
Notes:
- The table lists only the air releases that facilities in Vieques reported to TRI.
- For reporting years 1987 through 1995, the "name of facility" is taken from one source of data (EPA 1997); for reporting years 1996 through 1999, it is from another (EPA 2001). Release data for more current years are not yet publicly available.
- TRI data are self-reported; the accuracy of the release data for individual facilities is not known.
- The TRI regulations require facilities in certain industries to disclose releases of specific hazardous chemicals and selected waste management activities. However, the regulations do not require that all facilities report, and do not address all contaminants, which is presumably why the table does not account for other emissions sources on Vieques. Therefore, the data in this table should not be viewed as a comprehensive emissions inventory for Vieques.
- Releases of zero pounds suggest that the facility manufactured, processed, or otherwise used the chemical in large enough quantities to trigger TRI reporting, but none (or less than 0.5 pounds per year) were estimated as being released to the air.
| Pathway Name | Exposure Pathway Elements | Time of Exposure | Comments | ||||
|---|---|---|---|---|---|---|---|
| Potential Source of Contamination | Environmental Media | Point of Exposure | Route of Exposure | Exposed Population | |||
| Potential Exposure Pathways | |||||||
| Inhalation of contaminants in wind-blown dust when bombing did not occur (see Section V.A) | Wind-blown dust from the LIA | Air: transport from the LIA downwind to residential locations | Ambient air | Inhalation | Residents of Vieques | Entire history of Navy operations | Extensive sampling collected by PREQB has shown that levels of wind-blown dust on days without military training exercises are not of public health concern. |
| Inhalation of contaminants released on days when the Navy conducted military training exercises using only practice bombs (see Section V.B) | Military training exercises at the LIA using practice bombs | Air: transport from the LIA downwind to residential locations | Ambient air | Inhalation | Residents of Vieques | Exposures have only occurred on the days between April 1999 and May 1, 2003, when military training exercises occurred. This is limited to no more than 90 days per year. | PREQB has collected numerous air samples on days when the Navy conducted training exercises using practice bombs. These samples indicate that levels of particulate matter have not reached levels that could present a public health hazard on days when practice bombs are used. The air sampling results, combined with soil sampling data, also indicate that exposures to metals and explosives are not of health concern on days when practice bombs are used. |
| Inhalation of contaminants released on days when the Navy conducted military training exercises using live bombs (see Section V.C) | Military training exercises at the LIA using live bombs | Air: transport from the LIA downwind to residential locations | Ambient air | Inhalation | Residents of Vieques | Dates of bombing exercises between 1941 and April 19, 1999 | Modeling analyses of reasonable exposure scenarios indicate that the military training exercises involving live bombs did not result in exposures at levels of health concern for all categories of contaminants considered, including particulate matter, chemical by-products of explosions, metals, and explosives. |
| Inhalation of contaminants released during open burning and open detonation (see Section V.D) | Open burning and open detonation of waste munitions and unexploded ordnance | Air: transport from the LIA downwind to residential locations | Ambient air | Inhalation | Residents of Vieques | On isolated days from at least the early 1970s through the present | Modeling analyses of reasonable exposure scenarios indicate that the limited open burning and open detonation activities have not resulted in exposures at levels of health concern for all categories of contaminants considered, including particulate matter, chemical by-products of explosions, metals, and explosives. |
| Inhalation of contaminants used sporadically during military training exercises (see Section V.D) | Past firing of depleted uranium penetrators and ongoing use of chaff. | Air: transport from the LIA (for depleted uranium) and in upper air winds patterns (chaff) downwind to residential locations | Ambient air | Inhalation | Residents of Vieques | Depleted uranium: limited to the date when the rounds of concern were used, and dates thereafter; chaff: on dates when the Navy uses the material during military training exercises. | Modeling analyses of reasonable exposure scenarios indicate that the amounts of depleted uranium that were fired at Vieques and the amounts of chaff that have been released to the air did not result in exposures (either chemical or radiological) at levels of health concern in the residential areas of Vieques. |
Note: Indirect exposures to air contaminants in other media (groundwater, soil, biota) are being addressed in other PHAs.
| Refer to footnotes at the end of the table before interpreting any of the data presented below. | ||||
|---|---|---|---|---|
| Element | Average Concentration of Element in LIA Surface Soils (ppm, by weight) | Estimated Annual Average Air Concentration of Element in PM10 (µg/m3) | Health-based Comparison Value (µg/m3) | Type of Comparison Value |
| Aluminum | 16,200 | 0.55 | 3.7 | RBC-n |
| Antimony | 1.14 | 0.00004 | 1.5 | RBC-n |
| Arsenic | 7.87 | 0.0003 | 0.0002 | CREG |
| Barium | 105 | 0.004 | 0.51 | RBC-n |
| Beryllium | 0.241 | 0.000008 | 0.0004 | CREG |
| Boron | 15.7 | 0.0005 | 210 | RBC-n |
| Cadmium | 1.71 | 0.00006 | 0.0006 | CREG |
| Chromium | 37.8 | 0.0013 | 5500 | RBC-n |
| Cobalt | 14.6 | 0.0005 | 0.1 | EMEG-c |
| Copper | 39.1 | 0.0013 | 150 | RBC-n |
| Iron | 33,500 | 1.1 | 1,100 | RBC-n |
| Lead | 8.49 | 0.0003 | 1.5 | NAAQS |
| Manganese | 723 | 0.025 | 0.04 | EMEG-c |
| Mercury | 0.0216 | 0.0000007 | 0.2 | EMEG-c |
| Nickel | 15.9 | 0.0005 | 0.2 | EMEG-c |
| Scandium | 12.5 | 0.0004 | NA | NA |
| Selenium | 1.23 | 0.00004 | 180 | RBC-n |
| Strontium | 156 | 0.0053 | 2200 | RBC-n |
| Tin | 4.87 | 0.0002 | 2200 | RBC-n |
| Titanium | 1,650 | 0.056 | 310 | RBC-n |
| Vanadium | 106 | 0.0036 | 0.2 | MRL |
| Yttrium | 20.8 | 0.0007 | NA | NA |
| Zinc | 47.5 | 0.0016 | 1100 | RBC-n |
| Zirconium | 59 | 0.002 | NA | NA |
Notes:
- The "average concentration of element in LIA surface soils" is taken from ATSDR's previous analysis of soils contamination (ATSDR 2001b).
- The "estimated annual average air concentration of element in PM10" is the product of the values in the first two columns.
- The "estimated annual average air concentration of element in PM10" was calculated by multiplying the annual average air concentration of PM10 in Esperanza (34.1 µg/m3, see Appendix C.1) and the average concentration of the element in LIA soils. This product was divided by 1,000,000 to convert the estimated concentration into units of µg/m3.
- The "type of comparison value" indicates the reference for the comparison value selected (see Appendix A). Abbreviations used in this field are:
CREG: ATSDR cancer risk evaluation guide
EMEG-c: ATSDR environmental media evaluation guide for chronic exposure
MRL: ATSDR Minimal Risk Level
NAAQS: EPA National Ambient Air Quality Standard
RBC-n: EPA Region 3 risk-based concentration for noncancer effects
- NA: Scandium, yttrium, and zirconium do not have relevant health-based comparison values.
- The comparison value for "chromium" is for trivalent chromium, not hexavalent chromium. See Section V.A for an interpretation of this selection.
| Refer to footnotes at the end of the table before interpreting any of the data presented below. | |||||
|---|---|---|---|---|---|
| Chemical | Average PM10 Concentration at Esperanza (µg/m3) |
Average Concentration of Chemical in the LIA Soils (ppm, by weight) |
Estimated Annual Average Air Concentration of Chemical in PM10 (µg/m3) |
Health-based Comparison Value (µg/m3) |
Type of Comparison Value |
| 2-Amino-4,6-dinitrotoluene | 34.1 | 0.62 | 0.00002 | 0.22 | RBC-n |
| HMX | 34.1 | 0.39 | 0.00001 | 180 | RBC-n |
| Nitroglycerin | 34.1 | 8.1 | 0.0003 | 0.45 | RBC-c |
| RDX | 34.1 | 0.41 | 0.00001 | 0.057 | RBC-c |
| TNT | 34.1 | 2.85 | 0.0001 | 0.21 | RBC-c |
Notes:
- The "average PM10 concentration at Esperanza" is based on the PREQB 2000-2002 sampling results (see Appendix C.1).
- The "average concentration of chemical in the LIA soils (ppm, by weight)" is the average concentration of explosives in soil samples collected at the LIA reported in the PHA on soil contamination (ATSDR 2001b).
- The "estimated annual average air concentration of chemical in PM10" is the product of the values in the first two columns.
- The "health-based comparison value" is a toxicity screening value (see Section IV.B and Appendix A for more details).
- The "type of comparison value" indicates the reference for the comparison value selected (see Appendix A). Abbreviations used in this field are:
RBC-c: EPA Region 3 risk-based concentration for cancer effects
RBC-n: EPA Region 3 risk-based concentration for noncancer effects
| Parameter | Summary of PREQB's Sampling Results | |||||
|---|---|---|---|---|---|---|
| Data Collected in Esperanza | Data Collected in Isabel Segunda | |||||
| Average Concentration (µg/m3) |
Concentration Range (µg/m3) |
Number of Samples | Average Concentration (µg/m3) |
Concentration Range (µg/m3) |
Number of Samples | |
| Summary statistics for total suspended particulates (TSP) | ||||||
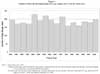
| Sampling results for days without military training exercises | 41.3 | 17-163 | 77 | 33.0 | 14-177 | 79 |
| Sampling results for days with exercises using only practice bombs | 53.3 | 25-124 | 15 | 43.8 | 18-105 | 10 |
| Summary statistics for particulate matter smaller than 10 microns (PM10) | ||||||
| Sampling results for days without military training exercises | 35.0 | 14-64 | 75 | 21.6 | 10-60 | 78 |
| Sampling results for days with exercises using only practice bombs | 40.1 | 22-77 | 13 | 34.7 | 11-94 | 13 |
Notes:
- Data Source: See Appendix C.1. The data in the table are based on sampling data and range utilization statistics compiled through October 2001. Refer to Table C-1 for a complete account of the sampling results collected since that time.
- Dates with "exercises using only practice bombs" were determined from Navy range utilization statistics. Dates on which air-to-ground or ship-to-shore firing of "non-explosive ordnance" were considered as being exercises using only practice bombs.
- ATSDR ran t-tests to determine if statistically significant differences existed between the average concentrations listed above. These tests revealed that the differences in TSP levels at Esperanza and Isabel Segunda and the differences in PM10 levels at Esperanza were not statistically significant (p-level > 0.05). At Isabel Segunda, the average PM10 concentration during training exercises using practice bombs was greater than the average concentration when no practice bombs were used (p = 0.0005).
| Date | Total Weight of Non-Explosive Ordnance Used (tons) | 24-Hour Average Ambient Air Concentrations Measured by PREQB (µg/m3) | |||
|---|---|---|---|---|---|
| TSP Concentrations in Esperanza | TSP Concentrations in Isabel Segunda | PM10 Concentrations in Esperanza | PM10 Concentrations in Isabel Segunda | ||
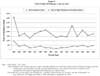
| 8/4/00 | 0.67 | 51 | No sample | 50 | No sample |
| 8/16/00 | 7.03 | 78 | 30 | No sample | 23 |
| 10/15/00 | 2.39 | 32 | 24 | 22 | 11 |
| 5/1/01 | 1.13 | 25 | 24 | 22 | 12 |
| 6/18/01 | 12.75 | 57 | No sample | 55 | 39 |
| 8/2/01 | 5.85 | 45 | 31 | 39 | No sample |
| 8/3/01 | 4.80 | 36 | No sample | 30 | No sample |
| 8/4/01 | 2.77 | 56 | No sample | 47 | 33 |
| 8/6/01 | 34.01 | 25 | 18 | 22 | 14 |
| 8/7/01 | 19.06 | 87 | 69 | 77 | 60 |
| 8/8/01 | 6.17 | 124 | 105 | No sample | 94 |
| 9/28/01 | 12.89 | 40 | 43 | 32 | 28 |
| 10/4/01 | 1.14 | 50 | 51 | 50 | 47 |
| 10/10/01 | 0.06 | No sample | No sample | No sample | 26 |
| 10/11/01 | 0.28 | 39 | 43 | 33 | 30 |
| 10/12/01 | 8.42 | 54 | No sample | 39 | 34 |
Notes:
- Data on weight of practice bombs dropped are taken from the Navy's range utilization statistics (Navy 2002); air sampling data were provided by PREQB (see Appendix C.1). Total weight of non-explosive ordnance used equals the sum of the amounts used for air-to-ground and ship-to-shore exercises. The data in the table are based on sampling data and range utilization statistics compiled through October 2001. Refer to Table C-1 for a complete account of the sampling results collected since that time.
- "No sample" indicates that PREQB did not report a valid sampling result for the pollutant, date, and location indicated.
- The weight of practice bombs dropped on the LIA was essentially uncorrelated with the TSP concentrations at Esperanza (R2 = 0.000), the TSP concentrations at Isabel Segunda (R2 = 0.011), the PM10 concentrations at Esperanza (R2 = 0.002), and the PM10 concentrations at Isabel Segunda (R2 = 0.000).
- Data are presented for only those days when practice bombs were dropped and valid air sampling results were available. Practice bombs were dropped on additional dates not shown in the table, but no valid sampling results were collected on those days.
| Chemical | Estimated Annual Average Ambient Air Concentration (µg/m3) | Health-Based Comparison Value (µg/m3) | Type of Comparison Value |
|---|---|---|---|
| 1,3,5-Trinitrobenzene | 0.0000001 | 110 | RBC-n |
| 1,3-Butadiene | 0.0000005 | 0.004 | CREG |
| 1,4-Dichlorobenzene | 0.00000002 | 100 | EMEG-c |
| 2,4-Dinitrotoluene | 0.0000003 | 7.3 | RBC-n |
| 2,6-Dinitrotoluene | 0.00000003 | 3.7 | RBC-n |
| 2-Methylphenol | 0.00000005 | 180 | RBC-n |
| 4-Methylphenol | 0.00000004 | 18 | RBC-n |
| 4-Nitrophenol | 0.0000002 | 29 | RBC-n |
| Acetophenone | 0.000001 | 0.021 | RBC-n |
| Ammonia | 0.00002 | 100 | RfC |
| Benzene | 0.00007 | 0.1 | CREG |
| Benzo(a)pyrene | 0.0000003 | 0.002 | RBC-c |
| Benzyl alcohol | 0.00000001 | 1,100 | RBC-n |
| Biphenyl | 0.000000004 | 180 | RBC-n |
| Bis(2-ethylhexyl)phthalate | 0.0000002 | 0.45 | RBC-c |
| Butylbenzylphthalate | 0.00000007 | 730 | RBC-n |
| Carbon dioxide | 0.1 | 9,000,000 | REL |
| Carbon monoxide | 0.0005 | 10,000 | NAAQS |
| Carbon tetrachloride | 0.0000005 | 0.07 | CREG |
| Dibenz(ah)anthracene | 0.0000001 | 0.00086 | RBC-c |
| Dibenzofurans | 0.0000001 | 150 | RBC-n |
| Diethylphthalate | 0.00000003 | 2,900 | RBC-n |
| Dimethylphthalate | 0.00000006 | 37,000 | RBC-n |
| Di-n-butylphthalate | 0.000006 | 370 | RBC-n |
| Di-n-octylphthalate | 0.0000001 | 73 | RBC-n |
| Diphenylamine | 0.000000006 | 91 | RBC-n |
| Naphthalene | 0.00001 | 10 | EMEG-c |
| Nitric oxide | 0.001 | 370 | RBC-n |
| Nitrogen dioxide | 0.0002 | 100 | NAAQS |
| N-Nitrosodiethylamine | 0.000000008 | 0.00002 | CREG |
| N-Nitrosodiphenylamine | 0.0000004 | 1.3 | RBC-n |
| Phenol | 0.000002 | 2,200 | RBC-n |
| Sulfur dioxide | 0.00002 | 80 | NAAQS |
| Vinyl chloride | 0.00000009 | 0.1 | CREG |
Notes:
- All estimated annual average ambient air concentrations are based on outputs from ATSDR's air quality modeling analysis (see Appendix D.3). The concentrations listed are the highest estimated levels in the residential areas of Vieques.
- Refer to Appendix D.3 for estimated ambient air concentrations for the 11 chemicals considered in the modeling analysis that do not have health-based comparison values. Estimated concentrations of these chemicals are all considerably lower than levels that air sampling methods can reliably detect.
- Refer to Appendix A for explanations of the abbreviations used to describe the comparison values.
| Chemical | Estimated Annual Average Ambient Air Concentration (µg/m3) | Health-Based Comparison Value (µg/m3) | Type of Comparison Value |
|---|---|---|---|
| Aluminum | 0.02 | 3.7 | RBC-n |
| Antimony | 0.000003 | 1.5 | RBC-n |
| Arsenic | 0.0000004 | 0.0002 | CREG |
| Barium | 0.00006 | 0.51 | RBC-n |
| Beryllium | 0.00000001 | 0.0004 | CREG |
| Boron | 0.0000008 | 210 | RBC-n |
| Cadmium | 0.00009 | 0.0006 | CREG |
| Chromium (total) | 0.00002 | 5,500 | RBC-n |
| Chromium (hexavalent) | 0.0000004 | 0.00008 | CREG |
| Cobalt | 0.0000006 | 0.03 | EMEG-i |
| Copper | 0.003 | 150 | RBC-n |
| Iron | 0.03 | 2,200 | RBC-n |
| Lead | 0.0001 | 1.5 | NAAQS |
| Manganese | 0.0007 | 0.04 | EMEG-i |
| Mercury | 0.00000001 | 0.2 | EMEG-i |
| Molybdenum | 0.0000004 | 18 | RBC-n |
| Nickel | 0.000006 | 0.2 | EMEG-i |
| Selenium | 0.00000005 | 18 | RBC-n |
| Strontium | 0.000007 | 2,200 | RBC-n |
| Tin | 0.0000002 | 2,200 | RBC-n |
| Titanium | 0.0001 | 31 | RBC-n |
| Vanadium | 0.000005 | 0.2 | EMEG-a |
| Zinc | 0.002 | 1,100 | RBC-n |
Notes:
- All estimated annual average ambient air concentrations are based on outputs from ATSDR's air quality modeling analysis (see Appendix D.3). The concentrations listed are the highest estimated levels in the residential areas of Vieques.
- Refer to Appendix D.3 for estimated ambient air concentrations for the metals considered in the modeling analysis that do not have health-based comparison values (e.g., calcium). Estimated levels of these chemicals are all considerably lower than air sampling methods can reliably detect.
- Refer to Appendix A for explanations of the abbreviations used to describe the comparison values.