PUBLIC HEALTH ASSESSMENT
This Web site is provided by the Agency for Toxic Substances and Disease Registry (ATSDR) ONLY as an historical reference for the public health community. It is no longer being maintained and the data it contains may no longer be current and/or accurate.
Y-12 Uranium Releases
OAK RIDGE RESERVATION (USDOE)
OAK RIDGE, ANDERSON COUNTY, TENNESSEE
III. EVALUATION OF ENVIRONMENTAL CONTAMINATION AND POTENTIAL EXPOSURE PATHWAYS (Cont.)
III.B.1.b. Past Chemical Effects
Past Exposure via Inhalation
Using the average air concentrations generated by the Task 6 team (converted from radioactivity values to mass units9), ATSDR calculated the average air concentrations of total uranium in Scarboro for each year from 1944 to 1995 and compared them to the ATSDR MRL for inhalation of insoluble uranium (see Table 12, Figure 19, and Figure 9). All the average air concentrations of uranium in Scarboro are less than 1% of the ATSDR MRL. As shown in Figure 19, the average annual air concentrations of total uranium are well below the inhalation MRL of 0.008 mg/m3 for every year. MRLs have built-in uncertainty or safety factors, making them considerably lower than levels at which health effects have been observed. Values below the MRL are not considered to be of health concern. Therefore, no further evaluation is required. Additionally, as noted previously in the past radiation effects section, the uranium air concentrations are most likely overestimated. Therefore, ATSDR concludes that residents living near Oak Ridge were not exposed to airborne uranium at levels that would cause harmful chemical effects.
Table 12. Estimated Average Annual Air Concentrations of Uranium in Scarboro
| Year | Total Uranium Concentration (mg/m3) | Is the concentration above the MRL? | Percent of MRL | Year | Total Uranium Concentration (mg/m3) | Is the concentration above the MRL? | Percent of MRL |
| 1944 | 3.2 × 10⁻⁶ | no | 0.04% | 1970 | 2.9 × 10⁻⁶ | no | 0.04% |
| 1945 | 6.6 × 10⁻⁶ | no | 0.08% | 1971 | 5.7 × 10⁻⁶ | no | 0.07% |
| 1946 | 3.8 × 10⁻⁶ | no | 0.05% | 1972 | 8.2 × 10⁻⁶ | no | 0.10% |
| 1947 | 2.5 × 10⁻⁶ | no | 0.03% | 1973 | 4.0 × 10⁻⁶ | no | 0.05% |
| 1948 | 6.4 × 10⁻⁶ | no | 0.08% | 1974 | 2.1 × 10⁻⁶ | no | 0.03% |
| 1949 | 6.4 × 10⁻⁶ | no | 0.08% | 1975 | 2.1 × 10⁻⁶ | no | 0.03% |
| 1950 | 6.4 × 10⁻⁶ | no | 0.08% | 1976 | 2.1 × 10⁻⁶ | no | 0.03% |
| 1951 | 6.4 × 10⁻⁶ | no | 0.08% | 1977 | 2.0 × 10⁻⁶ | no | 0.03% |
| 1952 | 6.4 × 10⁻⁶ | no | 0.08% | 1978 | 2.1 × 10⁻⁶ | no | 0.03% |
| 1953 | 4.0 × 10⁻⁵ | no | 0.50% | 1979 | 2.1 × 10⁻⁶ | no | 0.03% |
| 1954 | 3.7 × 10⁻⁵ | no | 0.47% | 1980 | 2.2 × 10⁻⁶ | no | 0.03% |
| 1955 | 3.7 × 10⁻⁵ | no | 0.47% | 1981 | 2.0 × 10⁻⁶ | no | 0.03% |
| 1956 | 2.9 × 10⁻⁵ | no | 0.36% | 1982 | 2.0 × 10⁻⁶ | no | 0.03% |
| 1957 | 2.4 × 10⁻⁵ | no | 0.30% | 1983 | 2.1 × 10⁻⁶ | no | 0.03% |
| 1958 | 5.4 × 10⁻⁵ | no | 0.68% | 1984 | 3.3 × 10⁻⁶ | no | 0.04% |
| 1959 | 6.0 × 10⁻⁵ | no | 0.75% | 1985 | 2.1 × 10⁻⁶ | no | 0.03% |
| 1960 | 9.3 × 10⁻⁶ | no | 0.12% | 1986 | 2.1 × 10⁻⁶ | no | 0.03% |
| 1961 | 1.3 × 10⁻⁵ | no | 0.16% | 1987 | 1.5 × 10⁻⁶ | no | 0.02% |
| 1962 | 1.4 × 10⁻⁵ | no | 0.17% | 1988 | 1.4 × 10⁻⁶ | no | 0.02% |
| 1963 | 2.1 × 10⁻⁵ | no | 0.26% | 1989 | 1.2 × 10⁻⁷ | no | <0.01% |
| 1964 | 2.6 × 10⁻⁵ | no | 0.33% | 1990 | 4.7 × 10⁻⁸ | no | <0.01% |
| 1965 | 6.3 × 10⁻⁶ | no | 0.08% | 1991 | 1.9 × 10⁻⁷ | no | <0.01% |
| 1966 | 9.1 × 10⁻⁶ | no | 0.11% | 1992 | 7.1 × 10⁻⁸ | no | <0.01% |
| 1967 | 3.3 × 10⁻⁶ | no | 0.04% | 1993 | 3.2 × 10⁻⁸ | no | <0.01% |
| 1968 | 4.4 × 10⁻⁶ | no | 0.05% | 1994 | 2.4 × 10⁻⁷ | no | <0.01% |
| 1969 | 2.5 × 10⁻⁶ | no | 0.03% | 1995 | 2.1 × 10⁻⁸ | no | <0.01% |
Source: ChemRisk 1999
None of the concentrations exceeded the ATSDR inhalation MRL of 0.008 mg/m3 (i.e., 8.0 × 10⁻³) for insoluble uranium.
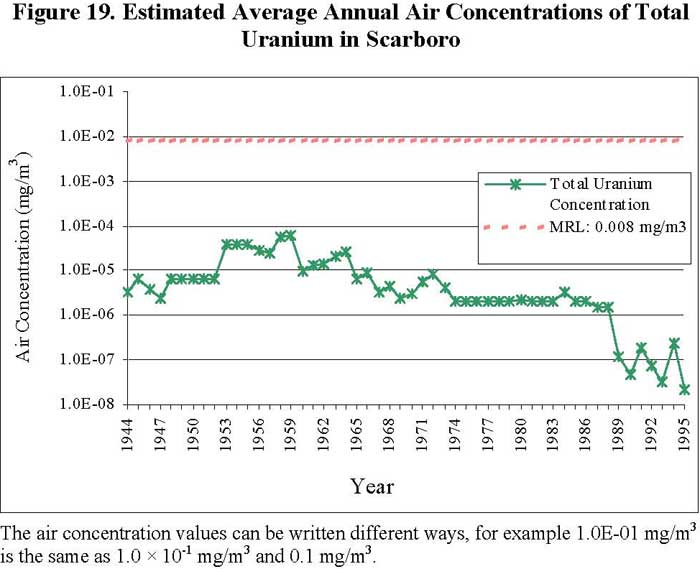
Figure 19. Estimated Average Annual Air Concentrations of Total Uranium in Scarboro
The Task 6 team calculated an annual average intake of uranium from 1944 to 1995 through both surface water and soil exposure pathways to residents of Scarboro. They considered (1) incidental ingestion of EFPC water, (2) ingestion of meat from livestock that drank water from EFPC, (3) ingestion of milk from dairy cows that drank water from EFPC, (4) consumption of fish from EFPC, (5) ingestion of soil, (6) consumption of meat from livestock that ingested soil, (7) consumption of milk from dairy cows that ingested soil, (8) consumption of vegetables grown in contaminated soil, (9) consumption of meat from livestock that ate pasture grown in contaminated soil, and (10) consumption of milk from dairy cows that ate pasture grown in contaminated soil (Figure 11 shows the exposure pathways evaluated).
ATSDR used the Task 6 annual average intakes of uranium to calculate past uranium doses for an adult male, adult female, 12-year-old child, and 6-year-old child for each year from 1944 to 1995 (see Table 13). Please see the Evaluating Exposures section (Section III.A.2.) for an explanation of how ATSDR calculated doses. As shown in Figure 20, the doses for several of the individual years exceeded ATSDR's intermediate-duration oral MRL for chemical toxicity of uranium (0.002 milligrams per kilogram per day; mg/kg/day). Remember that the MRL is a screening value. Calculated exposure doses higher than the MRL do not automatically mean harmful health effects will occur. Rather, they are an indication that ATSDR should further examine the harmful effect levels reported in the scientific literature and more fully review exposure potential. Therefore, because some of the estimated doses exceeded the MRL, ATSDR further investigated the toxicologic literature to find doses associated with known health effects.
The lowest oral (ingestion) dose of uranium that has caused the most sensitive harmful health effect (renal/kidney toxicity in rabbits) considered to be of relevance to humans was 0.05 mg/kg/day (ATSDR 1999a). The rabbit is the mammalian species most sensitive to uranium kidney toxicity and is likely to be even more sensitive than humans (ATSDR 1999a). Therefore, ATSDR is comfortable with extrapolating the results from this animal toxicity study to humans. This oral uranium dose of 0.05 mg/kg/day is the minimum lowest-observed-adverse-effect level (LOAEL) that is used by ATSDR to derive the MRL for intermediate-duration oral exposure to uranium. This intermediate-duration oral MRL is also protective for chronic-duration oral exposure because renal effects of uranium exposure are more dependent on the dose than on the duration of exposure (ATSDR 1999a). All the estimated past uranium doses from ingestion of uranium via the soil and surface water pathways in Table 13 and Figure 20 are well below the LOAEL of 0.05 mg/kg/day at which renal effects have been observed in rabbits (ATSDR 1999a) (see Figure 8). Therefore, ATSDR concludes that residents living near Oak Ridge were not exposed to uranium at levels that would cause harmful chemical effects.
Table 13. Estimated Average Annual Doses from Ingestion of Uranium via the Soil and Surface Water Pathways (1944-1995)
| Year | Annual Average Intake (mg/d) | Dose (mg/kg/day) | Is the dose above the MRL? | ||||||
| Adult Male | Adult Female | 12-yr Child | 6-yr Child | Adult Male | Adult Female | 12-yr Child | 6-yr Child | ||
| 1944 | 0.273 | 3.5 � 10-3 | 3.9 � 10-3 | 6.1 � 10-3 | 1.2 � 10-2 | Yes | Yes | yes | yes |
| 1945 | 0.069 | 8.9 � 10-4 | 9.7 � 10-4 | 1.5 � 10-3 | 3.0 � 10-3 | No | No | no | yes |
| 1946 | 0.061 | 7.8 � 10-4 | 8.6 � 10-4 | 1.4 � 10-3 | 2.7 � 10-3 | No | No | no | yes |
| 1947 | 0.066 | 8.5 � 10-4 | 9.4 � 10-4 | 1.5 � 10-3 | 2.9 � 10-3 | No | No | no | yes |
| 1948 | 0.026 | 3.4 � 10-4 | 3.7 � 10-4 | 5.9 � 10-4 | 1.1 � 10-3 | No | No | no | no |
| 1949 | 0.050 | 6.5 � 10-4 | 7.1 � 10-4 | 1.1 � 10-3 | 2.2 � 10-3 | No | No | no | yes |
| 1950 | 0.015 | 2.0 � 10-4 | 2.2 � 10-4 | 3.4 � 10-4 | 6.7 � 10-4 | No | No | no | no |
| 1951 | 0.016 | 2.1 � 10-4 | 2.3 � 10-4 | 3.6 � 10-4 | 7.1 � 10-4 | No | No | no | no |
| 1952 | 0.016 | 2.1 � 10-4 | 2.3 � 10-4 | 3.6 � 10-4 | 7.1 � 10-4 | No | No | no | no |
| 1953 | 0.075 | 9.6 � 10-4 | 1.1 � 10-3 | 1.7 � 10-3 | 3.3 � 10-3 | No | No | no | yes |
| 1954 | 0.075 | 9.6 � 10-4 | 1.1 � 10-3 | 1.7 � 10-3 | 3.3 � 10-3 | No | No | no | yes |
| 1955 | 0.139 | 1.8 � 10-3 | 2.0 � 10-3 | 3.1 � 10-3 | 6.1 � 10-3 | No | No | yes | yes |
| 1956 | 0.170 | 2.2 � 10-3 | 2.4 � 10-3 | 3.8 � 10-3 | 7.4 � 10-3 | Yes | Yes | yes | yes |
| 1957 | 0.308 | 4.0 � 10-3 | 4.3 � 10-3 | 6.8 � 10-3 | 1.3 � 10-2 | Yes | Yes | yes | yes |
| 1958 | 0.198 | 2.5 � 10-3 | 2.8 � 10-3 | 4.4 � 10-3 | 8.6 � 10-3 | Yes | Yes | yes | yes |
| 1959 | 0.125 | 1.6 � 10-3 | 1.8 � 10-3 | 2.8 � 10-3 | 5.4 � 10-3 | No | No | yes | yes |
| 1960 | 0.138 | 1.8 � 10-3 | 1.9 � 10-3 | 3.1 � 10-3 | 6.0 � 10-3 | No | No | yes | yes |
| 1961 | 0.104 | 1.3 � 10-3 | 1.5 � 10-3 | 2.3 � 10-3 | 4.5 � 10-3 | No | No | yes | yes |
| 1962 | 0.084 | 1.1 � 10-3 | 1.2 � 10-3 | 1.9 � 10-3 | 3.7 � 10-3 | No | No | no | yes |
| 1963 | 0.103 | 1.3 � 10-3 | 1.4 � 10-3 | 2.3 � 10-3 | 4.5 � 10-3 | No | No | yes | yes |
| 1964 | 0.201 | 2.6 � 10-3 | 2.8 � 10-3 | 4.5 � 10-3 | 8.7 � 10-3 | Yes | Yes | yes | yes |
| 1965 | 0.104 | 1.3 � 10-3 | 1.5 � 10-3 | 2.3 � 10-3 | 4.5 � 10-3 | No | No | yes | yes |
| 1966 | 0.108 | 1.4 � 10-3 | 1.5 � 10-3 | 2.4 � 10-3 | 4.7 � 10-3 | No | No | yes | yes |
| 1967 | 0.138 | 1.8 � 10-3 | 1.9 � 10-3 | 3.1 � 10-3 | 6.0 � 10-3 | No | No | yes | yes |
| 1968 | 0.154 | 2.0 � 10-3 | 2.2 � 10-3 | 3.4 � 10-3 | 6.7 � 10-3 | No | Yes | yes | yes |
| 1969 | 0.046 | 5.9 � 10-4 | 6.5 � 10-4 | 1.0 � 10-3 | 2.0 � 10-3 | No | No | no | no |
| 1970 | 0.085 | 1.1 � 10-3 | 1.2 � 10-3 | 1.9 � 10-3 | 3.7 � 10-3 | No | No | no | yes |
| 1971 | 0.045 | 5.8 � 10-4 | 6.4 � 10-4 | 1.0 � 10-3 | 2.0 � 10-3 | No | No | no | no |
| 1972 | 0.068 | 8.7 � 10-4 | 9.5 � 10-4 | 1.5 � 10-3 | 2.9 � 10-3 | No | No | no | yes |
| 1973 | 0.014 | 1.8 � 10-4 | 2.0 � 10-4 | 3.1 � 10-4 | 6.1 � 10-4 | No | No | no | no |
| 1974 | 0.014 | 1.8 � 10-4 | 2.0 � 10-4 | 3.1 � 10-4 | 6.1 � 10-4 | No | No | no | no |
| 1975 | 0.015 | 1.9 � 10-4 | 2.1 � 10-4 | 3.3 � 10-4 | 6.4 � 10-4 | No | No | no | no |
| 1976 | 0.012 | 1.5 � 10-4 | 1.6 � 10-4 | 2.6 � 10-4 | 5.1 � 10-4 | No | No | no | no |
| 1977 | 0.006 | 8.2 � 10-5 | 9.0 � 10-5 | 1.4 � 10-4 | 2.8 � 10-4 | No | No | no | no |
| 1978 | 0.004 | 4.6 � 10-5 | 5.1 � 10-5 | 8.0 � 10-5 | 1.6 � 10-4 | No | No | no | no |
| 1979 | 0.003 | 4.3 � 10-5 | 4.8 � 10-5 | 7.5 � 10-5 | 1.5 � 10-4 | No | No | no | no |
| 1980 | 0.002 | 2.7 � 10-5 | 3.0 � 10-5 | 4.7 � 10-5 | 9.1 � 10-5 | No | No | no | no |
| 1981 | 0.013 | 1.7 � 10-4 | 1.8 � 10-4 | 2.9 � 10-4 | 5.7 � 10-4 | No | No | no | no |
| 1982 | 0.015 | 1.9 � 10-4 | 2.1 � 10-4 | 3.2 � 10-4 | 6.4 � 10-4 | No | No | no | no |
| 1983 | 0.022 | 2.8 � 10-4 | 3.1 � 10-4 | 4.9 � 10-4 | 9.6 � 10-4 | No | No | no | no |
| 1984 | 0.028 | 3.6 � 10-4 | 4.0 � 10-4 | 6.2 � 10-4 | 1.2 � 10-3 | No | No | no | no |
| 1985 | 0.014 | 1.8 � 10-4 | 2.0 � 10-4 | 3.1 � 10-4 | 6.1 � 10-4 | No | No | no | no |
| 1986 | 0.013 | 1.7 � 10-4 | 1.8 � 10-4 | 2.9 � 10-4 | 5.7 � 10-4 | No | No | no | no |
| 1987 | 0.066 | 8.5 � 10-4 | 9.3 � 10-4 | 1.5 � 10-3 | 2.9 � 10-3 | No | No | no | yes |
| 1988 | 0.019 | 2.5 � 10-4 | 2.7 � 10-4 | 4.3 � 10-4 | 8.4 � 10-4 | No | No | no | no |
| 1989 | 0.005 | 6.7 � 10-5 | 7.3 � 10-5 | 1.2 � 10-4 | 2.3 � 10-4 | No | No | no | no |
| 1990 | 0.005 | 6.7 � 10-5 | 7.3 � 10-5 | 1.2 � 10-4 | 2.3 � 10-4 | No | No | no | no |
| Number of years the dose is above the MRL (0.002 mg/kg/day) | 5 | 6 | 14 | 24 | |||||
| Number of years the dose is above the LOAEL (0.05 mg/kg/day) | 0 | 0 | 0 | 0 | |||||
Source: ChemRisk 1999
Doses were calculated using the following formula: Dose = Intake
/ Body Weight assuming an adult male weighed 78 kg; an adult female, 71 kg;
a 12-year-old child, 45 kg; and a 6-year-old child, 23 kg.
The LOAEL is the lowest-observed-adverse-effect level.
The dose of 0.05 mg/kg/day is the minimal LOAEL from a study in which an increased
incidence of renal toxicity (specifically, anisokaryosis and nuclear vesiculation)
was observed in New Zealand rabbits. The rabbit is the mammalian species most
sensitive to uranium toxicity and is likely to be even more sensitive than humans.
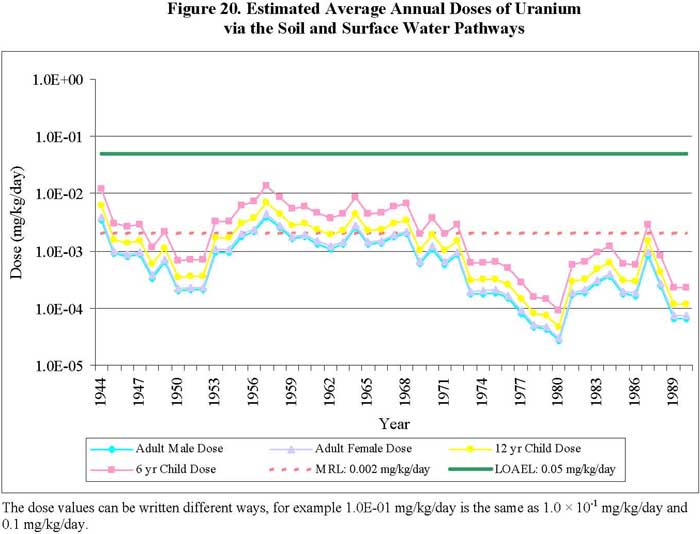
Figure 20. Estimated Average Annual Doses of Uranium via the Soil and Surface Water Pathways
For some of the same reasons described previously in the Past Radiation Effects section (Section III.B.1.a.), the past ingestion doses of uranium (as shown in Table 13 and Figure 20) are overestimated. The annual intakes were calculated using the same overestimated EFPC floodplain soil concentrations in place of actual Scarboro soil concentrations (converted from radioactivity values to mass units10). The uranium concentrations in the Scarboro soil are at least 8.6 times less than the EFPC floodplain soil (see Figure 21). Also, the calculated ingestion doses are based on potential exposures from recreating in EFPC, eating fish from EFPC, eating livestock raised in the EFPC floodplain, drinking milk from dairy cows raised in the EFPC floodplain, and eating homegrown vegetables grown in the EFPC floodplain. Livestock are only allowed within the city limits in limited zoning areas and EFPC is not a very productive fishing location. Very few people frequently ate livestock raised in the floodplain, fish from the creek, or vegetables grown in the floodplain over a prolonged period of time. A person's exposure is actually much lower if the person did not frequently engage in these activities over a prolonged period of time.
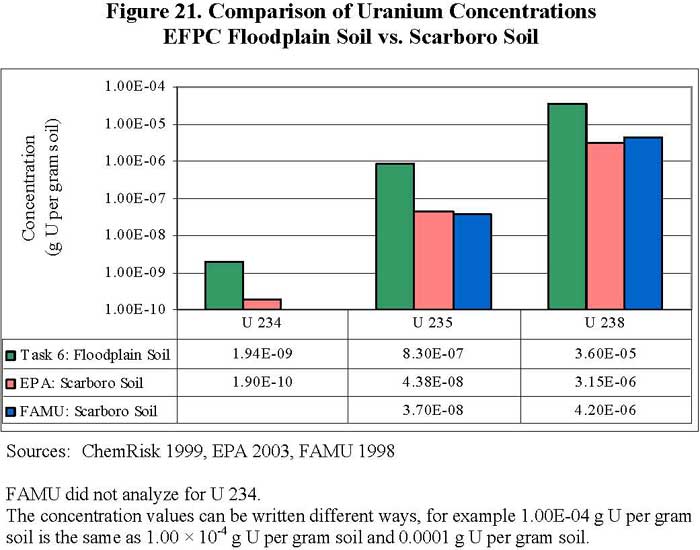
Figure 21. Comparison of Uranium Concentrations - EFPC Floodplain Soil vs. Scarboro Soil
Given that the past average annual doses of uranium (shown in Table 13) are overestimated and that they are below levels at which health effects have been observed in the mammalian species most sensitive to uranium toxicity, ATSDR does not expect that people living in communities near the Y-12 plant, including in the reference community (i.e., the residents of Scarboro), have ingested levels of uranium via the soil and surface water exposure pathways that would have resulted in harmful chemical effects.
III.B.2. Current Exposure (1995 to 2002)
This section discusses the current uranium exposures from 1995 to 2002 to residents living near ORR. This evaluation primarily relies on data supplied by the Oak Ridge Environmental Information System (OREIS), a centralized, standardized, quality-assured, and configuration-controlled environmental data management system that is publicly available. Data from FAMU (1998) and EPA (2003) were also used to supplement the evaluation.
Meteorological data indicates that the predominate winds at the Y-12 plant are generally up and down Bear Creek valley, between Pine Ridge and Chestnut Ridge with limited winds crossing over the ridge. This would result in most of the uranium released from Y-12 to deposit in Bear Creek valley and Union valley. However, no one lives in these two valleys. The city of Oak Ridge is the community that could have been impacted by Y-12 uranium releases. In this evaluation of current exposures, the Scarboro community is used as a reference location that represents the city of Oak Ridge. Additionally, the Scarboro community was selected as the reference population after air dispersion modeling indicated that its residents were expected to have received the highest exposures (ChemRisk 1999). The Task 6 report stated that "while other potentially exposed communities were considered in the selection process, the reference locations [Scarboro] represent residents who lived closest to the ORR facilities and would have received the highest exposures from past uranium releases...Scarboro is the most suitable for screening both a maximally and typically exposed individual" (ChemRisk 1999). Therefore, in this evaluation, conclusions regarding exposures to Scarboro residents are also applicable to other residents living in the city of Oak Ridge.
ATSDR determined that current exposures to uranium can include the following pathways: (1) ingestion of soils, (2) ingestion of foods, (3) ingestion of water from nearby creeks, (4) inhalation of air, and (5) external exposure from uranium in soils.
Based on our review of data collected in and around the reference location (Scarboro), ATSDR has determined that the presence of uranium is not a public health hazard to people living near the Y-12 plant.
III.B.2.a. Current Radiation Effects
The current radiation CEDE11 received by the reference population, the Scarboro community, from exposure to uranium through ingestion of soil and vegetables and inhalation of air is 0.216 mrem over 70 years (see Table 14). This current radiation dose (0.216 mrem) to the residents of Scarboro is well below (23,000 times less than) the radiogenic cancer comparison value of 5,000 mrem over 70 years (see Figure 12). ATSDR derived this CEDE after reviewing the peer-reviewed literature and other documents developed to review the health effects of ionizing radiation (Appendix D contains more information about ATSDR's derivation of the radiogenic cancer comparison value of 5,000 mrem over 70 years). The CEDE assumes that from the intake of uranium, the entire radiation dose (a 70-year dose, in this case) is received in the first year following the intake. Doses below this value are not expected to result in adverse health effects. Therefore, ATSDR does not expect carcinogenic health effects to have occurred from radiation doses received from current uranium exposures in Scarboro.
To evaluate noncancer health effects from the current uranium radiation dose (CEDE of 0.216 mrem over 70 years) estimated to be received by the Scarboro community, an approximation can be made to compare the CEDE of 0.216 mrem, which is based on 70 years of exposure, to the ATSDR chronic exposure MRL for ionizing radiation (100 mrem/year), which is based on one year of exposure. The CEDE of 0.216 mrem over 70 years could be divided by 70 years to approximate a value of 0.003 mrem as the radiation dose for the first year, which is well below (33,000 times less than) the 100 mrem/year ATSDR chronic exposure MRL for ionizing radiation (see Figure 12). ATSDR MRLs are based on noncancer health effects only and are not based on a consideration of cancer effects. The ATSDR MRL for chronic ionizing radiation exposure is derived by dividing the average annual effective dose to the U.S. population (360 mrem/year) by a safety factor of 3 to account for human variability (ATSDR 199b). The average U.S. annual effective dose of 360 mrem/year is obtained mainly from naturally occurring radioactive material, medical uses of radiation, and radiation from consumer products (see Figure 12) (BEIR V 1990 as cited in ATSDR 1999b). This annual effective dose of 360 mrem/year has not been associated with adverse health effects in humans or animals (ATSDR 1999b). ATSDR believes the chronic ionizing radiation MRL of 100 mrem/year is below levels that might cause adverse health effects in people most sensitive to such effects; therefore, ATSDR does not expect noncancer health effects to have occurred from radiation doses received from current uranium exposure for communities near the Y-12 plant.
Table 14. Current Uranium Radiation Dose to the Scarboro Community
| Exposure Pathway | Committed Effective Dose Equivalents (mrem) |
| Inhalation of air in Scarboro | 3.95 × 10⁻² |
| Soil ingestion by a 1-year old Scarboro resident | 3.97 × 10⁻² |
| Ingestion of vegetables from a private garden | 1.37 × 10⁻¹ |
| Summed Radiation Dose | 2.16 × 10⁻¹ |
The radiation doses calculated by ATSDR as resulting from the internal deposition of uranium include the background contribution of uranium typically in the body from other natural sources.
Current Air Exposure Pathway
Operations at the Y-12 plant continue to release materials to the atmosphere. In addition to monitoring the release of uranium from exhaust ventilation systems at the source, DOE has established a series of perimeter air monitoring stations around the reservation, including air monitoring station 46 located in Scarboro west of the Scarboro Community Center. ATSDR reviewed air data accumulated since 199512 from four on-site perimeter air monitoring stations, two off-site remote air monitoring stations, and two off-site perimeter air monitoring stations located in Scarboro and the city of Oak Ridge. ATSDR used these values to assess the current radiation impact of inhaling air containing uranium13 (see Figure 22 for the locations of the air monitoring stations and Figure 27 for a comparison of the air concentrations).

Figure 22. Locations of Air Monitoring Stations
To estimate the radiation dose, the isotopic activity was evaluated using the appropriate ICRP dose coefficient and a protective inhalation rate. The EPA Exposure Factors Handbook recommends an inhalation rate of 8.7 cubic meters per day (m3/day) for a child 1 to 12 years of age and an average inhalation rate of 13.25 m3/day for adults (EPA 1997). For the assessment, ATSDR used a slightly more conservative inhalation rate of 15.25 m3/day (i.e., 5.5 million liters/year) for adults. Radiation doses resulting from the inhalation pathway are presented in Table 15. As shown in Table 15, people living in the reference location, Scarboro, are expected to inhale sufficient uranium to impart a CEDE of 3.95 × 10⁻² mrem. The table also indicates other monitoring stations as reference points. For example, Stations 51 and 52 are considered background stations not impacted by Y-12 releases. The on-site stations indicate air concentrations of uranium at the perimeter of the facility.
Furthermore, as the uranium inhaled is considered insoluble, the organ receiving the greatest radiation dose would be the lung. Therefore, ATSDR also calculated radiation doses to the lung. These doses to the lung are not at levels known to cause any adverse health outcomes.
Table 15. Estimated Current Total Radiation Doses from Inhalation of Uranium
| Station | Whole Body Dose (mrem) | Lung Dose (mrem) |
| 1 (on-site perimeter monitor) | 4.18 × 10⁻² | 3.47 × 10⁻¹ |
| 37 (on-site perimeter monitor) | 2.40 × 10⁻² | 1.99 × 10⁻¹ |
| 38 (on-site perimeter monitor) | 2.13 × 10⁻² | 1.77 × 10⁻¹ |
| 40 (on-site perimeter monitor) | 7.94 × 10⁻² | 6.59 × 10⁻¹ |
| 41 (city of Oak Ridge) | 4.79 × 10⁻² | 3.98 × 10⁻¹ |
| 46 (Scarboro) | 3.95 × 10⁻² | 3.28 × 10⁻¹ |
| 51 (Norris Dam) | 9.31 × 10⁻³ | 7.73 × 10⁻² |
| 52 (Fort Loudoun Dam) | 1.68 × 10⁻² | 1.40 × 10⁻¹ |
Values are expressed as committed effective dose equivalents
(CEDE).
Total uranium doses were calculated using the average concentrations for the
data available since 1995, except the doses for Station 41 were calculated using
the average concentration for data from 1986 to 1991.
Current Surface Water Exposure Pathway
To evaluate current exposures to uranium through the surface water pathway, ATSDR analyzed available surface water data taken from 1995 to 2002 at off-site locations (Scarboro drainage ditches and Lower EFPC) and for comparison, three on-site locations (Upper EFPC, Bear Creek, and the on-site portion of Lower EFPC after it joins with Bear Creek) (see Figure 23). As shown on Figure 23, the Upper EFPC, located entirely on the reservation, originates and flows through the Y-12 plant to the eastern site boundary and into Lower EFPC. Lower EFPC flows north from the Y-12 plant off site through the business and residential sections of city of Oak Ridge, but does not flow through Scarboro. After flowing through Oak Ridge for about 12 miles, Lower EFPC enters the ORR site again on the western end of the city and joins Poplar Creek, which flows to the Clinch River near the K-25 site. Bear Creek, also located entirely on the site, originates on the western end of the Y-12 plant and flows southwest to join Lower EFPC near the K-25 site. While access to the three on-site locations is restricted, the public has access to the portion of Lower EFPC that flows through the city. However, the creek appears to be too shallow for swimming, and the state has issued a fishing advisory for EFPC that warns the public to avoid eating fish from the creek and to avoid contact with the water. The Scarboro surface water samples analyzed by FAMU and EPA in 1998 and 2001, were collected from drainage ditches in Scarboro. Also, Scarboro is located at a higher elevation along Pine Ridge than the EFPC floodplain, thus, surface water in Scarboro flows into EFPC.
Table 16 shows the mean total uranium concentrations for surface water samples collected from 1995 to 2002 at the two off-site locations and the three on-site locations. The mean uranium concentrations (0.197 µg/L) in surface water from Scarboro ditches are well below (100 times less than) the ATSDR EMEG of 20 µg/L for highly soluble uranium salts (see Table 2). The ATSDR EMEG is a nonenforceable, health-based comparison value developed for screening environmental contaminants for further evaluation. The EMEG reflects a concentration that is much lower than those that have been observed to cause adverse health effects. As a result, exposure to concentrations at or below ATSDR's comparison values are not considered to warrant health concern. Even though the mean uranium concentrations are above ATSDR's EMEG of 20 µg/L in Upper EFPC and Bear Creek (on-site locations with access restricted), the mean uranium concentrations decrease to below the EMEG in the off-site portions of Lower EFPC. The total uranium mean concentration in Bear Creek decreases dramatically after joining with Lower EFPC. The total uranium mean concentrations in Scarboro and in the off-site areas of Lower EFPC are below ATSDR's EMEG; therefore, the concentrations of uranium that people might be exposed to are not of health concern.
Table 16. Total Uranium Concentrations in EFPC and Bear Creek
| Location | Mean Concentration (µg/L) | Is the mean above the EMEG of 20 µg/L? |
| Scarboro drainage ditches (off site) | 0.197 | no |
| Upper EFPC (on site) | 33.5 | yes |
| Lower EFPC (off site) | 12.8 | no |
| Bear Creek (on site) | 159 | yes |
| Lower EFPC (on site after joining with Bear Creek) | 8.4 | no |
Source: EPA 2003; FAMU 1998; OREIS
In addition, the mean total uranium concentrations in Scarboro and Lower EFPC are below EPA's maximum contaminant level (MCL) for uranium (30 �g/L). The MCL is the level of a contaminant that is allowed in drinking water. EFPC, however, is not used as a drinking water source. The city of Oak Ridge, including the community of Scarboro, is served by municipal water obtained from the Clinch River (Melton Hill Lake), upstream from the reservation.
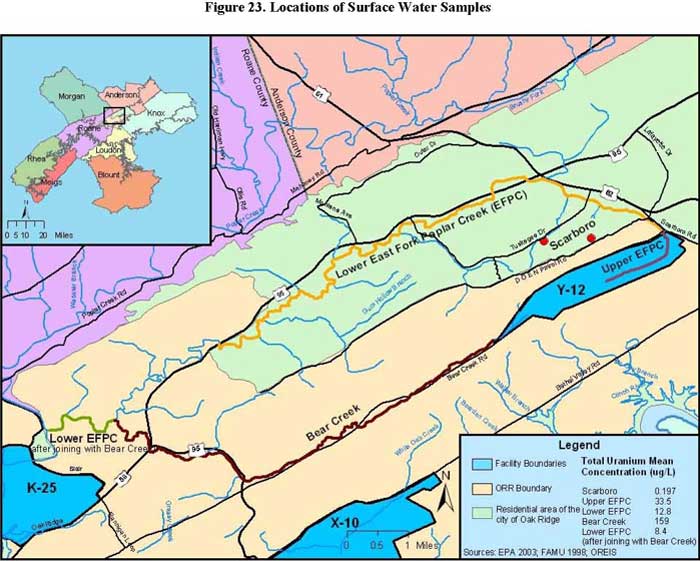
Figure 23. Locations of Surface Water Samples
In 1997, residents of Scarboro and the local chapter of the National Association for the Advancement of Colored People (NAACP) raised concerns that activities at the Y-12 plant could have produced enriched uranium in Scarboro soils. Enriched uranium contains higher than normal amounts of U 235 as compared to natural uranium and is more radioactive than naturally occurring uranium. Therefore, enrichment is a measure of the mass percentage of U 235 in the final product; that is, the percentage of U 235 is elevated above that commonly found in nature relative to the other naturally occurring uranium isotopes. The degree of enrichment is determined by the use, not necessarily by the radioactivity of the sample. The detection and identification of enriched uranium, however, can be difficult in environmental samples, especially because the typical levels of U 235 are low in natural soils. In response to the concerns expressed by the residents and the NAACP, FAMU collected soil and water samples for the analysis of uranium and other radionuclides (FAMU 1998).
 The results of the FAMU study were released in 1998. In 1999, EPA proposed
a study to validate the FAMU results and released their findings in 2003 (EPA
2003). Each of these studies only collected samples in the Scarboro community,
thus no comparison to other areas of Oak Ridge were made14. To address exposure
to the soil pathway, ATSDR evaluated soil data recently collected in the reference
location, Scarboro. ATSDR compared these Scarboro soil data to national background
values, as well as to soil samples collected by DOE for the Background Soil
Characterization Project in the Oak Ridge area (DOE 1993). During this background
characterization project, DOE collected soil samples from uncontaminated areas
on ORR, as well as from areas off site.
The results of the FAMU study were released in 1998. In 1999, EPA proposed
a study to validate the FAMU results and released their findings in 2003 (EPA
2003). Each of these studies only collected samples in the Scarboro community,
thus no comparison to other areas of Oak Ridge were made14. To address exposure
to the soil pathway, ATSDR evaluated soil data recently collected in the reference
location, Scarboro. ATSDR compared these Scarboro soil data to national background
values, as well as to soil samples collected by DOE for the Background Soil
Characterization Project in the Oak Ridge area (DOE 1993). During this background
characterization project, DOE collected soil samples from uncontaminated areas
on ORR, as well as from areas off site.
To evaluate the results of EPA's and FAMU's sampling for public health implications, ATSDR compared the isotopic composition of the uranium in Scarboro soil to the isotopic composition found in naturally occurring uranium. ATSDR also compared the isotope ratio to see if these could indicate elevated uranium, even if the concentrations appeared typical. The EPA isotopic analyses of Scarboro soil indicated that the average radioactivity concentrations were 1.2 picocuries per gram (pCi/g) for U 234, 0.1 pCi/g for U 235, and 1.0 pCi/g for U 238. The isotopic ratio of U 235/U 238 suggested that the radioactivity concentration of U 235 in Scarboro soil was elevated greater than typical concentrations found in nature (see Table 17). Based on an initial observation, the U 235 detected in Scarboro soil appears to be representative of enriched uranium as the isotopic ratio of U 235/U 238 is larger (0.096) than the expected isotopic ratio (0.047) in nature. However, the ratio of the activities can be misleading because the activity of U 235 detected was close to the detection limit and the associated uncertainty of the measurement was large, in some cases 75% of the measured value.
Table 17. Comparison of the Ratio of Isotopic Activities for Uranium in Scarboro Soil to Naturally Occurring Uranium
| U 234 | U 235 | U 238 | |
| Scarboro soil concentration | 1.2 pCi/g | 0.1 pCi/g | 1.0 pCi/g |
| Isotopic ratio in Scarboro soil | 1.16 (U 234/U 238) | 0.096 (U 235/U 238) | |
| Isotopic ratio in nature | 0.972 (U 234/U 238) | 0.047 (U 235/U 238) |
Source: EPA 2003
Not shown in the table is the considerable uncertainty in the U 235 measurement. This uncertainty is a function of the amount of U 235 found in nature and the method of analysis.
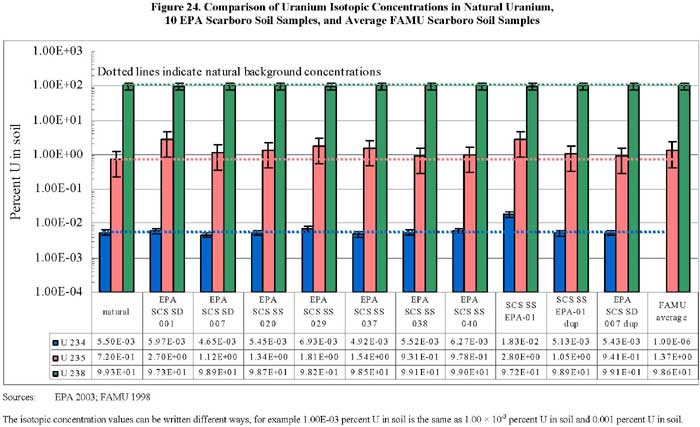
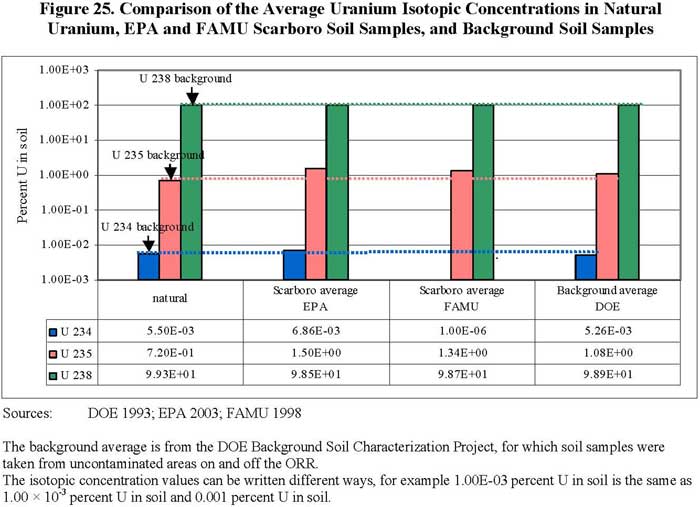
Therefore, the next step was to determine if the U 235, as a percentage of total uranium, was significantly elevated, which would indicate the presence of enriched uranium. ATSDR converted the measured uranium activity levels obtained from the FAMU and EPA studies to mass units15. ATSDR then compared the results of both EPA's (EPA 2003) and FAMU's (FAMU 1998) sampling efforts to measured soil background concentrations reported by DOE (DOE 1993). ATSDR also compared the results to the established isotopic abundance of the three uranium isotopes. The results of this evaluation are shown in Figure 24. This figure shows the isotopic concentrations of uranium, expressed as a percent of uranium isotopes in soil, in naturally occurring uranium, 10 Scarboro soil and sediment samples from the EPA study, and the average uranium concentrations in Scarboro soil samples from the FAMU study. The dotted lines at 0.005% (U 234), 0.72% (U 235), and 99.2% (U 238) represent the percent abundance of the uranium isotopes in nature. The error bars represent the uncertainties associated with the analyses of the uranium measurements. The data show that two of the EPA samples (sd 007 and ss EPA 1) including the uncertainty, appear to be above the U 235 concentrations found in nature. However, closer evaluation of EPA samples SS EPA 1 and SS EPA 1 dup (a duplicate sample) shows that the uncertainty of these samples is within the range of naturally occurring U 235. Therefore, ATSDR considers only one EPA sample (sd 001) slightly in excess of the naturally occurring concentrations of U 235. Figure 25 compares the uranium isotopic concentrations in naturally occurring uranium to the average uranium isotopic concentrations in soil samples from Scarboro (EPA and FAMU studies) and in background soil samples from uncontaminated areas on and off the ORR (DOE study).
The overall results indicate that the concentrations of uranium detected in the Scarboro community by EPA and FAMU are indistinguishable from the background concentrations of uranium in the area around Oak Ridge. Furthermore, the percentages of total uranium in the Scarboro community are essentially identical to the percentages of total uranium found in nature. However, the Oak Ridge area appears to contain more U 235 than typically found in nature.
Concern has also been expressed that the Scarboro community has been impacted by uranium releases to EFPC. To evaluate this concern, ATSDR evaluated the location and surface elevation of Scarboro and EFPC. Lower EFPC flows north from the Y-12 plant off site through the business and residential sections of city of Oak Ridge, but does not flow through Scarboro. At its closest point, the EFPC passes about 0.4 miles to the northeast of the populated areas of Scarboro (ChemRisk 1999b). Also, Scarboro is located at a higher elevation along Pine Ridge than the EFPC floodplain, and Scarboro does not receive surface water from the EFPC. In addition, ATSDR compared the average uranium isotopic ratios (U 234/U 238; U 235/U 238) of Scarboro soil and EFPC floodplain soil from off-site areas to that of natural occurring uranium. The isotopic ratios are shown in Table 18.
Table 18. Comparison of the Average Uranium Isotopic Ratios in Scarboro Soil, EFPC Floodplain Soil, and Natural Uranium
| Location | U 234/U 238 | U 235/U 238 |
| Scarboro | 4.79 × 10⁻⁵ | 0.01 |
| EFPC | 2.84 × 10⁻⁵ | 0.004 |
| Natural | 5.54 × 10⁻⁵ | 0.0072 |
Sources: ChemRisk 1999; DOE 1993; EPA 2003; FAMU 1998; OREIS
The ratios are based on the percentages of the specific isotopes found in nature,
not their radioactivity.
These data suggest that the ratio of U 234/U 238 in Scarboro soil is elevated over the ratio found in EFPC floodplain soils; however, the ratios for both locations are less than the ratio typically found in nature. The percentages of uranium in the Scarboro community are essentially identical to the amount of uranium found in nature; nonetheless, the Oak Ridge area may contain more U 235 than typically found in nature. However, the ratio of U 235/U 238 in Scarboro soil is not elevated over those found in the EFPC floodplain or in nature. The uranium content in soils within the Scarboro community is representative of uranium found in areas not impacted by Y-12 operations; that is, the soils in Scarboro are not contaminated by atmospheric releases related to ORR operations.
Additionally, in 1993, ATSDR scientists released a public health consultation that evaluated the environmental sampling data from EFPC to determine the public health implications of past and current Y-12 plant releases into the creek. ATSDR concluded that the concentrations of uranium and other radionuclides detected in soil, sediment, surface water, and fish from EFPC were not present at levels of public health concern (ATSDR 1993b).
Typically, the proportion of a population exposed to contaminated soils is identified by estimating the area of contaminant dispersion and then determining the population within the contaminated area. Furthermore, the population can be characterized by identifying individuals who are more likely to ingest soil (i.e., children). However, the entire population in the contaminated area may ingest some soil. People incidentally (accidentally) ingest soil when they use their hands to handle food that they eat, smoke cigarettes, or put their fingers in their mouths because soil or dust particles can adhere to food, cigarettes, and hands. Children are particularly sensitive because they are likely to ingest more soil than adults. Displaying hand-to-mouth behavior is a normal phase of childhood and therefore children have more opportunities to ingest soil than adults do.
For the purposes of this assessment, ATSDR evaluated soil ingestion for Scarboro children (assuming they incidentally ingest 100 mg/day) and their resulting uranium CEDEs over a period of 70 years. For this scenario, ATSDR chose dose coefficients for an infant as these would result in the highest dose to a child who might ingest soils at various ingestion rates. Furthermore, as the uranium ingested is considered insoluble, the organ receiving the greatest radiation dose would be the bone (see Table 19). Therefore, ATSDR calculated uranium CEDEs to both the bone and the whole body. These radiation doses to the bone and whole body are well below the ATSDR radiogenic cancer comparison value of 5,000 mrem over 70 years and are not at levels known to cause any adverse health outcomes.
Table 19. Uranium Radiation Doses Following Soil Ingestion by a 1-year old Scarboro Resident at Each Sample Location
| Sample Location | Bone (mrem) | Whole body (mrem) |
| S. Benedict 1 | 4.37 × 10⁻¹ | 3.05 × 10⁻² |
| S. Dillard | 6.02 × 10⁻¹ | 4.17 × 10⁻² |
| S. Fisk | 5.96 × 10⁻¹ | 4.15 × 10⁻² |
| Parcel | 6.27 × 10⁻¹ | 4.38 × 10⁻² |
| S. Benedict | 6.12 × 10⁻¹ | 4.25 × 10⁻² |
| Spellman | 7.34 × 10⁻¹ | 5.11 × 10⁻² |
| Hampton | 5.56 × 10⁻¹ | 3.88 × 10⁻² |
| Bennett Lane | 3.85 × 10⁻¹ | 2.73 × 10⁻² |
| Average | 5.69 × 10⁻¹ | 3.97 × 10⁻² |
The dose is the CEDEs expected to be received over a period of 70 years following an intake. It is based on the ingestion of 100 milligrams of soil daily for the course of one year.
When uptake into plants is possible, the identification of populations that are exposed or potentially exposed through consumption of contaminated plants is evaluated. Because of the chemical nature and solubility in water, uranium oxides, the form of uranium released from the Y-12 plant (ChemRisk 1999), are not readily taken up by plants (Dreesen et al. 1982; Moffett and Tellier 1977 as cited in ATSDR 1999a). The uptake, called the concentration ratio (CR), is expressed as a ratio of uranium in soil to the amount of uranium in plants. The concentration ratio is dependent on the soil and type of plant, with recommended values ranging from 0.002 to 0.017 (LANL 2000; NCRP 1999). For example, if a kilogram of soil contains a microgram of uranium, a kilogram of plant material may contain 0.002 to 0.017 micrograms of uranium.
From 1998 to 2000, DOE collected homegrown vegetables from a Scarboro resident and analyzed these foods for radionuclides, including the uranium isotopes. ATSDR analyzed the private garden vegetable data to evaluate the uranium radiation dose a person might receive from the ingestion of these vegetables. The rate of consumption of contaminated plants may differ considerably from the national average for certain populations living near hazardous waste sites. EPA has published a handbook, the Exposure Factors Handbook (EPA 1997), in which regional rates for foods are listed. ATSDR used the food intake parameters specific to the South (see Table 20).
Table 20. Food Ingestion Rates for the Southern United States
| Food | Per Capita Intake (g/kg/day) | Standard Error |
| Total fruit | 3.017 | 0.105 |
| Total vegetable | 4.268 | 0.047 |
| Total meat | 2.249 | 0.025 |
| Homegrown fruits | 2.97 | 0.3 |
| Homegrown vegetables | 2.27 | 0.122 |
| Home-produced meat | 2.24 | 0.194 |
Source: EPA 1997
g/kg/day: grams per kilogram per day
ATSDR estimates that a person who frequently eats vegetables from a private garden in Scarboro is expected to receive about 0.137 mrem of uranium per year. The summary of this analysis from the ingestion of foods collected from a private garden in Scarboro is provided in Table 21.
Table 21. Radiation Doses from Uranium Following Ingestion of Private Garden Vegetables Grown in Scarboro
| Vegetable type | Concentration(total mg U) | Total Radiation Dose (mrem per gram food) |
| Leafy | 1.14E-02 | 1.87 × 10⁻³ |
| Tomatoes | 3.92E-04 | 4.34 × 10⁻⁵ |
| Turnips | 1.22E-03 | 1.54 × 10⁻⁴ |
| Total per kg food | 1.31E-02 | 2.06 × 10⁻⁶ |
| Total following ingestion | 1.37 × 10⁻¹ mrem per year | |
Source: OREIS
Ingestion is based on an 80-kilogram adult eating 2.27 grams of produce per kilogram of body weight per day for 365 days a year (EPA 1997).
In addition, DOE collects and analyzes vegetables grown in plots near on-site and off-site air monitoring stations and in private gardens (Figure 26 gives sample locations). The vegetables included lettuce, turnips, turnip greens, and tomatoes. These vegetables are analyzed for radionuclides, including the uranium isotopes. ATSDR estimated the annual dose a resident might receive from ingesting equal amounts of these vegetables using the same default values estimated for a Scarboro resident. That is, the typical resident would ingest 2.27 grams of produce per day for each kilogram of their body weight. For these calculations, we used a body weight of 80 kilograms (approximately 176 pounds) and 365 days per year. The estimated average radiation doses from uranium are summarized in Table 22. These results indicate that the produce grown and consumed in the Scarboro community contains essentially the same amount of uranium as produce grown in the outlying areas.
Table 22. Radiation Doses from Uranium Following Ingestion of Garden Vegetables Grown On and Off the Oak Ridge Reservation
| Plot Identification Number | Location | Concentration* | Total Whole Body Radiation Dose (mrem) |
| Plot 37 | Monitoring station 37 On site west of Y-12 in the ORR | 9.26 × 10⁻⁹ | 1.06 × 10⁻¹ |
| Plot 40 | Monitoring station 40 On site near Bear Creek Road and Scarboro Road Intersection | 1.28 × 10⁻⁸ | 1.73 × 10⁻¹ |
| Private Garden | Off site near station 40 | 3.35 × 10⁻¹⁰ | 2.77 × 10⁻³ |
| Plot 46 | Monitoring station 46 Off site in Scarboro | 1.25 × 10⁻⁸ | 1.31 × 10⁻¹ |
| Private Garden | Off site in Scarboro | 4.35 × 10⁻⁹ | 1.37 × 10⁻¹ |
| Plot 51 | Monitoring Station 51 Off site in Anderson County | 6.8 × 10⁻⁹ | 9.25 × 10⁻² |
| Claxton | Off site in Claxton | 5.08 × 10⁻⁹ | 4.37 × 10⁻² |
| Average ± SD | 9.8 × 10⁻² ± 5.8 × 10⁻² | ||
| Average excluding Plot 46 and Scarboro private garden | 8.36 × 10⁻² | ||
Source: OREIS
* Average concentration of uranium in all vegetables sampled (grams U per gram of food)
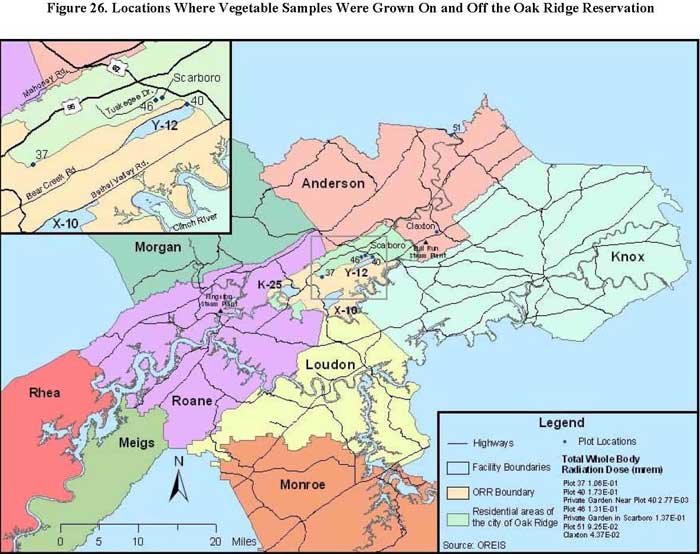
Figure 26. Locations Where Vegetable Samples Were Grown On and Off the Oak Ridge Reservation
External exposure from uranium in soils
Just being near uranium is not dangerous to your health because uranium gives off very little of the penetrating gamma radiation (ATSDR 1999a). Although uranium is weakly radioactive, most of the radiation it gives off cannot travel far from its source. If the uranium is outside your body (in soil, for example), most of its radiation cannot penetrate your skin and enter your body. To be exposed to radiation from uranium, you have to eat, drink, or breathe it, or get it on your skin (ATSDR 1999a). Thus, uranium is a very weak emitter of radiation and is considered a health problem if internalized within the body. A comparison of dose factors using federal guidance documents (EPA 1988, 1993) indicates that uranium in the soil pathway can be removed from any additional evaluation.
III.B.2.b. Current Chemical Effects
Current Inhalation Exposure Pathway
ATSDR reviewed the air monitoring data accumulated since 1995 in the Scarboro community (Station 46) and air monitoring data accumulated from 1986 to 1991 in the city of Oak Ridge (Station 41). ATSDR used these data to assess the chemical impact of inhaling air containing uranium16. These data were compared to data from perimeter air monitoring stations (Stations 1, 37, 38, and 40) on the reservation as well as to background data at remote air monitoring stations (Stations 51 and 52) (Figure 22 shows the locations of the air monitoring stations). For the comparisons, ATSDR converted the isotopic uranium values to mass17, expressing the activity in units of milligrams of uranium per cubic meter of air (mg/m3). The air concentrations of uranium in Scarboro averaged 5.4 × 10⁻¹¹ mg/m3 and in the city of Oak Ridge averaged 1.4 × 10⁻¹⁰ mg/m3 (see Figure 27). All of the air concentrations are within an order of magnitude of each other, including the background locations. The average uranium air concentrations from perimeter monitoring stations on the reservation to the west of Scarboro are about 20% lower than the average concentrations measured in the Scarboro location. The average background uranium air concentrations from the remote air monitoring stations are about 60% lower than that of Scarboro; however, the average concentration from Station 1, located on site near X-10, is about 40% higher than Scarboro. Station 41, located in Oak Ridge near the intersection of South Illinois Avenue and the Oak Ridge Turnpike, has an average concentration about 60% higher than Scarboro. Therefore, ATSDR believes this indicates that a portion of the uranium detected in the air around Scarboro is from the Y-12 plant.
The current air concentrations were compared to ATSDR's intermediate-duration inhalation MRL of 8 × 10⁻³ mg/m3 for insoluble uranium. As shown in Figures 9 and 27, air concentrations from all stations, including Scarboro, are more than a million times less than the MRL and therefore well below levels that would be expected to cause harmful chemical effects.
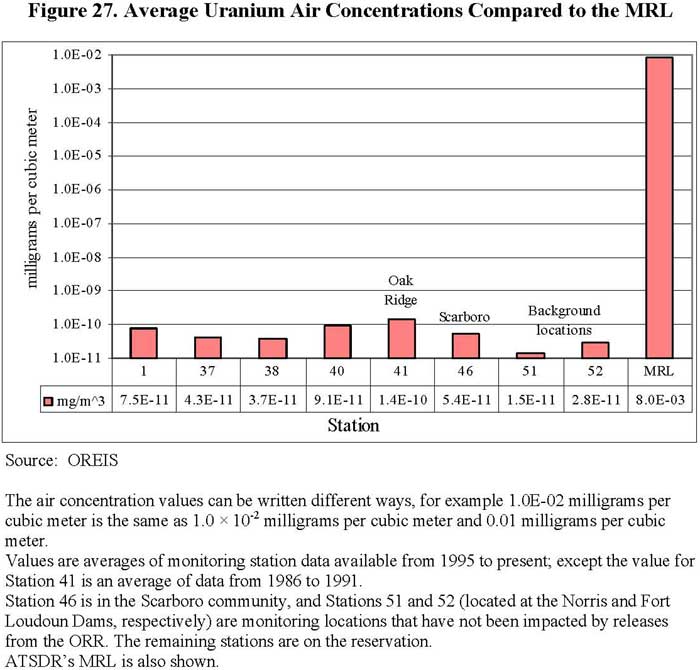
Figure 27. Average Uranium Air Concentrations Compared to the MRL
Current Ingestion Exposure Pathway
Ingestion of soils
As with the evaluation of radiation effects, ATSDR considered that the entire population of Scarboro incidentally ingests soil. Adults were assumed to incidentally ingest 50 mg of soil/day, whereas children were assumed to incidentally ingest 100 mg/day. For the purposes of the assessment, ATSDR evaluated current doses for an adult male, an adult female, a 12-year-old child, and a 6-year-old child. The results are summarized in Table 23 and Figure 28. The Evaluating Exposures section (Section III.A.2.) explains ATSDR's method of calculating doses.
Table 23. Uranium Doses from Ingestion of Scarboro Soil
| Population | Body Weight (kg) | Intake Rate (mg/day) | Dose (mg/kg/day) |
| Adult Male | 78 | 50 | 2.0 × 10⁻⁶ |
| Adult Female | 71 | 50 | 2.2 × 10⁻⁶ |
| 12-year Child | 45 | 100 | 7.1 × 10⁻⁶ |
| 6-year Child | 23 | 100 | 1.4 × 10⁻⁵ |
| Ingestion MRL | 2.0 × 10⁻³ | ||
The average soil uranium concentration of 3.19 mg U/kg soil (EPA 2003) was used in the formula Dose = (Conc. × IR) / BW to calculate the uranium dose from incidental ingestion of soil.
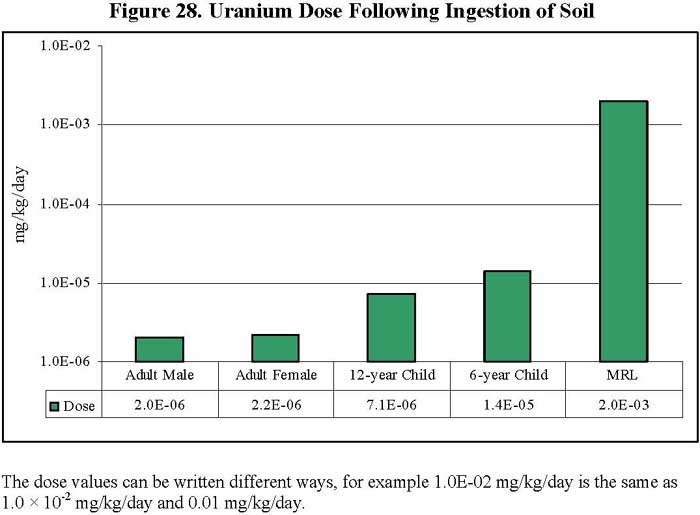
Figure 28. Uranium Dose Following Ingestion of Soil
The estimated uranium doses from ingestion of Scarboro soil by all receptor populations are well below the ATSDR MRL for intermediate-duration oral exposure to uranium (0.002 mg/kg/day) (shown in Table 23). The maximum uranium dose to the receptor population (6-year-old child) is approximately 140 times less that the ATSDR MRL. Remember that the MRL is a screening level for which values below are not of health concern. This intermediate-duration oral MRL is also protective for chronic-duration oral exposure because the renal effects of uranium exposure are more dependent on the dose than on the duration of exposure (ATSDR 1999a). Therefore, residents of Scarboro are not currently being exposed to harmful levels of uranium through incidentally ingesting soil.
Because of its chemical nature and solubility in water, uranium oxide is transported poorly from soils to plants (Dreesen et al. 1982; Moffett and Tellier 1977 as cited in ATSDR 1999a). The uptake varies widely (i.e., concentration ratios range from 0.002 to 0.017; LANL 2000; NCRP 1999) and is dependent on the nature of the soil, the pH, and the concentration of uranium in the soil.
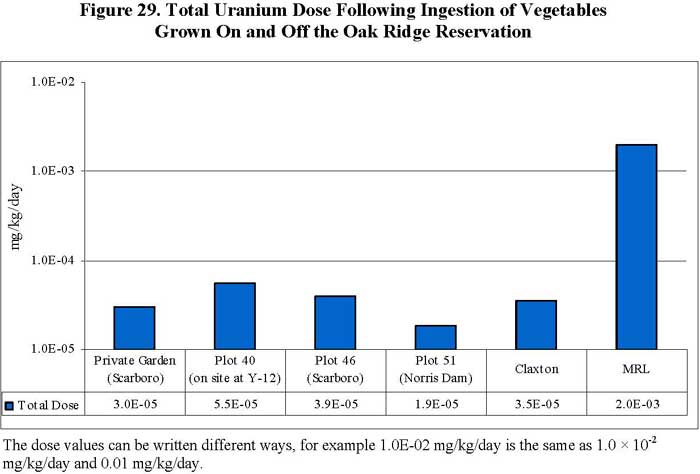
As noted previously in the radiation effects section, DOE collected homegrown vegetables from plots near on-site and off-site air monitoring stations and in private gardens in Scarboro and Claxton and analyzed these foods for the uranium isotopes. ATSDR used food ingestion rates (listed in Table 20) to evaluate the mass intake one might receive from the ingestion of these vegetables. The estimated doses of uranium from ingestion of vegetables from several locations on and around the ORR, including a private garden in Scarboro and a garden grown at air monitoring station 46 (also located in Scarboro), are given in Table 24 and Figure 29.
Table 24. Total Uranium Dose Following Ingestion of Vegetables Grown On and Off the Oak Ridge Reservation
| Location | Total Intake (mg/g) | Total Dose (mg/kg/day) |
| Private Garden (Scarboro) | 1.3 × 10⁻⁵ | 3.0 × 10⁻⁵ |
| Plot 40 (on site at Y-12) | 2.4 × 10⁻⁵ | 5.5 × 10⁻⁵ |
| Plot 46 (Scarboro) | 1.7 × 10⁻⁵ | 3.9 × 10⁻⁵ |
| Plot 51 (Norris Dam) | 8.2 × 10⁻⁶ | 1.9 × 10⁻⁵ |
| Claxton | 1.5 × 10⁻⁵ | 3.5 × 10⁻⁵ |
| MRL | 2.0 × 10⁻³ | |
The total uranium doses were calculated by multiplying the total intakes by 2.27 g/kg/day, which is the mean intake of homegrown vegetables for people who live in the South and garden (EPA 1997).
ATSDR has established an MRL of 0.002 mg/kg/day for the ingestion of uranium. As shown in Table 24, the total uranium doses from ingestion of vegetables grown in all on-site and off-site locations, including the Scarboro community, are well below the ATSDR MRL for intermediate-duration oral exposure to uranium (0.002 mg/kg/day). The estimated total uranium doses from ingestion of vegetables grown in private gardens in Scarboro are more than 50 times less than the MRL, and therefore ingestion of these vegetables is not of health concern.
The uranium doses following ingestion of soils and vegetables from a private garden in Scarboro are so low that even if the exposures from the two pathways are combined, the resulting dose is still lower than the MRL. As discussed in the Evaluating Exposures section (Section III.A.2.), estimated doses that are less than the MRL are not considered to be of health concern and do not require further evaluation. For example, if the highest dose following ingestion of soil (1.4 � 10-5 mg/kg/day for a 6-year-old child, see Table 23) is added to the total intake from ingestion of vegetables grown in Scarboro (3.9 � 10-5 mg/kg/day from Plot 46, see Table 24), the total ingestion dose is 5.3 � 10-5 mg/kg/day, which is about two orders of magnitude below the MRL of 2.0 � 10-3 mg/kg/day (see Figure 8). Therefore, the combined exposure from both ingestion pathways would not result in harmful health effects.
 EFPC is not used as a drinking water source. The city of Oak Ridge, including
Scarboro, is served by municipal water, which must meet specific drinking water
quality standards set by EPA. Under the authorization of the Safe Drinking Water
Act, EPA has set national health-based standards to protect drinking water and
its sources. More information concerning the Safe Drinking Water Act can be
found on EPA's website at http://www.epa.gov/
EFPC is not used as a drinking water source. The city of Oak Ridge, including
Scarboro, is served by municipal water, which must meet specific drinking water
quality standards set by EPA. Under the authorization of the Safe Drinking Water
Act, EPA has set national health-based standards to protect drinking water and
its sources. More information concerning the Safe Drinking Water Act can be
found on EPA's website at http://www.epa.gov/ ![]() safewater or by calling EPA's Safe Drinking Water Hotline at 1-800-426-4791.
The total uranium mean concentrations in surface water from Scarboro ditches
and Lower EFPC are below EPA's MCL for uranium (30 µg/L). In addition,
Table 16 shows that the mean total uranium concentrations for surface water
samples collected from Scarboro ditches and Lower EFPC are below ATSDR's EMEG
of 20 µg/L, which is a nonenforceable, health-based comparison value developed
for screening environmental contaminants for further evaluation. The EMEG reflects
a concentration that is much lower than those that have been observed to cause
adverse health effects. As a result, exposure to concentrations at or below
ATSDR's EMEG are not considered to warrant health concern. Therefore, the concentrations
of uranium that people might be exposed to are not of health concern.
safewater or by calling EPA's Safe Drinking Water Hotline at 1-800-426-4791.
The total uranium mean concentrations in surface water from Scarboro ditches
and Lower EFPC are below EPA's MCL for uranium (30 µg/L). In addition,
Table 16 shows that the mean total uranium concentrations for surface water
samples collected from Scarboro ditches and Lower EFPC are below ATSDR's EMEG
of 20 µg/L, which is a nonenforceable, health-based comparison value developed
for screening environmental contaminants for further evaluation. The EMEG reflects
a concentration that is much lower than those that have been observed to cause
adverse health effects. As a result, exposure to concentrations at or below
ATSDR's EMEG are not considered to warrant health concern. Therefore, the concentrations
of uranium that people might be exposed to are not of health concern.
Next Section Table
of Contents