Historical Document
This document is provided by the Agency for Toxic Substances and Disease Registry (ATSDR) ONLY as an historical reference for the public health community. It is no longer being maintained and the data it contains may no longer be current and/or accurate.
- From January 1 to June 30, 2009, 4,074 substances were released or threatened to be released during 3,458 events in 13 states. In this period, the categories of “Volatile organic substance,” “Other inorganic substance,” “Mixture across chemical category,” and “Acids.” accounted for 51.0% of the hazardous substances releases reported.
- From July 1 to December 31, 2009, 1,673 substances were released or threatened to be released during 1,352 events in six states. In this period, the categories of “Volatile organic substance,” “Other inorganic substances,” and “Acids.” accounted for 50.3% of the hazardous substances releases reported.
- From January 1 to June 30, 439 of 3,458 events (12.7%) resulted in 1,050 victims, of whom 44 died. From July 1 to December 31, 129 of 1,352 events (9.5%) resulted in 319 victims, of whom 8 died.
- Throughout the year, the four most frequently reported health effects attributed to events were
- respiratory irritation,
- headaches,
- gastrointestinal symptoms, and
- dizziness and other central nervous system symptoms.
- From January 1 to June 30, 2009, 97 of 475 employee-victims (20.4%) and 33 of 59 responder-victims (55.9%) used personal protective equipment (PPE) during events. PPE use was unknown for 47 employee-victims and 4 responder-victims. Of the 1,008 victims for whom decontamination status was known, 748 (74.2%) were not decontaminated.
- From July 1 to December 31, 2009, 1 of 133 employee-victims (0.8%) and 4 of 12 responder-victims (33.3%) used personal PPE during events. PPE use was unknown for 21 employee-victims. Of the 293 victims for whom decontamination status was known, 209 (71.3%) were not decontaminated.
- Evacuation was ordered in 260 (7.6%) events reported from January 1 to June 30 and in 121 (8.9%) events reported from July 1 to December 31.
- In-place sheltering was ordered in 34 (1.0%) events reported from January 1 to June 30 and in 6 (0.4%) events reported from July 1 to December 31.
- describe the distribution and characteristics of acute hazardous substance releases,
- describe illness or injuries and deaths among employees, responders, and the general public caused by hazardous substances releases, and
- develop strategies that might reduce illness or injury and deaths caused by hazardous substances events.
- Level A: The most protective. This type of equipment is used when greatest level of skin, respiratory and eye protection is required.
- Level B: Used when the highest level of respiratory protection is necessary, but a lesser level of skin protection.
- Level C: Used when the concentration(s) and type(s) of airborne substance(s) are known, and the criteria for using air purifying respirators are met.
- Level D: A work uniform affording minimal protection and used for nuisance contamination only.
- 33.9% occurred from 6:00 a.m. to 11:59 a.m.
- 32.9% occurred from 12:00 noon to 5:59 p.m.
- 18.4% occurred from 6:00 p.m. to 11:59 p.m.
- 14.7% occurred from midnight to 5:59 a.m.
- 2.9% were < 5 years of age
- 7.4% were 5–14 years of age
- 5.6% were 15–19 years of age
- 53.0% were 20–44 years of age
- 26.5% were 45–64 years of age
- 4.6% were = 65 years of age
- 36.9% occurred from 6:00 a.m. to 11:59 a.m.
- 31.4% occurred from 12:00 p.m. to 5:59 p.m.
- 17.1% occurred from 6:00 p.m. to 11:59 p.m.
- 14.5% occurred from midnight to 5:59 a.m.
- 4.6% were < 5 years of age.
- 6.9% were 5–14 years of age.
- 13.3% were 15–19 years of age.
- 39.9% were 20–44 years of age.
- 26.0% were 45–64 years of age.
- 9.2% were = 65 years of age.
- The New York State HSEES program published an article entitled “New York Hazardous Substances Emergency Events Surveillance (HSEES) data support emergency response, promote safety and protect public health” in the Journal of Loss Prevention in the Process Industries.
- The North Carolina HSEES program presented the NC HSEES data at the 2009 Business and Environmental Safety Training conference, the 2009 All Hazards conference, the 2009 NC State Fireman’s Association Annual Conference, and the Guilford County LEPC & ASSE Safety & Environmental Conference.
- The Utah State HSEES program together with Utah’s Environmental Public Health Tracking Program (EPHT), developed HSEES indicators to track environmental conditions and query modules for the Utah Indicator-Based Information System for Public Health (IBIS-PH). The indicators were published on a public portal of the IBIS-PH and may be found at http://ibis.health.utah.gov/.
- The Washington State HSEES program prepared a 2009 HSEES calendar including messages promoting hazardous substances awareness and forwarded it to law enforcement and fire department officials and others interested in emergency management.
- The Washington State HSEES program also developed and distributed a publication entitled “HSEES Highlights” to promote awareness of the program.
- Using HSEES data, the New York HSEES program made several presentations to firefighters and published an article entitled, “Expect the Unexpected and Prevent Firefighter Injuries in HAZMAT events.”
- North Carolina HSEES program distributed a fact sheet designed to show factors associated with the most releases and prevention measures to decrease the number of events at trucking terminals throughout the state.
- The Texas HSEES program incorporated the county data into a query and mapping system maintained by the Texas Department of State Health Services Center for Health Statistics. Texas HSEES staff made three presentations to the Governor’s Division of Emergency Management training workshop for the county emergency managers and responded to data requests generated from presentations.
- The Utah HSEES program developed a presentation that targeted the Hazardous Material Emergency Responders. This presentation, along with an interactive game section where key concepts were reviewed, was presented during two breakout sections of the Intermountain Hazardous Material Conference in August, 2009. It was also presented at five Local Emergency Planning Committees throughout state of Utah
- The Michigan HSEES program prepared a manuscript entitled, “Compliance with a law banning mercury in Michigan schools” for publication at one of the public health journals. The Michigan HSEES program also collaborated with other HSEES states and ATSDR on a publication entitled, “State programs for surveillance of carbon monoxide releases using the HSEES system.”
- The Minnesota, New York, Michigan, and ATSDR HSEES staff prepared a publication entitled, “Hazards of Illicit Methamphetamine Production and Efforts at Reduction” that was accepted for publication in the Healthy People/Healthy Homes supplement of Public Health Reports.
- Upon request from University of Minnesota Extension Office, the Minnesota HSEES program wrote two reports entitled, “Summary of pesticide incidents reported to Minnesota HSEES, 1995-2008” and “Summary of antimicrobial incidents reported to Minnesota HSEES, 1995-2008”. The first report was posted on Minnesota’s HSEES Web page at http://www.health.state.mn.us/divs/eh/hazardous/surv/index.html. The second report was provided to the Extension Office.
- The New York HSEES program supporting New York State‘s response to clandestine drug laboratories made several presentations to educate law enforcement and public health professionals on the recognition of clandestine drug labs, hazards associated with these labs, and the health department’s role in responding to identified labs.
- The New York HSEES program worked closely with the Bureau of Community Environmental Health and Food Protection (BCEH&FP) targeting operation of public pools and water parks in New York State and promoting principles of green chemistry in the pool environment.
- The Wisconsin HSEES program joined a State Agency Dialogue Pertaining to Implementation of Inherently Safer Technology and Green Chemistry Outreach Precepts and other related workgroups such as Green Tier Program, promoting Green technology.
- Centers for Disease Control and Prevention. Comprehensive plan for epidemiologic surveillance. Atlanta: US Department of Health and Human Services; 1986.
- Binder S. Death, injuries, and evacuations from acute hazardous materials releases. Am J Public Health 1989;70:1042–4.
- National American Industry Classification System, 2007. Bureau of the Census, United States, Washington, DC, 2007, 1400 pages.
- ATSDR HSEES Web site: http://www.atsdr.cdc.gov/HS/HSEES/.
Download Adobe Acrobat version ![]() [PDF - 2 MB]
[PDF - 2 MB]
In 1980, Congress created the Agency for Toxic Substances and Disease Registry (ATSDR) to implement health-related sections of laws that protect the public from hazardous wastes and environmental spills of hazardous substances. The Comprehensive Environmental Response, Compensation, and Liability Act of 1980 (CERCLA), commonly known as the Superfund Act, designated ATSDR as the lead agency within the U.S. Public Health Service to help prevent or reduce further exposure to hazardous substances and the adverse health effects that might result from such exposures, and to expand the knowledge base about such effects.
In accordance with this legislative mandate, this publication reports results and findings of health studies, registries, or other health-related activities supported by ATSDR.
Comments regarding this report are welcome. Please send your comments to the following address:
Agency for Toxic Substances and Disease Registry
Attn: Director, Division of Health Studies (F-57)
4770 Buford Highway, NE Atlanta, Georgia 30341
Centers for Disease Control and Prevention
Thomas Frieden, MD, MPH, Director
Agency for Toxic Substances and Disease Registry
Christopher Portier, PhD, Director
Division of Health Studies
G. David Williamson, PhD, Director
Caroline McDonald, BS, Deputy Director
Anne Sowell, PhD, Assistant Director for Science
Surveillance and Registries Branch
D. Kevin Horton, DrPH, MSPH, Branch Chief
Hazardous Substances Emergency Events Surveillance Staff
Ayana R Anderson, MPH
Mary Anne Duncan, DVM, MPH
Nelda Godfrey
Natalia Melnikova, MD, PhD
Maureen Orr, MS
Perri Zeitz Ruckart, MPH
Jennifer Wu, MS
Overview
The Agency for Toxic Substances and Disease Registry (ATSDR) maintained the Hazardous Substances Emergency Events Surveillance (HSEES) system from 1990 to 2009. The program ended in June 2009 and was replaced by the National Toxic Substance Incidents Program (NTSIP). Six HSEES states funded by NTSIP continued to collect HSEES data through the end of 2009. Under HSEES, state health departments collected information on the public health consequences of acute hazardous substance incidents. These data facilitated national, state, and local preparedness activities for prevention of, and response to, hazardous substance threats. This report summarizes the 3,458 events reported by 13 states during the first half of 2009, the 1,352 events reported by 6 states during the second half of 2009, and the major activities performed by the state programs in 2009.
Background
The Centers for Disease Control and Prevention (CDC) defines surveillance as the
From 1990 through September 2009, the Agency for Toxic Substances and Disease Registry (ATSDR) maintained the active, state-based Hazardous Substances Emergency Events Surveillance (HSEES) system to determine the public health consequences of hazardous substance releases.
The decision to initiate this surveillance system was based on a 1989 study about the reporting of hazardous substances releases to three national databases: the National Response Center Database, the Hazardous Material Information System (HMIS), and the Acute Hazardous Events Database.[2] The study revealed database limitations, among which were specific reporting requirements that excluded many events, (for example, the HMIS, did not record events involving intrastate carriers or fixed facilities). Other important information, such as the demographic characteristics of victims, types of injuries sustained, and number of persons evacuated, was not recorded. Subsequently, ATSDR implemented the HSEES system to describe more fully the public health consequences of hazardous substances releases and to support informed prevention activities.
The HSEES goals were to:
A surveillance system is more than a data repository; the data must be appropriate and useful for public health interventions. Each participating state was to use its collected data to promote public health within its jurisdiction by developing appropriate prevention outreach activities and developing evaluation tools to measure program effectiveness.
Purpose
This report provides an overview of HSEES activities in the states participating in 2009. It summarizes the characteristics of events surrounding acute hazardous substances releases and the associated public health consequences. It also demonstrates how the data were applied to prevention activities to protect public health.
Description
From January 1, 2009 through June 30, 2009, 13 state health departments participated in HSEES: Colorado, Florida, Iowa, Louisiana, Michigan, Minnesota, North Carolina, New York, Oregon, Texas, Utah, Washington, and Wisconsin (Figure 1). From July 1, 2009 through December 31, 2009, the new NTSIP program funded six of the HSEES states. These states, Louisiana, North Carolina, New York, Oregon, Texas and Wisconsin, continued to collect data. This report presents results for the first and the second halves of 2009 separately. Information was collected about each event, including substance(s) released, victims, adverse health effects and illness symptoms, evacuations, sheltering in place, and decontamination.
Figure 1. HSEES Participating States, 2009*
Data Sources
Event information came from various data sources, including records and oral reports of state environmental protection agencies, the U.S. Department of Transportation, the National Response Center, police and fire departments, and hospitals. U.S. Census Bureau data were used to estimate the number of residents in the vicinity of events. Using a standardized data collection form, all data were entered into an Internet-based system provided by ATSDR.
Definitions
A hazardous substances emergency event was an acute, uncontrolled, or illegal release or threatened release of hazardous substances.
Threatened releases
were imminent releases that did not occur but lead to a public health action (e.g., evacuation) potentially affecting the health of employees, emergency responders, or members of the general public.
Transportation events occurred during surface, air, pipeline, or water transport of hazardous substances and before completion of unloading of the substances from a vehicle or vessel; all other events were considered fixed-facility events. An event could involve several types of releases: spill, volatilization/aerosolized (vapor), fire, explosion, or any combinations.
A victim was a person who experienced at least one documented adverse health effect within 24 hours after an event or who died as a consequence of an event. Victims were categorized into one of four population groups: employees, general public, responders, and students. Responders were further subcategorized as firefighters, police officers, Emergency Medical Team and hospital personnel, members of company response team, third party clean up contractors, or not specified responders. Victims could have more than one symptom or type of adverse health effect.
Personal Protective Equipment (PPE) is clothing and equipment worn to protect the wearer from exposures. There are four categories of PPE:
Firefighter turnout gear is a commonly reported type of protective gear. This is not part of the four OSHA categories of PPE. Firefighters wear this protective clothing during structural firefighting operations, and it is considered to be Level D protection. To obtain a detailed description of the different levels of personal protective equipment refer to www.osha.gov.
Decontamination is the removal of contamination by removing contaminated clothing and rinsing the contaminated area with water (or another approved rinse agent). People need to be decontaminated only if they have chemicals on their clothing or bodies which could cause health effects or contribute to secondary contamination (i.e., spread of substance from person to person causing health effects).
Reporting Requirements:
States were required to report any release in which the amount of substance released—or that might have been released—was greater than 10 pounds or 1 gallon, or, for substances on the HSEES mandatory reporting list, the release of any amount.
Smoke stack emissions with values of carbon monoxide (CO), sulfur oxides (SOX), and/or nitrogen oxides (NOX) above permitted levels were not reported: these emissions rarely cause acute public health effects. Petroleum-only releases (e.g., crude oil, gasoline) were also excluded.
RESULTS
Because different HSEES states collected data for the periods January 1 – June 30 and July 1 – December 31, 2009, the data are presented separately.
Events
From January 1 to June 30, 2009 3,458 acute hazardous substances events in 13 states met the criteria for inclusion in HSEES. Over 68% (n=2,361) of these events, occurred in fixed facilities and about 32% (n=1,087) of events occurred during transportation. Washington did not report the type for 10 events. Three states, Texas, New York and Louisiana, accounted for about half, 50.7% (n=1,753) of all events (Table 1a).
Table 1a. Number of Reported HSEES Incidents, by State and Type of Event. January 1 June 30, 2009
STATE |
Fixed Facility |
Transportation |
Total Events |
||
Number of Events |
*% |
Number
of Events |
*% |
||
Colorado |
32 |
28.8 |
79 |
71.2 |
111 |
Florida |
208 |
82.5 |
44 |
17.5 |
252 |
Iowa |
135 |
74.2 |
47 |
25.8 |
182 |
Louisiana |
351 |
83.6 |
69 |
16.4 |
420 |
Michigan |
132 |
76.7 |
40 |
23.3 |
172 |
Minnesota |
167 |
64.7 |
91 |
35.3 |
258 |
North Carolina |
61 |
41.8 |
85 |
58.2 |
146 |
New York |
402 |
75.7 |
129 |
24.3 |
531 |
Oregon |
61 |
54.5 |
51 |
45.5 |
112 |
Texas |
597 |
74.4 |
205 |
25.6 |
802 |
Utah |
62 |
43.4 |
81 |
56.6 |
143 |
Washington |
90 |
54.5 |
75 |
45.5 |
*165 |
Wisconsin |
63 |
40.9 |
91 |
59.1 |
154 |
Total |
2,361 |
68.3 |
1,087 |
31.7 |
*3,448 |
Fixed Facility Events
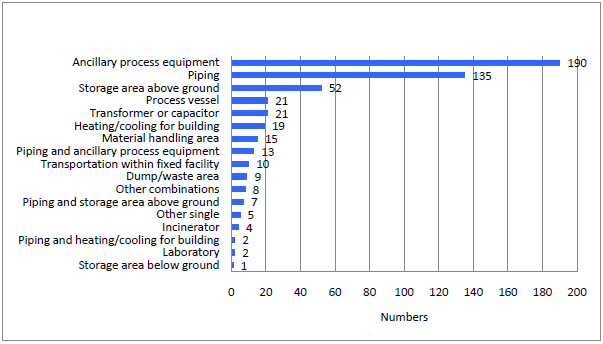
For each fixed-facility event, reporters could select one or two areas (specific location at the fixed facility where the event occurred) or types of equipment involved in accordance with the North American Industry Classification System (NAICS)[3] industry categories. Of 2,361 fixed-facility events, single area was reported for 1,014 (42.9%) events and a combination of two areas was reported for 200 (8.5%) events. For 1,147 (48.6%) events, area type was not reported. The main areas of fixed facility events were ancillary processing equipment, piping, process vessel, storage above ground, and process vessel along with ancillary processing equipment (Figure 2a).
Figure 2a. Areas of Fixed Facilities Involved in Reported HSEES Events. January 1 -June 30, 2009
Transportation Events
Most (87.3%) transportation events occurred during ground transport (e.g., truck, van, tractor), and 8.7% occurred during rail transport. Fewer events occurred during water (2.0%), pipeline (1.1%), air (0.8%), or multiple transportation modes (0.1%).
Most transportation-related events involved en route releases discovered after arrival at a fixed facility (37.2%), releases from a moving vehicle or vessel (27.8%), or occurred during vehicle/vessel unloading (24.3%). Fewer events involved a stationary vehicle or vessel (10.1%). The transportation phase during which the release occurred was not reported for 0.5% of events.
Timing of Events
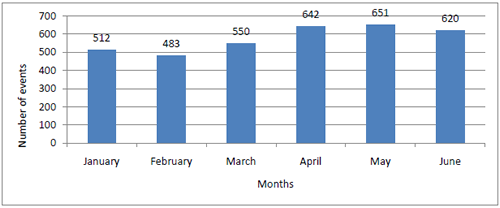
The number of events per month ranged from 483 (13.9%) in February to 651 (18.8%) in May with the spring and summer months (April-June) having the highest number of events (Figure 3a).
About 85% of events occurred on a weekday and 15% on the weekend. Most events occurred during daytime business hours. Of the 3,136 events for which time of day was reported:
Figure 3a Number of Reported HSEES Events by Month.
January 1 - June 30, 2009
Contributing Factors
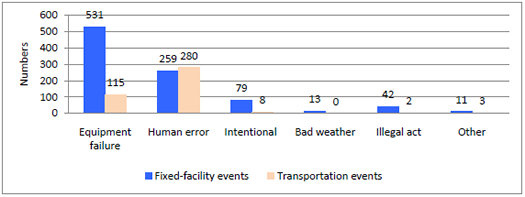
Contributing factors were reported as either primary (root) or secondary causes. Primary factors were reported for 3,401 (98.4%) events (Figure 4a). Equipment failure and human error were the leading primary factors. Primary factors differed by location: for fixed-facility events the leading factor was equipment failure; for transportation-related events the leading factor was human error.
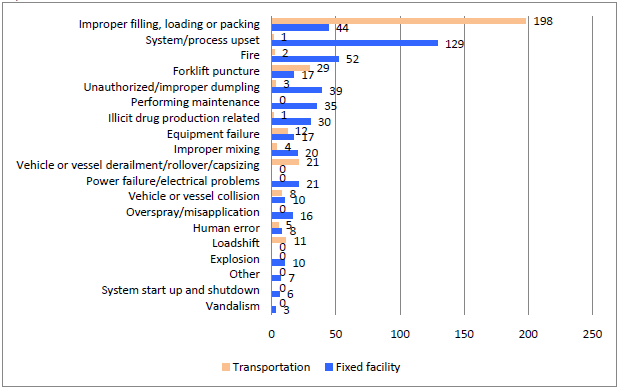
Secondary factors were reported for 1,859 events (Figure 4b). The most frequently reported secondary factor was improper filling, loading, or packing (n=439); the second most frequently reported secondary factor was system/process upset (n=266).
Secondary factors were reported for 1,167 fixed facility events and 692 transportation events. For fixed-facility events, the most frequently reported secondary factor was system/process upset (n=258). For transportation-related events, the most frequently reported secondary factors were improper filling, loading, or packing (n=356) and forklift puncture (n=75).
Figure 4a. Primary Factors Reported as Contributing to HSEES Events, by Type of Event, January 1– June 30, 2009
Figure 4b. Secondary Factors Reported as Contributing to HSEES Events, by Type of Event. January 1 - June 30, 2009
Industries
Industries were categorized using NAICS classifications. The largest number of HSEES events was associated with manufacturing (NAICS 31-33, n=1,089) and transportation and warehousing (NAICS 48-49, n=990) (Table 2a).
The largest proportion of events in a single industry category (27.2%, n=939) was associated with NAICS 32 (Manufacturing) that covers wood, paper, printing, petroleum and coal, chemical, plastic and rubber, and nonmetallic mineral manufacturing.
The largest number of victims (n=228) was associated with NAICS 81 (Other services). The second largest number of victims (n=141) was associated with NAICS 31 (Manufacturing) that covers food, beverage, tobacco, textile, apparel, and leather and allied products manufacturing.
Although the largest proportion of events was associated with the industry categories NAICS 32 (Manufacturing) and NAICS 48 (Transportation and Warehousing), only a small portion of those events (3.0% and 2.2% respectively) involved victims. By contrast, although NAICS 81 (Other Services) accounted for only 8.5% of all events, 51.4% of events from that industry involved victims, accounting for 21.7% of all victims.
Table 2a. Industries Involved in Reported HSEES Events, by Category
Industry Category |
Total Events |
Victims |
||
2-digit NAICS Classification* |
Number of events |
% of Events |
Number of events with victims |
Total number of victims |
(11) Agriculture, Forestry, Fishing and Hunting |
110 |
3.2 |
16 |
17 |
(21) Mining |
30 |
0.9 |
3 |
3 |
(22) Utilities |
166 |
4.8 |
12 |
58 |
(23) Construction |
26 |
0.8 |
6 |
7 |
(31) Manufacturing |
151 |
2.1 |
24 |
81 |
(32) Manufacturing |
85 |
2.5 |
20 |
141 |
(33) Manufacturing |
65 |
1.9 |
9 |
9 |
(42) Wholesale Trade |
103 |
2.9 |
9 |
9 |
(44) Retail Trade |
39 |
1.1 |
8 |
28 |
(45) Retail Trade |
14 |
0.4 |
4 |
51 |
(48) Transportation and Warehousing |
856 |
24.8 |
19 |
29 |
(49) Transportation and Warehousing |
134 |
3.9 |
5 |
19 |
(51) Information |
4 |
0.1 |
1 |
7 |
(52) Finance and Insurance |
5 |
0.1 |
2 |
40 |
(53) Real Estate and Rental and Leasing |
57 |
1.7 |
15 |
32 |
(54) Professional, Scientific, and Technical Services |
15 |
0.4 |
3 |
11 |
(55) Management of Companies and Enterprises |
3 |
0.1 |
0 |
0 |
(56) Administrative, Support, Waste Management and Remediation Services |
52 |
1.5 |
7 |
11 |
(61) Educational Services |
71 |
2.0 |
25 |
54 |
(62) Health Care and Social Assistance |
44 |
1.2 |
15 |
50 |
(71) Arts, Entertainment, and Recreation |
23 |
0.7 |
8 |
37 |
(72) Accommodation and Food Services |
39 |
1.1 |
15 |
36 |
(81) Other Services |
294 |
8.5 |
151 |
228 |
(92) Public Administration |
36 |
1.0 |
5 |
17 |
Not an Industry |
248 |
7.2 |
56 |
106 |
Total |
3,458 |
100.0 |
439 |
1,050 |
31 Includes food, beverage, tobacco, textile, apparel, and leather and allied products manufacturing
32 Includes wood, paper, printing, petroleum and coal, chemical, plastic and rubber, and non-metallic mineral manufacturing
33 Includes metal, machinery, electronics, appliances, transportation equipment, furniture and miscellaneous manufacturing
44 Includes motor vehicle, furniture and home furnishings, electronics and appliances, building materials and garden equipment, food & beverages, health and personal care, gasoline, and clothing & accessories
45 Includes sporting goods, hobby, book and music supplies, general merchandise, and miscellaneous
48 Includes transportation by air, rail, water, truck, transit and ground passenger, pipeline, scenic and sightseeing, and transportation support activities.
49 Includes postal service, couriers and messengers, and warehousing and storage.
Substances
Of the 4,074 substances involved in events reported to HSEES from January 1 to June 30, 2009, 92.1% actually were released and 7.9% were threatened releases. The majority of events, 3,189, involved only one substance. One hundred and fifty nine events involved two substances, and 100 events involved more than two substances (Table 3a). Two or more substances were released in 7.7% of fixed-facility events and in 7.2% of transportation events.
Table 3a. Number of Substances Involved per Reported HSEES Event, by Type of Event, January 1 – June 30, 2009
Number of substances |
Type of event |
All events |
|||||||
Fixed facility |
Transportation |
||||||||
Number of events |
% |
Total substances |
Number of events |
% |
Total substances |
Number of events |
% |
Total |
|
1 |
2,180 |
92.3 |
2180 |
1,009 |
92.8 |
1009 |
3,189 |
92.5 |
3,189 |
2 |
91 |
3.9 |
182 |
68 |
6.3 |
136 |
159 |
4.6 |
318 |
3 |
48 |
2.0 |
144 |
5 |
0.5 |
15 |
53 |
1.5 |
159 |
4 |
17 |
0.7 |
68 |
2 |
0.2 |
8 |
19 |
0.5 |
76 |
>=5 |
25 |
1.1 |
305 |
3 |
0.3 |
17 |
28 |
0.8 |
322 |
Total |
2,361 |
100.0 |
2,879 |
1,087 |
100.1 |
1185 |
3,448* |
99.9 § |
4,064 |
*10 events are missing due to missing information on type of event.
The five substances most frequently released or threatened to be released in the order of frequency were ammonia, carbon monoxide, sodium hydroxide, paint not otherwise specified, and hydrochloric acid (Table 4a).
Table 4a. Substances Most Frequently Released or Threatened to Be Released in Reported HSEES Events, January 1-June 31, 2009
Rank |
Substance |
Number Events |
1 |
Ammonia |
239 |
2 |
Carbon monoxide |
169 |
3 |
Sodium hydroxide |
135 |
4 |
Paint NOS* |
130 |
5 |
Hydrochloric acid |
123 |
6 |
Chlorine |
89 |
7 |
Ethylene glycol |
87 |
8 |
Mercury |
82 |
9 |
Paint or coating NOS* |
69 |
10 |
Sulfuric acid |
64 |
11 |
Sulfur dioxide |
62 |
12 |
Benzene |
61 |
13 |
Vinyl chloride |
59 |
14 |
Methamphetamine chemicals NOS* |
54 |
15 |
Chlorodifluoromethane |
52 |
16 |
Ethylene |
50 |
17 |
Hydrogen sulfide |
42 |
18 |
Volatile organic compounds NOS* |
41 |
19 |
Sulfuric acid |
34 |
20 |
Polychlorinated biphenyls |
32 |
The most frequent substance categories in fixed facility events were volatile organic compounds (20.2%), other inorganic substances (15.2%), and mixture across chemical category (12.9%), (Table 5a). In transportation-related events, the most common categories were acids (16.6%), volatile organic compounds (14.9%), and paints and dyes (13.6%).
One release type was reported for 3,199 single substance releases: spills (n=1,911), air (n=1,163), threatened release (n=66), fire (n=27), and explosion (n=11). The release types for 21 substances were missing. Two release types were reported for 115 chemicals in the following combinations: spill and air (n=85), spill and fire (n=8), air and fire (n=10), fire and explosion (n=6), spill and explosion (n=3), air and explosion (n=3).
Table 5a. Number of Substances Involved by Substance Category, and Type of Reported HSEES Event, January 1 - June 30, 2009
| Substance Category | Type of Event | All events | ||||||
Fixed facility |
Transportation |
Event type missing |
||||||
N |
% |
N |
% |
N |
% |
N |
% |
|
Acids |
203 |
7.1 |
197 |
16.6 |
0 |
0.0 |
400 |
9.8 |
Agricultural chemicals, pesticides |
106 |
3.7 |
109 |
9.2 |
0 |
0.0 |
215 |
5.3 |
Ammonia |
231 |
8.0 |
30 |
2.5 |
0 |
0.0 |
261 |
6.4 |
Bases |
92 |
3.2 |
156 |
13.2 |
0 |
0.0 |
248 |
6.1 |
Category not assigned |
12 |
0.4 |
2 |
0.2 |
0 |
0.0 |
14 |
0.3 |
Carbon monoxide |
156 |
5.4 |
4 |
0.3 |
9 |
90.0 |
169 |
4.1 |
Chlorine |
122 |
4.2 |
22 |
1.9 |
0 |
0.0 |
144 |
3.5 |
Formulations |
7 |
0.2 |
1 |
0.1 |
0 |
0.0 |
8 |
0.2 |
Hetero-organics |
16 |
0.6 |
14 |
1.2 |
0 |
0.0 |
30 |
0.7 |
Hydrocarbons |
44 |
1.5 |
20 |
1.7 |
0 |
0.0 |
64 |
1.6 |
Mixture across chemical category* |
370 |
12.9 |
32 |
2.7 |
0 |
0.0 |
402 |
9.9 |
Other † |
201 |
7.0 |
67 |
5.7 |
1 |
10.0 |
269 |
6.6 |
Other inorganic substances ‡ |
438 |
15.2 |
79 |
6.7 |
0 |
0.0 |
517 |
12.7 |
Oxy-organics |
134 |
4.7 |
88 |
7.4 |
0 |
0.0 |
222 |
5.4 |
Paints and dyes |
61 |
2.1 |
161 |
13.6 |
0 |
0.0 |
222 |
5.4 |
PCB's |
31 |
1.1 |
8 |
0.7 |
0 |
0.0 |
39 |
1.0 |
Polymers |
75 |
2.6 |
19 |
1.6 |
0 |
0.0 |
94 |
2.3 |
Volatile organic compounds |
580 |
20.2 |
176 |
14.9 |
0 |
0.0 |
756 |
18.6 |
Total |
2,879 |
100.1§ |
1,185 |
100.2§ |
10 |
100.0 |
4,074 |
100.0 |
†Not belonging to one of the existing categories.
‡All inorganic substances except for acids, bases, ammonia, and chlorine.
§ Total percentage doesn’t equal 100 due to rounding
Victims
There were 1,050 victims involved in 439 events (12.7% of all events) (Table 6a). Of these events, 299 had only one victim. One mass casualty event occurred, involving 53 victims. Most victims (90.9%) were injured in fixed-facility events. Transportation-related events were more likely to have two or more victims (44.0%) than fixed facility events (30.4%).
| Number of Victims per Event | Type of Event | All Events | |||||||
| Fixed Facility | Transportation | Number of Events | % | Total Victims |
|||||
Number of Events |
% |
Total Victims |
Number of Events |
% |
Total Victims |
||||
1 |
271 |
40 |
271 |
28 |
56.0 |
28 |
299 |
68.1 |
299 |
2 |
40 |
10.3 |
80 |
15 |
30.0 |
30 |
55 |
12.5 |
110 |
3 |
21 |
5.4 |
63 |
2 |
4.0 |
6 |
23 |
5.2 |
69 |
4 |
17 |
4.4 |
68 |
1 |
2.0 |
4 |
18 |
4.1 |
72 |
5 |
8 |
2.1 |
40 |
1 |
2.0 |
5 |
9 |
2.1 |
45 |
>=6 |
32 |
8.2 |
432 |
3 |
6.0 |
23 |
35 |
8.0 |
455 |
Total |
389 |
§100.1 |
954 |
50 |
100.0 |
96 |
439 |
100.0 |
1,050 |
Substance Category and Victims
Events were classified by only one substance category, regardless of whether multiple substances were involved. If multiple substances from the same category were involved, that category was used for the event. If multiple substances from different categories were involved, the event was categorized as “multiple substances”.
To judge the relative threat of a substance, we looked at the percentage of events in that substance category with victims (Table 7a). The most frequently released substances were not necessarily those most likely to involve victims. For example, events categorized as VOCs were reported more often than were events in any other category (13.8%), but only 3.1% of VOCs events involved victims. Chlorine accounted for only 4.0% of all events and 9.8% of all victims, yet 31.2% of chlorine events resulted in victims. Carbon monoxide accounted for 4.5% of events. However, 45.2% of all Carbone monoxide events resulted in victims. A high proportion of ammonia (19.4%) and acids (15.9) related events also resulted in victims.
Table 7a. Frequency of Substance Categories in All Reported HSEES Events and Events with Victims, January 1 – June 30, 2009
Substance Category |
All Events |
Events with victim |
|||
Number |
% |
Number |
% of all events |
% of events in substance category with victims |
|
Category not assigned |
13 |
0.4 |
2 |
0.5 |
15.4 |
Acids |
328 |
9.5 |
52 |
11.8 |
15.9 |
Ammonia |
247 |
7.1 |
48 |
10.9 |
19.4 |
Bases |
212 |
6.1 |
30 |
6.8 |
14.2 |
Carbon Monoxide |
157 |
4.5 |
71 |
16.2 |
45.2 |
Chlorine |
138 |
4.0 |
43 |
9.8 |
31.2 |
Formulations |
7 |
0.2 |
0 |
0.0 |
0.0 |
Hetero-organics |
22 |
0.6 |
2 |
0.5 |
9.1 |
Hydrocarbons |
30 |
0.9 |
1 |
0.2 |
3.3 |
Mixture across chemical category |
391 |
11.3 |
55 |
12.5 |
14.1 |
Multi-substance |
259 |
7.5 |
27 |
6.2 |
10.4 |
Other& |
184 |
5.3 |
23 |
5.2 |
12.5 |
Other inorganic substances&& |
312 |
9.0 |
25 |
5.2 |
12.5 |
Oxy-organics |
188 |
5.4 |
19 |
4.3 |
10.1 |
Paints and dyes |
180 |
5.2 |
1 |
0.2 |
0.6 |
PCBs |
38 |
1.1 |
0 |
0.0 |
0.0 |
Pesticides |
192 |
5.6 |
23 |
5.2 |
12.0 |
Polymers |
82 |
2.4 |
2 |
0.5 |
2.4 |
Volatile organic compounds |
478 |
13.8 |
15 |
3.4 |
3.1 |
Total |
3,548 |
99.9& |
439 |
99.9& |
12.7 |
&&All inorganic substances except for acids, bases, ammonia, and chlorine.
§Total percentage doesn’t equal 100 due to rounding
Victim’s sex
Sex was known for 955 (91.0%) of the 1,050 victims reported from January 1 to June 30, 2009. Of these, 555 (58.1%) were male. Of the 475 employees for whom sex was reported, 287 (60.4%) were male. Of the 390 members of the public for whom sex was reported, 203 (52.1%) were male. Of the 66 responders for whom sex was reported, 51 (77.3%) were male. Of the 24 students for whom sex was reported, 14 (58.3%) were male.
Victim’s age
The median age of the 755 victims for whom an exact age was reported was 36 years (range 0–95 years). The age distribution for these victims was:
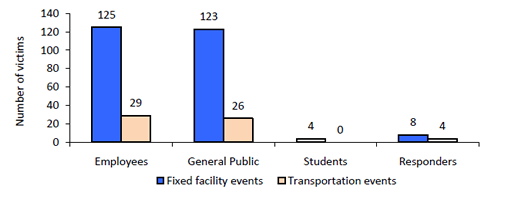
Figure 5a shows the distribution of victims by population group and type of event. Employees (n=522) constituted the largest proportion of the population groups affected, followed by members of the public (n=422).
Figure 5a. Number of Victims, by Population Group and Type of Reported HSEES Event, January 1 – June 30, 2009
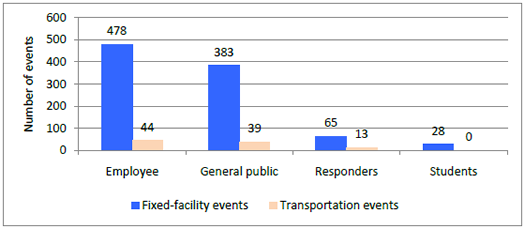
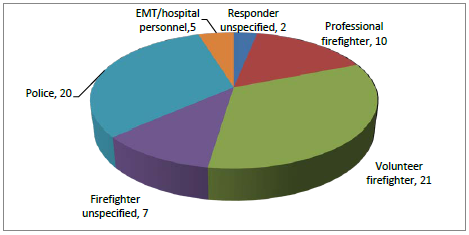
In fixed-facility events, 65 responders were injured, with volunteer firefighters being the most frequent (Figure 5b). In transportation-related events, 13 responders were injured: 10 EMT/Hospital personnel, 2 police officers, and 1 professional firefighter.
Figure 5b. Distribution of Responders Injured in Reported Fixed Facility HSEES Events,January 1 – June 30, 2009
Injuries
A total of 1,682 injuries or symptoms were reported (Table 8a). Some victims had more than one injury or symptom. Of all reported injuries or symptoms, the most common in fixed-facility events were respiratory tract irritation (28.0%), headaches (14.3%), gastrointestinal symptoms (13.4%), dizziness or other central nervous system symptoms (11.8%), and eye irritation (10.7%). In transportation-related events, trauma (25.4%), respiratory tract irritation (23.1%), and eye irritation (13.4%) were reported most frequently.
Table 8a. Frequency of Injuries and Symptoms, by Type of Reported HSEES Event,January 1 – June 30, 2009
Type of Injury/Symptom |
Fixed facility |
Transportation |
All events |
|||
Number of injuries/ |
% |
Number of injuries/ |
% |
Number of injuries/ |
% |
|
Burns |
98 |
6.3 |
9 |
6.7 |
107 |
6.4 |
Dizziness/Central Nervous System Symptoms |
183 |
11.8 |
8 |
6.0 |
191 |
11.4 |
Eye Irritation |
166 |
10.7 |
18 |
13.4 |
184 |
10.9 |
Gastrointestinal |
208 |
13.4 |
9 |
6.7 |
217 |
12.9 |
Headache |
221 |
14.3 |
5 |
3.7 |
226 |
13.4 |
Heart Problem |
15 |
1.0 |
2 |
1.5 |
17 |
1.0 |
Other |
39 |
2.5 |
7 |
5.2 |
46 |
2.7 |
Respiratory Irritation |
433 |
28.0 |
31 |
23.1 |
464 |
27.6 |
Shortness of Breath |
40 |
2.6 |
0 |
0 |
40 |
2.4 |
Skin Irritation |
95 |
6.1 |
11 |
8.2 |
106 |
6.3 |
Trauma |
50 |
3.2 |
34 |
25.4 |
84 |
5.0 |
Total |
1,548 |
§99 |
134 |
§99 |
*1,682 |
100.0 |
§Total percentage doesn’t equal 100 due to rounding
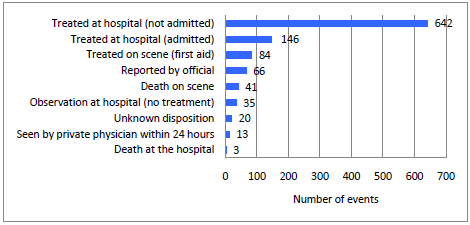
Of the 1,050 victims, 642 were treated at hospitals without admission, 146 were treated at the hospital and admitted, 84 were treated at the scene, 66 were injuries experienced within 24 hours of event and reported by officials (e.g., fire department, EMT), 35 were observed at the hospital without treatment, 13 were seen by a private physician within 24 hours, and 44 were reported as deaths (Figure 6a). For 20 victims, disposition was unknown.
Personal Protective Equipment
Selection of appropriate personal protective equipment (PPE) is a complex process that should take into account identification of the hazards or suspected hazards, routes of potential hazards (e.g., inhalation, skin absorption, ingestion, and eye or skin contact), and the performance of the PPE materials in providing a barrier to these hazards. The amount of protection provided by PPE is material or hazard-specific.
From January 1 to June 30, 2009, only 97 of 475 employee victims (20.4%) and 33 of 74 responder-victims (44.6%) wore PPE. Whether PPE was worn was unknown for 47 employee-victims and 4 responder-victims. Of the 97 employee-victims who wore PPE, most (n=11) wore level D, 4 wore level C, 1 wore level B, 2 wore level A, and 79 employee victims wore other types of protection. Among the 31 injured firefighters who wore PPE, 17 wore firefighter turnout gear with respiratory protection, and 14 wore firefighter turnout gear without respiratory protection. Only one police officer wore level D and none of the “responder not specified” category wore PPE.
Nearby Populations
The proximity of an event to selected vulnerable areas was determined either by use of geographic information systems (GIS) or, if more accurate data were available, by the health department. Industries or other businesses were within ¼ mile of 2,896 events, residences within ¼ mile of 2,619 events, schools were within ¼ mile of 356 events, licensed daycare centers were within ¼ mile of 367 events, recreational areas were within ¼ mile of 371 events, nursing homes were within ¼ mile of 118 events, and hospitals were within ¼ mile of 30 events. For 333 events, information about nearby population areas was not recorded.
Evacuations and Sheltering
Evacuations were ordered in 260 of 3,419 events for which evacuation status was reported. Of these evacuations, the majority (82.3%) were from the building or affected areas of the building. Fewer evacuations were from a circular area surrounding the event generated by computer or defined by investigator (10.4%), areas downwind or downstream (2.8%), or a circular and downwind or downstream area (1.2%). The criteria for evacuation area were not defined for 260 evacuations (3.2%). The number of persons evacuated was known for 157 (60.4%) of the events and ranged from 0 to 3,600 persons, with a median of 15. The median duration of evacuation was 2 hours (range: 0.2 hours to 30 days). For 50 events (19.2%), the duration of evacuation was missing. Sheltering-in-place was ordered in only 34 incidents (1.0%). Sheltering-in-place means to stay inside, seal the windows and doors, and shut off any ventilation from the outside. Sheltering-in-place is ordered when an exposure threat is imminent and the safest option is to stay in one place to avoid evacuating through a hazardous cloud.
Decontamination
Of the 3,458 events, decontamination status was known for 498 exposed uninjured people; 315 persons were decontaminated at the scene, and 183 were decontaminated at a medical facility.
Decontamination status was known for 1,008 injured. Most people (748 [74%]) were not decontaminated. Of those who were decontaminated, 81 were decontaminated at the scene, 134 were decontaminated at medical facilities, and 45 were decontaminated both at the scene and at medical facilities.
Most responders are trained to decontaminate. Thus, they may be more likely to do so, even if only as a precaution. Of the responder victims, 60.0% of EMTs, 23.1% of firefighters, and 30.0% of police were decontaminated. Neither of the two responders of unknown type was decontaminated. Non-responders may not be as aware of the need for decontamination. Of the non-responder victims, 24.7% of employees, 28.6% of students, and 72.6% of the public received decontamination.
Response
Information on responder type was known for 3,362 events. One responder category was reported for 2,358 events and multiple responder categories for 771 events. No responders were reported for 233 events. The most frequently reported responder group was the company response team, followed by fire departments, law enforcement agencies and certified HazMat teams (Table 9a).
Table 9a. Distribution of HSEES Responder Categories, January 1 – June 30, 2009
Responder Category |
Number of events |
Company’s Response Team |
2,202 |
Fire Department |
576 |
Law Enforcement Agency |
411 |
Third Party Clean-up Contractors |
319 |
Certified HazMat Team |
236 |
EMT |
224 |
Environmental Agency/EPA Response Team |
210 |
Other |
231 |
Reporting Timeliness
Of the 2,361 events that occurred in fixed facilities, 1,655 (70.1%) were reported to HSEES within 48 hours of the event; only 36.1% of the 1,087 transportation events were reported within 48 hours. The Department of Transportation is a primary reporting source for transportation events for many states. Transportation companies have to report incidents to the US Department of Transportation, but reports are not required within 48 hours, thereby delaying HSEES reporting.
PART II
HAZARDOUS SUBSTANCES EMERGENCY EVENTS SURVEILLANCE, JULY 1-DECEMBER 31, 2009
HAZARDOUS SUBSTANCES EMERGENCY EVENTS SURVEILLANCE, JULY 1-DECEMBER 31, 2009
Events
From July 1 to December 31, 2009, six states, Louisiana, North Carolina, New York, Oregon, Utah and Wisconsin, funded under NTSIP continued to report events to the HSEES program (Figure 1b). During this time, a total of 1,352 acute hazardous substances events met the criteria for inclusion in HSEES.
More than two thirds of these events (942) occurred in fixed facilities and 410 events occurred during transportation. Two states, New York and Louisiana, accounted for 65.2% of all events (Table 1b).
Table 1b. Number of Reported HSEES Incidents, by State and Type of Event, July 1 – December 31, 2009.
| STATE | Fixed Facility | Transportation | Total Events | ||
| Number of Events | % | Number of Events | % | ||
| Louisiana | 342 | 85.7 | 57 | 14.3 | 399 |
| North Carolina | 47 | 41.2 | 67 | 58.8 | 114 |
| New York | 356 | 72.7 | 127 | 26.3 | 483 |
| Oregon | 90 | 82.6 | 19 | 17.4 | 109 |
| Utah | 52 | 47.7 | 57 | 52.3 | 109 |
| Wisconsin | 55 | 39.9 | 83 | 60.1 | 138 |
| Total | 924 | 69.7 | 410 | 30.3 | 1,352 |
Fixed Facility Events
For each fixed-facility event, event reporters could select one or two areas (specific location at the fixed facility where the event occurred) or types of equipment involved, in accordance with the North American Industry Classification System (NAICS)[3]. Of 942 fixed-facility events, one area was reported for 484 (51.4%) events and a combination of two areas was reported for 30 (2.3%) events. For 428 (45.3%) events, area was not reported. The main areas of fixed facility events were classified as ancillary processing equipment, piping, storage above ground, process vessel, transformer or capacitor, and heating/cooling for building (Figure 2b).
Transportation Events
Most (92.2%) transportation-related events occurred during ground transport (e.g., truck, van, tractor), and 6.1% occurred during rail transport. Fewer events occurred during water (0.9%), air (0.5%), or pipeline (0.2%) transport. No multiple transportation modes were reported.
Most transportation-related events were either discovered after arrival at a fixed facility (41.4%), occurred during vehicle/vessel unloading (24.8%), or involved releases from a moving vehicle or vessel (23.5%). Fewer events involved a stationary vehicle or vessel (10.1%). The transportation phase during which the release occurred was not reported for 0.3% of events.
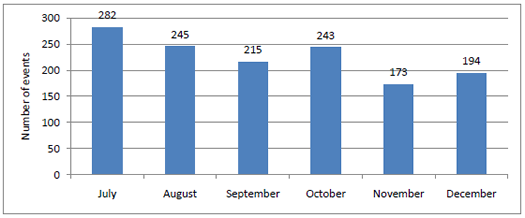
Timing of Events
The number of events per month ranged from 173 (12.8%) in November to 282 (20.9%) in July. The highest number of events occurred in July (Figure 3b).
About 85.9% of events occurred on a weekday and 14.1% on the weekend. Most events occurred during daytime business hours. Of the 1,314 events for which time of day was reported:
Contributing Factors Contributing factors were reported as either primary (root) or secondary causes. Primary factors were reported for 1,343 (99.3%) events (Figure 3c). Equipment failure and human error were the leading primary factors. Primary factors differed by location: for fixed-facility events the leading factor was equipment failure; for transportation-related events the leading factor was human error.
Secondary factors were reported for 759 events (Figure 3d). The secondary factors most often reported were improper filling loading or packing (n=242) and system/process upset (n=130).
Secondary factors were reported for 464 fixed facility events and 295 transportation events. For fixed-facility events the most frequently reported secondary factor was system/process upset (129). For transportation-related events the most frequently reported factors were improper filling, loading, or packing (198).
Industries
The largest number of HSEES events was associated with Transportation and Warehousing (NAICS 48-49, n=442) and Manufacturing (NAICS 31-33, n=437) (Table 2b).
The largest proportion of the events (29.7%, n=402) was associated with NAICS 48 (Transportation and Warehousing). The second largest number of events (27.2%, n=368) and the highest number of victims (n=47) were associated with NAICS 32 (Manufacturing segment consisting of wood, paper, printing, petroleum and coal, chemical, plastic and rubber, and nonmetallic mineral manufacturing).
The highest number of events with victims (n=23) and the second largest number of victims (n=39) were associated with NAICS 81 (Other Services).
Although NAICS 48 (Transportation and Warehousing) and NAICS 32 (Manufacturing) resulted in the largest proportion of events, only a small portion of those events (2.7% and 3.3% respectively) involved victims. By contrast, although NAICS 72 (Accommodation and Food Services) accounted for only 0.8% of all events, 81.8% of events from that industry involved victims, accounting for 12.2% of all victims.
Table 2b. Industries Involved in Reported HSEES Events, by Category, June 1-December 31, 2009
|
Industry Category |
Total Events |
Victims | ||
|
2-digit NAICS |
Number of |
% of Events |
Number of Events |
Total Number |
|
(11) Agriculture, Forestry, Fishing and Hunting |
20 |
1.5 |
3 |
9 |
|
(21) Mining |
15 |
1.1 |
1 |
1 |
|
(22) Utilities |
80 |
5.9 |
5 |
6 |
|
(23) Construction |
16 |
1.2 |
0 |
0 |
|
(31) Manufacturing |
29 |
2.1 |
4 |
9 |
|
(32) Manufacturing |
368 |
27.2 |
12 |
47 |
|
(33) Manufacturing |
40 |
3.0 |
3 |
4 |
|
(42) Wholesale Trade |
29 |
2.1 |
3 |
6 |
|
(44) Retail Trade |
14 |
1.0 |
4 |
5 |
|
(45) Retail Trade |
7 |
0.5 |
0 |
0 |
|
(48) Transportation and Warehousing |
402 |
29.7 |
11 |
12 |
|
(49) Transportation and Warehousing |
40 |
3.0 |
1 |
6 |
|
(51) Information |
3 |
0.2 |
0 |
0 |
|
(52) Finance and Insurance |
0 |
0 |
0 |
0 |
|
(53) Real Estate and Rental and Leasing |
33 |
2.4 |
7 |
22 |
|
(54) Professional, Scientific, and Technical Services |
4 |
0.3 |
0 |
0 |
|
(55) Management of Companies and Enterprises |
0 |
0 |
0 |
0 |
|
(56) Administrative, Support, Waste Management and Remediation Services |
28 |
2.1 |
0 |
0 |
|
(61) Educational Services |
28 |
2.1 |
5 |
14 |
|
(62) Health Care and Social Assistance |
12 |
0.9 |
7 |
24 |
|
(71) Arts, Entertainment, and Recreation |
18 |
1.3 |
8 |
36 |
|
(72) Accommodation and Food Services |
11 |
0.8 |
9 |
30 |
|
(81) Other Services |
75 |
5.6 |
23 |
39 |
|
(92) Public Administration |
6 |
0.4 |
1 |
10 |
|
Unknown |
74 |
5.5 |
22 |
39 |
|
Total |
1,352 |
99.9§ |
129 |
319 |
§ Total percentage doesn’t equal 100 due to rounding.
31 Includes food, beverage, tobacco, textile, apparel, and leather and allied products manufacturing
32 Includes wood, paper, printing, petroleum and coal, chemical, plastic and rubber, and non-metallic mineral manufacturing |
33 Includes metal, machinery, electronics, appliances, transportation equipment, furniture and miscellaneous manufacturing
44 Includes motor vehicle, furniture and home furnishings, electronics and appliances, building materials and garden equipment, food and beverages, health and personal care, gasoline, and clothing and accessories
45 Includes sporting goods, hobby, book and music supplies, general merchandise, and miscellaneous 48 Includes transportation by air, rail, water, truck, transit and ground passenger, pipeline, scenic and sightseeing, and transportation support activities.
49 Includes postal service, couriers and messengers, and warehousing and storage.
Substances
In most events (93.6%), all substances involved actually were released. Threatened releases accounted for 3.1% of events. In 3.3% of events, a release was both threatened and actually occurred. Of the 1,673 substances involved in events, 95.3% actually were released and 4.7% were part of a threatened release. In 1,179 events, one substance was involved, 102 events involved two substances, and 71 events involved more than two substances (Table 3b). Fixed-facility events were more likely to involve three or more substances than were transportation events (7.2% vs. 0.6%).
Table 3b. Number of Substances Involved Per Reported HSEES Event, by Type of Event, July 1 – December 31, 2009.
| Number of substances | Type of event | All events | |||||||
| Fixed facility | Transportation | ||||||||
| Number of Events | % | Total substances | Number of Events | % | Total Substances | Number of Events | % | Total Substances | |
| 1 | 814 | 86.4 | 814 | 365 | 89.0 | 365 | 1,179 | 87.2 | 1,179 |
| 2 | 60 | 6.4 | 120 | 42 | 10.2 | 84 | 102 | 7.5 | 204 |
| 3 | 34 | 3.6 | 102 | 1 | 0.2 | 3 | 35 | 2.6 | 105 |
| 4 | 19 | 2.0 | 76 | 1 | 0.2 | 4 | 20 | 1.5 | 80 |
| >=5 | 15 | 1.6 | 100 | 1 | 0.2 | 5 | 16 | 1.2 | 105 |
| Total | 942 | 100.0§ | 1,212 | 410 | 99.8§ | 461 | 1,352 | 100.0 | 1,673 |
The five substances most frequently released or threatened to be released in the order of frequency were paint not otherwise specified, ammonia, carbon monoxide, ethylene glycol, and sodium hydroxide (Table 4b).
Table 4b. Substances Most Frequently Released or Threatened to Be Released in Reported HSEES Events. July 1-December 31, 2009
|
Rank |
Substance |
Number Events |
|
1 |
Paint NOS* |
68 |
|
2 |
Ammonia |
63 |
|
3 |
Carbon monoxide |
62 |
|
4 |
Ethylene glycol |
55 |
|
5 |
Sodium hydroxide |
50 |
|
6 |
Sulfur dioxide |
44 |
|
7 |
Ethylene |
42 |
|
8 |
Hydrochloric acid |
42 |
|
9 |
Hydrogen sulfide |
42 |
|
10 |
Benzene |
35 |
|
11 |
Sulfuric acid |
33 |
|
12 |
Propylene |
29 |
|
13 |
Chlorodifluoromethane |
27 |
15 |
Mercury |
25 |
|
17 |
Chlorine |
23 |
|
18 |
Volatile organic compounds NOS* |
23 |
|
19 |
Isopropanol |
21 |
|
20 |
Acetone |
18 |
The substance categories most frequently released in fixed facilities events were volatile organic compounds (VOCs) (28.6%), other inorganic substances (18.2%), and acids (7.5%), (Table 5b). In transportation-related events, the most common categories were VOCs (19.5%), acids (15.0%), and bases (15.0%).
Table 5b. Number of Substances Involved by Substance Category, and Type of Reported HSEES Event, July 1 to December 31, 2009*
|
Expanded Substance Category |
Type of Event |
All events | ||||
|
Fixed facility |
Transportation | |||||
|
Number of Substances |
% |
Number of Substances |
% |
Number of Substances |
% | |
| Acids |
91 |
7.5 |
69 |
15 |
160 |
9.6 |
|
Agricultural chemicals, pesticides |
32 |
2.6 |
14 |
3.0 |
46 |
2.7 |
|
Ammonia |
65 |
5.4 |
4 |
0.9 |
69 |
4.1 |
|
Bases |
49 |
4.0 |
69 |
15.0 |
118 |
7.1 |
|
Category not assigned |
5 |
0.4 |
2 |
0.4 |
7 |
0.4 |
|
Chlorine |
40 |
3.3 |
9 |
2.0 |
49 |
2.9 |
| Carcon Monoxide | 6.2 | 5.1 |
0 | 0.0 | 62 | 3.7 |
|
Formulations |
4 |
0.3 |
1 |
0.2 |
5 |
0.3 |
|
Hetero-organics |
11 |
0.9 |
1 |
0.2 |
12 |
0.7 |
|
Hydrocarbons |
31 |
2.6 |
4 |
0.9 |
35 |
2.1 |
|
Mixture across chemical category* |
38 |
3.1 |
13 |
2.8 |
51 |
3.0 |
|
Other † |
72 |
5.9 |
27 |
5.9 |
99 |
5.9 |
|
Other inorganic substances ‡ |
220 |
18.2 |
24 |
5.2 |
244 |
14.6 |
|
Oxy-organics |
65 |
5.4 |
41 |
8.9 |
106 |
6.3 |
|
Paints and dyes |
35 |
29 |
66 |
14.3 |
101 |
6.0 |
|
PCB's |
13 |
1.1 |
0 |
0.0 |
13 |
0.8 |
|
Polymers |
32 |
2.6 |
27 |
5.9 |
59 |
3.5 |
|
Volatile organic compounds |
347 |
28.6 |
90 |
19.5 |
437 |
26.1 |
|
Total |
1,212 |
99.9§ |
461 |
100.1§ |
1,673 |
99.8§ |
‡All inorganic substances except for acids, bases, ammonia, and chlorine.
§ Total percentage doesn’t equal 100 due to rounding
One release type was reported for 1,178 single substance releases: spills (n=749), air (n=378), threatened release (n=33), fire (n=15), explosion (n=3). Two release types were reported for 33 chemicals in the following combinations: spill and air (n=19), spill and fire (n=6), air and fire (n=2), fire and explosion (n=4), spill and explosion (n=1), and air and explosion (n=1).
Victims
From July 1 to December 31, 2009, there were 319 victims in 129 events (9.5% of all events) (Table 6b). Of these events, 81 involved only one victim and 48 involved two or more victims. The event with the most victims involved 20 victims. Most victims (82.9%) were injured in fixed-facility events. Three or more victims per event were reported in 25.1% of fixed facility events and in 9.1% of transportation-related events.
Table 6b. Number of Victims per Reported HSEES Event, by Type of Event, January 1 – June 31, 2009
|
Number of Victims per Event |
Type of Event |
All Events | |||||||
|
Fixed Facility |
Transportation |
Number of Events |
% |
Total | |||||
|
Number of Events |
% |
Total Victims |
Number of Events |
% |
Total Victims | ||||
|
1 |
63 |
58.9 |
63 |
18 |
81.8 |
18 |
81 |
62.8 |
81 |
|
2 |
17 |
15.9 |
34 |
2 |
9.1 |
4 |
19 |
14.7 |
38 |
|
3 |
7 |
6.5 |
21 |
0 |
0 |
0 |
7 |
5.4 |
21 |
|
4 |
4 |
3.7 |
16 |
0 |
0 |
0 |
4 |
3.1 |
16 |
|
5 |
1 |
0.9 |
5 |
0 |
0 |
0 |
1 |
0.8 |
5 |
|
>=6 |
15 |
14.0 |
121 |
2 |
9.1 |
37 |
17 |
13.2 |
158 |
|
Total |
107 |
99.9§ |
260 |
22 |
100.0 |
59 |
129 |
100.0 |
319 |
Substance Category and Victims
Events were classified by only one substance category, even if multiple substances were involved. If multiple substances from the same category were involved, that category was used for the event. If multiple substances from different categories were involved, the event was categorized as “multiple substances.”
To judge the relative threat of a substance, we looked at the percentage of events in that substance category with victims (Table 7b). The most frequently released substance was VOCs (18.6%), but only 4.0% of all VOC events involved victims. Formulations accounted for only 0.1% of all events, yet 50.0% of formulations events resulted in victims. Victims were also involved in high proportion of mixture-across-chemical-category (35.4%) and carbon monoxiderelated (31.5%) events.
Table 7b. Frequency of Substance Categories in All Reported HSEES Events and Events with Victims, July 1 – December 31, 2009*
|
Substance Category |
All Events |
Events with victim | |||
|
Number |
% |
Number |
% of all Events with Victims |
% of Events in Substance Category With Victims | |
|
Category not assigned |
4 |
0.3 |
0 |
0.0 |
0.0 |
|
Acids |
119 |
8.8 |
13 |
10.1 |
109.9 |
|
Ammonia |
59 |
4.4 |
8 |
6.2 |
13.6 |
|
Bases |
95 |
7.0 |
10 |
7.8 |
10.5 |
|
Chlorine |
43 |
3.2 |
13 |
10.1 |
30.2 |
|
Carbon Monoxide |
54 |
4.0 |
17 |
13.2 |
31.5 |
|
Formulations |
2 |
0.1 |
1 |
0.8 |
50.0 |
|
Hetero-organics |
11 |
0.8 |
1 |
0.8 |
9.1 |
|
Hydrocarbons |
19 |
1.4 |
1 |
0.8 |
5.3 |
|
Mixture across Chemical Category |
48 |
3.6 |
17 |
13.2 |
35.4 |
|
Multi-chemical category |
173 |
12.8 |
8 |
6.2 |
4.6 |
|
Other& |
72 |
5.3 |
10 |
7.8 |
13.9 |
|
Other inorganic substances&& |
143 |
10.6 |
7 |
5.4 |
4.9 |
|
Oxy-Organics |
99 |
7.3 |
4 |
3.1 |
4.0 |
|
Paints & dyes |
77 |
5.7 |
2 |
1.6 |
2.6 |
|
PCB's |
13 |
1.0 |
0 |
0.00 |
0.00 |
|
Pesticides |
33 |
2.4 |
4 |
3.1 |
12.1 |
|
Polymers |
37 |
2.7 |
3 |
2.3 |
8.1 |
|
VOC's |
251 |
18.6 |
10 |
7.8 |
4.0 |
|
Total |
1,352 |
100.0 |
129 |
100.3§ |
9.5 |
& Not belonging to one of the existing categories.
&&All inorganic substances except for acids, bases, ammonia, and chlorine.
§ Total percentage doesn’t equal 100 due to rounding
Victim’s sex
Sex was known for 268 of the 319 victims. Of these, 172 (64.2%) were male. Of the 133 of 154 employees for whom sex was reported, 73.7% were male. Of the 123 of 149 victims who were members of the public for whom sex was reported, 51.2% were male. All 11 responders for whom sex was reported were male. The one student for whom sex was reported was female.
Victim’s age
Age category was reported for 278 victims. Ninety-three were children younger than 18 years of age and 185 were adults 18 years or older. The median age of the 173 victims for whom an exact age was reported, was 34 years (range 0–77 years). The age distribution for these victims was
Figure 4c shows the distribution of victims by population group and type of event. Employees (154) constituted the largest proportion of the population groups affected, followed by members of the general public (149).
Figure 4c. Number of Victims, by Population Group and Type of Reported HSEES Event, July 1 – December 31, 2009.
In fixed-facility events, 8 responders were injured: 4 police officers and 4 firefighters not specified category. In transportation-related events, 4 police officers were injured.
Injuries
A total of 422 injuries or symptoms were reported (Table 8b). Some victims had more than one injury or symptom. Of all reported injuries or symptoms, the most common in fixed-facility events were respiratory tract irritation (27.6%), dizziness or other central nervous system symptoms (24.7%), headaches (11.4%), and gastrointestinal problems (10.2%). In transportation-related events, respiratory tract irritation (67.1%), and trauma (11.4%) were reported most frequently.
Table 8b. Frequency of Injuries and Symptoms, by Type of Reported HSEES Event, July 1 – December 31, 2009.
|
Type of Injury/Symptom |
Fixed facility |
Transportation |
All events | |||
|
Number of Injuries/ |
% |
Number of Injuries/ |
% |
Number of Injuries/ |
% | |
|
Burns |
25 |
7.1 |
1 |
1.4 |
26 |
6.2 |
|
Dizziness/Central Nervous System Symptoms |
87 |
24.7 |
3 |
4.3 |
90 |
21.3 |
| Eye Irritation |
32 |
9.1 |
3 |
4.3 |
35 |
8.3 |
| Gastrointestinal |
36 |
10.2 |
0 |
0 |
36 |
8.5 |
| Headache |
40 |
11.4 |
1 |
1.4 |
41 |
9.7 |
| Heart Problem |
3 |
0.9 |
1 |
1.4 |
4 |
1.0 |
| Other |
11 |
3.1 |
1 |
1.4 |
12 |
2.8 |
| Respiratory Irritation |
97 |
27.6 |
47 |
67.1 |
144 |
34.1 |
| Shortness of Breath |
11 |
3.1 |
2 |
2.9 |
13 |
3.1 |
| Skin Irritation |
6 |
1.7 |
3 |
4.3 |
9 |
2.1 |
| Trauma |
4 |
1.1 |
8 |
11.4 |
12 |
2.8 |
| Total |
352 |
100.0 |
70 |
99.9§ |
422 |
99.9§ |
§ Total percentage doesn’t equal 100 due to rounding
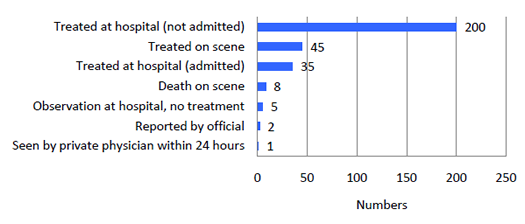
Of the 319 victims, 200 were treated at hospitals without admission, 45 were treated at the scene, 35 were treated at hospital and admitted, 5 were observed at hospital without treatment, 2 experienced injuries within 24 hours of event and were reported by a response official (e.g., fire department, EMT), one was seen by a private physician within 24 hours, and 8 deaths were reported (Figure 5c). For 23 victims, disposition was unknown.
Figure 5c. Injury Disposition in Reported HSEES Events, July 1 – December 31, 2009
Personal Protective Equipment
Only 1 of 133 employee victims and 4 of 12 responder-victims were reported to have worn PPE. Whether PPE was worn was unknown for 21 employee-victims. The employee-victims wore level D type of protection. All four injured firefighters, wore fire fighter turn-out gear with respiratory protection. None of the injured police officers wore any type of protection.
Nearby Populations
Residences were within ¼ mile of 1,137 events, industries or other businesses within ¼ mile of 1,116 events, schools were within ¼ mile of 159 events, licensed daycare centers were within ¼ mile of 175 events, recreational areas were within ¼ mile of 130 events, nursing homes were within ¼ mile of 58 events, and hospitals were within ¼ mile of 19 events. For 77 events, information about nearby population areas was not collected.
Evacuations and Sheltering
From July 1 to December 31, 2009, evacuations were ordered in 121 events. Of these evacuations, 83.2% were from the building or affected areas of the building, 10.1% evacuations were from a circular area surrounding the event generated by computer or defined by investigator, 2.5% evacuations were from areas downwind or downstream, 3.4% from a circular and downwind or downstream area, and 0.8% had no defined criteria. The number of persons evacuated was known for 52 (42.9%) of the events and ranged from 2 to 15,000 persons, with a median of 18. The median duration of evacuation was 2 hours (range: 0.5 hours to 58 days). For 16 (13.2%) events, the duration of evacuation was missing. Sheltering-in-place was ordered in 6 incidents (0.4%).
Decontamination
In 1,352 events decontamination status was known for 112 exposed uninjured people; 69 of them were decontaminated at the scene and 43 at a medical facility.
Of the 293 injured for whom decontamination status was known, 209 were not decontaminated, 33 were decontaminated at the scene, 43 were decontaminated at a medical facility, and 8 were decontaminated both at the scene and at a medical facility.
No injured firefighters were decontaminated. Three of 8 injured police officers were decontaminated at a medical facility, one was decontaminated at both the scene and medical facility and 4 were not decontaminated. Of the non-responder victims, 57 (38.3%) employees, 20 (15.6%) members of the public and 3 (75%) students received decontamination.
Response
No responder types were reported for 22 events. A single responder category was reported for 768 events and multiple responder categories for 562. The most frequently reported responder group was the company response team, followed by fire departments, law enforcement agencies, certified HazMat teams, EMT and EPA response team (Table 9b).
Table 9b. Distribution of HSEES Responder Categories, July 1 -December 31, 2009
|
Responder Category |
Number of events |
|
Company's response team |
1093 |
|
Fire department |
242 |
|
Law enforcement agency |
160 |
|
Certified Haz Mat team |
114 |
|
EMT |
109 |
|
Environmental agency/EPA response team |
109 |
|
Third Party clean-up contractors |
89 |
|
Other |
142 |
Reporting Timeliness
Of the 942 events that occurred in fixed facilities, 73.3% were reported to HSEES within 48 hours of the event; only 34.4% of the 410 transportation events were reported within 48 hours. The Department of Transportation is a primary reporting source for transportation events for many states. Transportation companies have to report incidents to the US Department of Transportation, but reports are not required within 48 hours, thereby delaying HSEES reporting.
CUMULATIVE RESULTS, 1993-2009
HSEES was supported by a series of 5-year competitive, cooperative agreements funded by ATSDR with additional support in recent years from the Centers for Disease Control and Prevention’s Coordinating Office for Terrorism Preparedness and Emergency Response. States receiving funds changed over the years (Table 10). Due to the funding changes in July 2009, only 6 states continued collecting data from July1 to December 31, 2009.
Table 10. Years of HSEES Participation, by State, 1993–2009*
| State | Years Participated |
|
Alabama |
1993-2003 |
|
Colorado |
1993-June 30, 2009 |
|
Florida |
2005-June 30, 2009 |
|
Iowa |
1993-June 30, 2009 |
|
Louisiana |
2001-December 31, 2009 |
|
Michigan |
2005-June 30, 2009 |
|
Minnesota |
1995-June 30, 2009 |
|
Mississippi |
1995-2003 |
|
Missouri |
1994-2005 |
|
New Hampshire |
1993-1996 |
|
New Jersey |
2000-2008** |
|
New York |
1993-December 31, 2009 |
|
North Carolina |
1993- December 31, 2009 |
|
Oregon |
1993-December 31, 2009 |
|
Rhode Island |
1993-2001 |
|
Texas |
1993-July 30, 2009 |
|
Utah |
2000-December 31, 2009 |
|
Washington |
1993-July 30, 2009 |
|
Wisconsin |
1993-December 31, 2009 |
**NJ was unable to collect complete data in 2006, 2008 and 2009.
Year 2009 was the turning point for the HSEES program. Thirteen states collected data from January 1 to June 30, 2009. Due to the funding changes related to the transformation of the HSEES program to NTSIP in mid-2009, only six states continued collecting data from July 1 to December 31, 2009.
From January 1 to June 30, 2009 a total of 3,458 acute hazardous substances events met the criteria for HSEES inclusion in 13 states. From July 1 to December 31, 2009 a total of 1,352 acute hazardous substances events met the criteria for HSEES inclusion in 6 states.
During 2009, the largest proportion of events occurred in fixed facilities (Table 11). The percentage of fixed-facilities events decreased from 83.5% in 1993 to 69.7% at the end of 2009. The percentage of transportation related events increased from 16.5% in 1993 to 30.3% at the end of 2009.
Table 11. Cumulative HSEES Data by Year
Source: Hazardous Substances Emergency Events Surveillance, 1993–2009*|
Year |
Number of States Participating |
Type of Event |
Number of substances released |
Number of victims |
Number of deaths |
Events with victims | |||
|
Fixed Facility (%) |
Transportation Events (%) |
Total† |
Number |
% | |||||
|
1993 |
11 |
83.5 |
16.5 |
3,833 |
4,361 |
2,230 |
16 |
464 |
12.1 |
|
1994 |
12 |
78.5 |
21.5 |
4,233 |
5,072 |
2,181 |
21 |
414 |
9.8 |
|
1995 |
14 |
80.5 |
19.5 |
5,310 |
6,027 |
1,688 |
14 |
402 |
7.6 |
|
1996 |
13 |
78.9 |
21.1 |
5,488 |
5,861 |
1,622 |
33 |
390 |
7.1 |
|
1997 |
13 |
79.5 |
20.5 |
5,513 |
6,089 |
1,896 |
28 |
372 |
6.7 |
|
1998 |
13 |
79.1 |
20.9 |
5,981 |
6,486 |
1,533 |
36 |
405 |
6.8 |
|
1999 |
15 |
74.1 |
25.9 |
6,260 |
6,974 |
1,912 |
30 |
504 |
8.1 |
|
2000 |
16 |
72.9 |
27.1 |
7,548 |
8,342 |
2,513 |
44 |
752 |
10.0 |
|
2001 |
15 |
75.0 |
25.0 |
8,978 |
11,764 |
2,168 |
22 |
710 |
7.9 |
|
2002 |
15 |
72.1 |
27.9 |
†9,013 |
11,009 |
2,150 |
47 |
739 |
8.2 |
|
2003 |
15 |
74.5 |
25.5 |
9,105 |
12,018 |
1,835 |
51 |
720 |
7.9 |
|
2004 |
13 |
73.4 |
26.6 |
7,744 |
10,323 |
1,838 |
41 |
620 |
8.0 |
|
2005 |
15 |
74.2 |
25.8 |
†8,603 |
11,506 |
2,034 |
69 |
778 |
9.0 |
|
2006 |
13 |
68.1 |
31.9 |
7,268 |
9,462 |
2,190 |
69 |
683 |
9.4 |
|
2007 |
14 |
68.5 |
31.5 |
7,947 |
9,873 |
2,337 |
69 |
778 |
9.0 |
|
2008 |
13 |
69.1 |
30.9 |
7,559 |
9,227 |
2,206 |
56 |
948 |
12.5 |
|
2009 |
13 |
68.3 |
31.7 |
3,458 |
4,074 |
1,050 |
44 |
439 |
12.7 |
|
2009 |
6 |
69.7 |
30.3 |
1,352 |
1,673 |
319 |
8 |
129 |
9.5 |
†The total number of events does not include one event in 2002 and one in 2005 for which the type of event was unknown.
Employees and members of the public remained the groups most often injured (Table 12).
Table 12. Percent of Cumulative HSEES Victims, by Population Group and Year
Source: Hazardous Substances Emergency Events Surveillance, 1993-2009| Year | Employees |
Public |
Responders |
Students |
Unknown |
Total |
|||||
N |
% |
N |
% |
N |
% |
N |
% |
N |
% |
N |
|
|
1993 |
1,285 |
57.9 |
788 |
35.3 |
143 |
6.4 |
n/a |
n/a |
14 |
0.6 |
2,230 |
|
1994 |
977 |
44.8 |
963 |
44.2 |
235 |
10.8 |
n/a |
n/a |
6 |
0.3 |
2,181 |
|
1995 |
907 |
53.7 |
482 |
28.6 |
218 |
12.9 |
81 |
4.8 |
0 |
0.0 |
1,688 |
|
1996 |
830 |
51.2 |
480 |
29.6 |
164 |
10.1 |
145 |
8.9 |
3 |
0.2 |
1,622 |
|
1997 |
1,102 |
58.1 |
580 |
30.6 |
121 |
6.4 |
79 |
4.2 |
14 |
0.7 |
1,896 |
|
1998 |
1,008 |
65.4 |
253 |
16.5 |
107 |
7.0 |
157 |
10.2 |
8 |
0.5 |
1,533 |
|
1999 |
1,125 |
58.8 |
330 |
17.3 |
159 |
8.3 |
297 |
15.5 |
1 |
0.1 |
1,912 |
|
2000 |
1,199 |
47.7 |
593 |
23.6 |
338 |
13.5 |
365 |
14.5 |
17 |
0.7 |
2,512 |
|
2001 |
1,085 |
50.0 |
613 |
28.3 |
291 |
13.4 |
178 |
8.2 |
1 |
0.1 |
2,168 |
|
2002 |
1,008 |
46.9 |
650 |
30.2 |
274 |
12.7 |
211 |
9.8 |
7; |
0.3 |
2,150 |
|
2003 |
943 |
51.4 |
500 |
27.2 |
260 |
14.2 |
132 |
7.2 |
0 |
0.0 |
1,835 |
|
2004 |
837 |
45.5 |
640 |
34.8 |
219 |
11.9 |
142 |
7.7 |
0 |
0.0 |
1,838 |
|
2005 |
795 |
39.1 |
955 |
47.0 |
185 |
9.1 |
99 |
4.9 |
0 |
0.0 |
2,034 |
|
2006 |
1,003 |
45.6 |
774 |
35.3 |
159 |
7.3 |
237 |
10.8 |
17 |
0.8 |
2,190 |
|
2007 |
1,126 |
43.0 |
855 |
36.6 |
139 |
5.9 |
209 |
8.9 |
8 |
0.3 |
2,337 |
|
2008 |
1,006 |
45.6 |
887 |
40.2 |
132 |
6.0 |
180 |
8.2 |
1 |
0.1 |
2,206 |
| 2009 Jan-June |
522 | 49.7 | 422 | 40.2 | 78 | 7.4 | 28 | 2.7 | 0; | 0.0 | 1,050 |
| 2009 July-Dec |
154 | 48.3 | 149 | 46.7 | 12 | 3.8 | 4 | 1.3 | 0 | 0.0 | 319 |
USES OF HSEES DATA
During 2009, ATSDR continued responding to requests for HSEES information from local, state, and federal agencies and organizations. ATSDR and state health department staff presented HSEES data at many local, state, national, and international conferences. The ATSDR HSEES Web site
(http://www.atsdr.cdc.gov/HS/HSEES/)
contains annual reports, published journal articles, public use datasets, and other information.
Public Use Dataset
ATSDR has created a public use HSEES dataset to enable public health professionals and other interested parties to analyze the data. A data dictionary provides users with detailed instructions for working with the dataset. This dataset resides on the HSEES public Web site. Data contained in the file are related to events that occurred in the 17 states participating in HSEES from 1996–2007. The dataset for 2008-2009 will also be placed on the website shortly. To date, 1356 requests for this data have been received.
PREVENTION/OUTREACH ACTIVITIES
The goal of HSEES was to develop strategies that might reduce future morbidity and mortality resulting from the release of hazardous substances. To accomplish this goal, the HSEES program made an important contribution to building capacity within each participating state health department to target prevention activities related to acute spills and their associated public health consequences. The HSEES system also built capacity to alert the proper authorities when a public health action needed immediate implementation.
State HSEES coordinators often conducted activities in collaboration with other local and state agencies. The HSEES program has worked over the years with several CDC Public Health Prevention Specialists trying to build capacity to develop sound prevention activities that can be evaluated for their effectiveness. In 2006, a CDC Public Health Prevention Service fellow developed the “HSEES Prevention Outreach and Evaluation Activity Planning Guide” for use by states. During January 1 to June 30, 2009, HSEES states sponsored 12 prevention/outreach activities that targeted over 48,011 persons. During the period from July 1 to December 31, 2009, HSEES states sponsored 43 prevention/outreach activities that targeted more than 75,503 persons. The HSEES Web page contains links to state HSEES Web pages where many of the prevention/outreach materials are posted.
Examples of prevention activities for 2009 include:Awareness-Promoting Activities
Raising awareness of the public health significance of acute chemical releases and their impacts is important. This occurred mainly through presentations at meetings and distribution of HSEES materials. Increased awareness might result in reduction in hazardous substance releases and public health impact. Increased awareness also may produce better reporting leading to higher number of HSEES events collected. Thus, for these activities, states measured the effects of their activities mainly by the number of people they reached and whether that outreach resulted in changed knowledge or attitudes.
Targeted Activities
Identifying high-risk groups and their preferred channels for receiving information is important for effectively targeting prevention messages. Examples of targeted activities during 2009 included:
Substance-Specific Prevention Activities by HSEES States
Participating states targeted common and dangerous substances including mercury, carbon monoxide, chlorine, sulfuric acid, sulfur dioxide, ammonia, pesticides, and other agricultural substances for prevention activities in 2009. States measured immediate effects (e.g., audience numbers) and mid-term effects (e.g., continued interest, requests for information, changes in behavior). Examples of 2009 state activities include:
The Future of Hazardous Substance Surveillance
An external peer review of the HSEES program in 2005 recommended the development of a national approach to chemical events surveillance. In addition to these recommendations, a series of meetings with interested parties including academia, other federal agencies, and chemical organizations has elicited gaps, overlaps, and needs. This process resulted in the development of the National Toxic Substance Incidents Program (NTSIP). The goal of NTSIP is to reduce the morbidity and mortality from toxic substance incidents. NTSIP employs three components: 1) national level surveillance, 2) state programs, and 3) incident investigations. Funding for HSEES ended in 2009 and NTSIP’s implementation began in fiscal year 2010. For more information on NTSIP, please visit http://www.atsdr.cdc.gov/ntsip/.
References
Acknowledgments
We extend our grateful appreciation to our partners in the participating state health departments who, with diligence and dedication, researched and gathered much of the data for this report. Their assistance, ideas, and comments made this report possible.
Appendix A. 2009 Publications
Welles, W. L., Wilburn, R. E., Ehrlich, J. K. and J. M. Kamara. New York Hazardous Substances Emergency Events Surveillance (HSEES) Data Support Emergency Response, Promote Safety and Protect Public Health. Journal of Loss Prevention in the Process Industries, 22(6), 728-734. 2009.
Welles, W. L. and R. E. Wilburn. EXPECT THE UNEXPECTED and Prevent Firefighter Injuries in Hazmat Events. NYS Association of Fire Chiefs. SIZE UP Issue 1: 44-49. 2009.
Wattigney, W, Rice, N, Cooper, D. Drew, J, Orr, M. State Programs to Reduce Uncontrolled Ammonia Releases and Associated Injury Using the Hazardous Substances Emergency Events Surveillance System. Journal of Occupational and Environmental Medicine, Vol. 51, Number 3:356-363. March, 2009.
Hughes N, Stanbury M. “Hazardous Substances Emergency Events Surveillance in Michigan”, Michigan Department of Community Health. October, 2009.
Submitted Publications
Melnikova N, Lizak W.W, Wilburn, R,E, Rice N, Wu J, Stanbury M. Hazards of Illicit Methamphetamine Production and Efforts at Reduction: Data from the Hazardous Substances Emergency Events Surveillance System. Accepted for publication at Public Health Reports, Special Supplement on Healthy People in a Healthy Environment, spring 2011.
Abstract published at Public Health report, July 2010.
Available at
http://www.publichealthreports.org/EOH-abstracts/Exposures.cfm#26
Stanbury M, Huges N, “Compliance with a law banning mercury in Michigan schools,” submitted for publication.
Agency for Toxic Substances and Disease Registry, 4770 Buford Hwy NE, Atlanta, GA 30341
Tel: (404) 498-0110 / Public Inquiries: (888) 422-8737