- List of Tables
- List of Figures
- List of Appendices
- Executive Summary
- Introduction
- Methods
- Results
- Uses of the HSEES Data
- Prevention Activities
- Acute Release of Hazardous Substances In Schools During 2002
- Summary of Results, 1993-2002
- Reference
- Appendices
- Other Annual Reports
- To describe the distribution and characteristics of acute hazardous substances releases;
- To describe morbidity and mortality among employees, responders, and the general
public that resulted from hazardous
substances releases; - To identify risk factors associated with the morbidity and mortality; and
- To identify strategies that might reduce future morbidity and mortality resulting from the release of hazardous substances.
- Collaboration with the local emergency planning committee to increase awareness of hazardous chemicals through training targeted to the needs of employees, first responders and the general public.
- Collaboration with a poison control center (PCC) to improve the interaction between the PCC and responders who are consulting or treating victims of hazardous substances releases.
- Distribution of ATSDR’s “Managing Hazardous Material Incidents” guidelines on CD-ROM to hospital emergency departments. The guidelines are designed to help health-care providers recognize symptoms of chemical exposure and treat them accordingly.
- Collaboration with state bureau of investigation through fact sheets and information sheets to help reduce exposure and injuries among their personnel during seizures of methamphetamine laboratories.
- Provision of information on HSEES findings related to chlorine releases to managers and operators of swimming pools through telephone outreach. The goal was to increase awareness of the importance of training, storage practices, site security, and maintenance to reduce injuries and evacuations.
- Centers for Disease Control and Prevention: Comprehensive plan for epidemiologic surveillance.
Atlanta: US Department of Health and Human Services; (1986).
- Binder S. Death, injuries, and evacuations from acute hazardous materials releases. Am J Public Health 1989; 70:1042-4.
Download Adobe Acrobat (PDF) version - 3.35 MB
Historical Document
This document is provided by the Agency for Toxic Substances and Disease Registry (ATSDR) ONLY as an historical reference for the public health community. It is no longer being maintained and the data it contains may no longer be current and/or accurate.
In 1980, Congress created the Agency for Toxic Substances and Disease Registry (ATSDR) to implement health-related sections of laws that protect the public from hazardous wastes and environmental spills of hazardous substances. The Comprehensive Environmental Response, Compensation, and Liability Act of 1980 (CERCLA), commonly known as the "Superfund" Act, designated ATSDR as the lead agency within the Public Health Service to help prevent or reduce further exposure to hazardous substances and the adverse health effects that result from such exposures, and also to expand the knowledge base about such effects.
This publication reports the results and findings of a health study, registry, or other health-related activity supported by ATSDR in accordance with its legislative mandate described above.
Comments regarding this report are welcome. Please send your comments to the following address:
Agency for Toxic Substances and Disease Registry
Attn: Director, Division of Health Studies (E-31)
1600 Clifton Road, N.E.
Atlanta, Georgia 30333
Agency for Toxic Substances and Disease Registry
Julie L. Gerberding, MD, MPH, Administrator
Henry Falk, MD, MPH, Assistant Administrator
Division of Health Studies
G. David Williamson, PhD, Director
Sharon Campolucci, MSN, Deputy Director
Kim Blindauer, DVM, MPH, Assistant Director for Science
Epidemiology and Surveillance Branch
Wendy E. Kaye, PhD, Chief
Hazardous Substances Emergency Events Surveillance Staff
Zahava Berkowitz, MSc, MSPH
Kevin Horton, MSPH
Maureen Orr, MS
Shannon Rossiter, MPH
Perri Zeitz Ruckart, MPH
Casetta R. Simmons
Wendy Wattigney, MStat
Charles Weir, MS
Disclaimer
Use of trade names and commercial sources is for identification only and does not imply endorsement by the Agency for Toxic Substances and Disease Registry or the U.S. Department of Health and Human Services.
| Table 1. | Number
of events meeting the surveillance definition, by state and type of event,
Hazardous Substances Emergency Events Surveillance, |
| Table 2. | Number of substances
involved per event, by type of event, Hazardous Substance Emergency Events Surveillance, 2002 |
| Table 3. | Industries involved
in hazardous substances events, by category, Hazardous Substances Emergency Events Surveillance, 2002 |
| Table 4. | Number
of substances involved, by substance category and type of event, Hazardous
Substances Emergency Events Surveillance, 2002 |
| Table 5. | Number
of victims per event, by type of event, Hazardous Substances Emergency Events
Surveillance, 2002 |
| Table 6. | Frequency of substance
categories in all events and events with victims, Hazardous Substances Emergency Events Surveillance, 2002 |
| Table 7. | Frequencies of injuries/symptoms,
by type of event, Hazardous Substances Emergency Events Surveillance, 2002 |
| Table 8. | Cumulative
data for all states, by year, for the states reporting to the Hazardous
Substances Emergency Events Surveillance, 2002 |
List of Figures
| Figure 1. | Areas of
fixed facilities involved in events, Hazardous Substances Emergency Events
Surveillance, 2002 |
| Figure 2. | Distribution
of transportation-related events, by type of transport, Hazardous Substances Emergency Events Surveillance, 2002 |
| Figure 3. | Factors reported
as contributing to events, Hazardous Substances Emergency Events Surveillance, 2002 |
| Figure 4. | Number of
victims, by population group and type of event, Hazardous Substances Emergency Events Surveillance, 2002 |
| Figure 5a. | Distribution
of responders injured in fixed-facility events, by type of responder, Hazardous
Substances Emergency EventsSurveillance, 2002 |
| Figure 5b. | Distribution
of responders injured in transportation events, by type of responder, Hazardous Substances Emergency Events Surveillance, 2002 |
| Figure 6. | Injury disposition, Hazardous Substances Emergency Events Surveillance 2002 |
| Figure 7. | Cumulative
data for all participating states, Hazardous Substances Emergency Events
Surveillance, 1993-2002 |
| Figure 8. | Number of
victims by category and year Hazardous Substances Emergency Events Surveillance, 1993-2002 |
List of Appendices
| Appendix A. | The hundred
most frequent substances involved in events, Hazardous Substances Emergency Events Surveillance, 2002 |
| Appendix B. | Hazardous Substances Emergency Events Surveillance-Related Publications |
Executive Summary
The Hazardous Substances Emergency Events Surveillance (HSEES)
system, maintained by the Agency for Toxic Substances and Disease Registry (ATSDR),
actively collects information to describe the public health consequences of
the release of hazardous substances. This report summarizes the characteristics
of events reported to the 15 state health departments that participated in HSEES
in 2002. Information about acute events involving hazardous substances was collected,
including the substance(s) released, number of victims, number and types of
injuries, and number if evacuations. The data were computerized using an ATSDR-provided
Web-based data entry system.
A total of 9014 events were reported. In 8153 (90.4%) events, only one substance
was released. The most commonly reported categories of substances were inorganic
substances (excluding acids, bases, ammonia, and chlorine); mixtures involving
multiple substances from different substance categories that had been mixed
before the event; and volatile organic compounds. During this reporting period,
739 events (8.2 % of all reported events) resulted in a total of 2150 victims,
of whom 47 (2.2%) died. The most frequently reported injuries were respiratory
symptoms, eye irritation, dizziness or other central nervous system symptoms,
and headache. Evacuation reportedly was ordered for 545 (6.0%) events.
The findings regarding the percentages of events with victims and events with
evacuations and the distributions of the numbers and types of injuries reported
have overall been consistent over time.
Introduction

The Centers for Disease Control and Prevention defines surveillance
as "ongoing, systematic collection, analysis, and interpretation of health data
essential to the planning, implementation, and evaluation of public health practice,
closely integrated with the timely dissemination of these data to those who
need to know. The final link of the surveillance chain is the application of
these data to prevention and control. A surveillance system includes a functional
capacity for data collection, analysis, and dissemination linked to public health
programs"[1].
Since 1990, the Agency for Toxic Substances and Disease Registry (ATSDR) has
maintained a n active, state-based Hazardous Substances Emergency Events Surveillance
(HSEES) system to describe the public health consequences of the release of
hazardous substances. The decision to initiate a surveillance system of this
type was based on a study published in 1989 about the reporting of hazardous
substances releases to three national databases: the National Response Center
Database, the Hazardous Material Information System (HMIS), and the Acute Hazardous
Events Database [2]. A review of these databases indicated limitations. Many
events were missed because of incomplete reporting (for example, the HMIS did
not record events involving intrastate carriers or fixed facility events). Other
important information was not recorded, such as the demographic characteristics
of victims, the types of injuries sustained, and the number of persons evacuated.
As a result of this review, ATSDR implemented the HSEES system to more fully
describe the public health consequences of the release of hazardous substances.
HSEES has four goals:
For a surveillance system to be useful, it must not only be a repository for data,
but also useful to protect public health.
In the last few years, ATSDR has emphasized the fourth goal of the HSEES system; i.e.,
to develop strategies to reduce subsequent morbidity and mortality by having each participating
state analyze its data and develop appropriate prevention outreach activities. These activities
are intended to provide industry, responders, and the general public with information that can help
prevent chemical releases and reduce morbidity and mortality if a release occurs. Methods
This report provides an overview of HSEES for
2002, summarizes the characteristics of acute releases
of hazardous substances and their associated public health consequences, and demonstrates how data
from the system are translated into prevention activities to protect public health.

In 2002, 15 state health departments (Alabama, Colorado, Iowa,
Louisiana, Minnesota, Mississippi, Missouri, New York, New Jersey, North Carolina,
Oregon, Texas, Utah, Washington, and Wisconsin) collected data for HSEES. Beginning
in 2002, a newly updated data-collection form, approved by the Office of Management
and Budget, went into effect. For each event, information was collected about
the event, substance(s) released, victims, injuries, and evacuations.
Various data sources were used to obtain information about these events. These
sources included, but were not limited to, records and oral reports of state
environmental agencies, police and fire departments, the U.S.
Department of transportation, the National Response Center, hospitals and the
media. Census data were used to estimate the number of residents in the vicinity
of the events. All data were computerized using Web-based data entry system
provided by ATSDR.
Click to enlarge view

HSEES defines hazardous substances emergency events as uncontrolled
or illegal releases or threatened releases of hazardous substances. Events involving
petroleum and no other hazardous substances are not included. Events are included if
(1) the amount of substance released (or that might have been released) needed
(or would have needed) to be removed, cleaned up, or neutralized according to federal,
state, or local law; or (2) release of a substance as threatened, but the threat led
to an action (for example, evacuation) that could have affected the health
of employees, emergency responders, or members of the general public. HSEES defines
victims as people who suffer at least one adverse health effect within 24 hours or
who die as a consequence of the event. Victims who receive more than one type of injury
are counted once in each applicable injury type. Events are defined as transportation-related
if they occur during surface, air, pipeline, or water transport of hazardous substances,
or before being unloaded from a vehicle or vessel. All other events are considered Results
For the data analyses in this report, the substances released were
categorized into 16 groups. The category "mixture" comprises substances from different
categories that were mixed before the event, and the category "other inorganic substances"
comprises all inorganic substances, except acids, bases, ammonia, and chlorine.
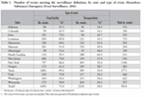
For 2002, 9014 hazardous substances emergency events were reported to HSEES: 198 (2.2%) of these events were threatened releases. A total of 6493 (72.0%) occurred in fixed facilities. Two states, Texas and New York reported 43% of all releases (Table 1). For each fixed-facility event, states can select one or two types of area involved in the release. Of all 6493 fixed-facility events, 5557 (85.6%) had one type of area reported; 893 (13.7%), a combination of two area types; and 43 (0.7%), no type of area reported.
Table 1
Among events with one type of area reported, the main areas were
classifi ed as follows: 1761 (31.7%) ancillary processing equipment, 895 (16.1%)
process vessel (a reaction chamber in which chemicals are processed), 559 (10.1%)
storage areas above ground (i.e., tank, storage shed, and warehouse), and 491
(8.8%) piping. Of the 893 events with two areas, 479 (53.6%) involved ancillary
processing equipments in combination with other types of area (Figure 1). Of the 2520
transportation-related events, 2155 (85.5%) occurred during ground transport (e.g.,
truck, van, or tractor), and 241 (9.6%) involved transport by rail (Figure 2). Fewer
events involved water, air, and pipeline transportation modes. The largest proportion
of transportation-related events occurred during loading or unloading of a stationary
vehicle or vessel (45.3%) and from a moving vehicle or vessel (32.7%).
Factors contributing to the events consisted of primary and secondary entries and
were reported for 8965 (99.5%) events (Figure 3). Of reported factors, more than half,
(3420, 52.9%), of fixed-facility events and 751 (29.9%) of transportation-related events
involved equipment failure as the primary factor; 1266 (19.6%) of fixed-facility and 1593
(63.5%) of transportation related events involved human error as the primary factor.
Click to enlarge view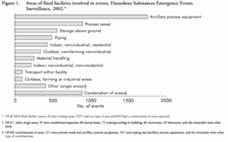
|
| Figure 1 |
Click to enlarge view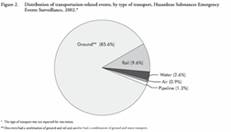
|
| Figure 2 |
Click to enlarge view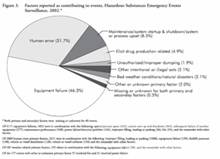
|
| Figure 3 |
For events which did not involve human error or equipment
failure where the secondary factor was associated with unauthorized/improper
dumping; maintenance, system startup and shutdown, and system or process upset;
and other intentional or illegal acts and for events with a secondary factor
associated with illicit drug production, both primary and secondary factors
were combined to make separate categories.
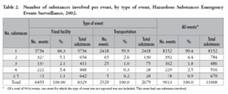
More than 90% of all events involved the release of only one substance. Two
substances were released in 392 (4.4%) events, and approximately 5% involved
the release of more than two substances (Table 2). Fixed
facility events were more likely than transportation events to have two or more
substances involved in an event (11.7% vs. 4.0%).
A total of 11,009 substances were either released or threatened to be released
during the 9014 events. States could report two types of release for each chemical
(e.g., spill and air). Of a total of 10,953 substances having type of release
reported, only one release was reported for the following: air releases (5324,
48.6%), spills (4201, 38.3%), fires 376, 3.4%), and explosions (66, 0.6%). Two
types of release most commonly reported together were spill and air releases
(398, 3.6%), fires and explosions (45, 0.4%) spill and fire (43, 0.4%) and air
release and fire (42, 0.4%); the remainder involved other combinations of release
types, or unknown release types.
Click to enlarge view
The number of events by month ranged from 611 (6.8%) in December to 881 (9.8%)
in June, with the largest proportions occurring from April to July, the peak
agricultural season. The proportion of events ranged from 15.8% to 17.3% during
week days, and from 8.0% to 9.3% during weekend days. Of all 8815 (97.8%) events
for which time of day or time category was reported, 34.5% occurred from 6:00
a.m. to 11:59 a.m., 32.3% from 12:00 p.m. to 5:59 p.m., 18.1% from 6:00 p.m.
to 11:59 p.m., and the remainder during the early hours of the day.
Table 2
Industries
Click to enlarge view 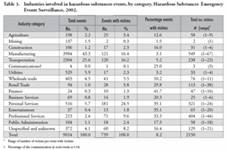
The largest proportions of HSEES events were associated with the manufacturing
(43.3%) and the transportation (25.6%) industries (Table 3).
However, the largest proportion of events with injuries occurred in the personal
services industry (24.5%), mostly in private households and in hotels and motels.
The number of victims in the personal services industry was third highest (321,
14.9%) following the number of victims in the manufacturing industry (549, 25.5%)
and the professional services industry (404, 18.8%). Most of the private household
events were associated with illicit production of methamphetamine. Among the
events in professional services, educational services constituted the largest
proportion (48.4%) and had the largest number of victims (240).
Table 3
Substances
A total of 11,009 substances were involved in all events, of which 436 (4.0%) were reported as threatened releases. The substances most frequently released were ammonia, sulfur dioxide, nitrogen oxide and carbon monoxide (Appendix A). These substances were grouped into 16 categories. The categories most commonly involved in fixed-facility events were other inorganic substances (1983, 23.8%), mixtures (1525, 18.3%), and volatile organic compounds (VOCs) (1388, 16.7%). In transportation-related events, the most common releases were VOCs (457, 17.2%), acids (391, 14.7%), and pesticides and other agricultural chemicals (305, 11.4%) (Table 4). Victims
A total of 2150 victims were involved in 739 events (8.2% of all events) (Table 5). Of the 739 events with victims, 436 (59.0%) events involved only one victim, and 130 (17.6%) involved two victims. Of all victims, 1712 (79.7%) were injured in fixed-facility events. Fixed- facility events were more likely to have more than one victim per event (43.3%) than were transportation events (34.2%).
To represent the magnitude of the effects of substances involved on injuries,
the number of events in a specific substance category was compared with the number
of events in the same category that had victims. Substances in events that involved
one or more substances from the same substance category were counted once in that
category. Substances in events that involved two or more substances from different
categories were counted once in the multiple-substance categories. Substances
released most often were not necessarily the most likely to result in victims
(Table 6).
Click to enlarge view 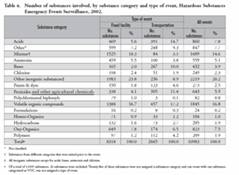
|
| Table 4 |
Click to enlarge view 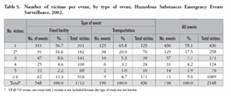 |
| Table 5 |
Click to enlarge view 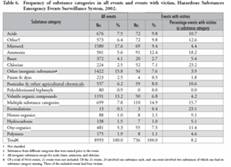
|
| Table 6 |
For example, events involving the substance category “other inorganic substances” constituted 15.8% of all events. However, only 3.9% of these events resulted in injuries. Conversely, events involving chlorine or ammonia exclusively comprised 2.5% and 5.6% of all events respectively, but 23.2% of these chlorine events and 18.2% of ammonia events resulted in injuries. Events involving substances from multiple categories also had a relatively large proportion of events with victims (15.7%). Employees (1008, 46.9%) constituted the largest proportion of the population groups injured, followed by members of the general public (652, 30.3%), responders (274, 12.7%), and students (211, 9.8%) (Figure 4). Two hundred eleven emergency response personnel were injured in fixed-facility events. Of those, 117 (55.4%) were police officers, 37 (17.5%) were career firefighters, and 28 (13.3%) were volunteer firefighters (Figure 5a). Sixty-three emergency responder victims were injured in transportation-related events. Of these, most (46) were police officers (Figure 5b). Police officers were more frequently victims in transportation-related events (73.0%) than in fixed facility-events (55.4%).
Victims were reported to sustain a total of 3288 injuries (Table
7). Some victims had more than one injury. Of all reported injuries, the
most common injuries in fixed-facility events were respiratory symptoms (876,
32.2%), eye irritation (342, 12.6%), dizziness or other central nervous system
symptoms (339, 12.5%), headache (323, 11.9%), gastrointestinal symptoms (272,
10.0%) and burns (213, 7.8%). In transportation-related events, respiratory
symptoms (205, 36.3%), trauma (104, 18.4%), eye irritation (88, 15.6%) and burns
(36, 6.4%) were reported most frequently. In a large proportion of the instances,
trauma might have resulted from a chain of events, such as a motor vehicle accident,
leading to the release of a hazardous substance, and not necessarily by the
exposure to the substance itself.
Sex was known for 1705 (79.3%) of the victims; of these 1117 (65.5%) were males.
Males constituted 75.2% of all employees and responders for whom sex was reported.
The median age of the 1001 (46.6%) victims for whom age was reported was 31
years (range: 0–83, where 0 includes victims 1 year old). Of these, 23 were
children aged 10 years, and 182 were children aged 10–18 years. For the 1149
(53.4%) injured persons for whom the age was not reported, 738 (64.2%) were
presumably adults (first responders and employees), 77 (6.7%) were students,
and 334 (29.1%) could have been adults or children (members of the general public
or the category of victims was not known). The largest proportion of victims
(1157, 54.3%) were transported and treated at a hospital but not admitted; 185
(8.7%) were admitted, and 47 (2.2%) died (Figure 6).
Click to enlarge view 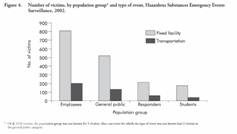 |
Click to enlarge view 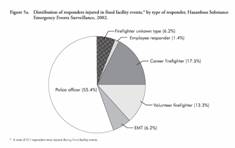
|
| Figure 4 | Figure 5a |
Click to enlarge view 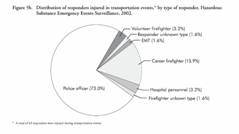
|
Click to enlarge view 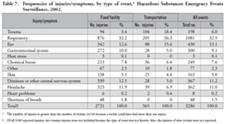
|
| Figure 5b | Table 7 |
The status of personal protective equipment (PPE) use was reported
for 903 (89.6%) employees and for 241 (88.0%) first-responder victims. Most
of these employees (88.7%) and 39.8% of first responders had not worn any form
of PPE. Employees who wore PPE, most often used gloves and eye protection (50,
49.0%). Among first responders who wore PPE, 34 (23.4%) wore firefighter turn-out
gear with respiratory protection; 32 (22.1%) wore firefighter turn-out gear
only; and 61 (42.1%) wore gloves. Two events involved more than 50 injured people
per event. The first resulted from a chlorine spill caused by an equipment failure
in an industrial and chemical facility. This event affected 67 people, of whom
61 were members of the general public and six were employees. All victims exhibited
respiratory symptoms and were transported to a hospital for treatment; two were
admitted. The second event occurred in a paper and pulp products facility and
resulted from air emission of carbon monoxide where the ventilation system failed
to work properly due to human error. This event affected 54 employees. All but
one suffered headache and dizziness; one also had respiratory symptoms; and
one had skin irritation and dizziness. Four of the employees received first
aid at the scene, and the other 50 were transported to a hospital for treatment
but were not admitted.
Note: Firefighter turn-out gear is protective clothing
normally worn by firefighters during structural fire-fighting operations and is similar to level "D"
protection. Level "D" as defined by the Occupational Safety and Health Administration is coveralls,
boots/shoes (leather of chemical resistant, steel toe and shank), safety glasses or chemical
splash goggles, and hard hat. Level "D" provides limited protection against chemical hazards.
Evacuations
Response Uses of the HSEES Data
Evacuations were ordered in 545 (6.3%) of 8607 events where evacuation status was reported.
Of these evacuations, 68.6% were of a building or the affected part of a building; 16.3%
were of a defined circular area surrounding the event locations; and the remainder were
of a downwind or downstream area, a circular and downwind or downstream area, of no criteria,
or not known. The number of people evacuated was known for 424 events and ranged from
1 to 3000 people, with a median of 23. However, 65 ordered evacuations were reported
having no evacuees. The median length of evacuation was 2 hours. In 95% of events for
which evacuation was ordered, access to the area was restricted. Seventy-nine events had
in-place sheltering ordered by an official.

During 2002, ATSDR continued to respond to requests for HSEES
information from local, state, and federal agencies and organizations. ATSDR
also continued to respond to requests from researchers for copies of the HSEES
protocol, data collection form, data, and publications. HSEES data have been
used for presentations in national and state conferences and for articles published
in peer-reviewed journals (Appendix B). An important contribution of the data
is the ability of each participating state to target prevention activities pertaining
to issues related to acute spills in their state. These include school personnel,
industry and labor groups, first responders, hospital personnel, and producers
or users of potentially dangerous substances. HSEES coordinators, often in collaboration
with other local and state agencies, conduct the activities. These activities
are also being evaluated for effectiveness. The HSEES Internet website page
is available at http://www.atsdr.cdc.gov/HS/HSEES/
. At this site, HSEES annual reports and other information can be downloaded.
Internet links to other relevant websites and a public-use dataset will be available
on the HSEES website in the future. Prevention Activities
Current HSEES-related activities include collaboration with the Federal Emergency
Management Agency, U.S. Chemical Safety and Hazard Investigation Board, U.S.
Environmental Protection Agency, and other agencies and organizations involved
with response to chemical terrorism, emergency response, hazardous substances
releases, and public health. Ten years of HSEES data are now available for trend
analysis, and several publication are in development or being submitted to peer-reviewed
journals.
During 2002 participating state coordinators performed various prevention activities. These activities included:
Acute Release of Hazardous
Substances in Schools During 2002

During 2002 13 participating states reported a total of 102 school events.
Of these, 63 (61.8%) occurred in elementary and secondary schools; 36 (35.3%), in colleges
and universities; and three (2.9%), in vocational schools. Thirty-six (35.3%) of these events
resulted in injuries. School events were proportionally over four times as likely to have
resulted in injuries and over six times as likely to have an evacuation ordered as were all
other events reported to the system during that period. Of all events with evacuees, a total
of 5935 people were offi cially evacuated (range: 6–1500; median: 60 people). Summary of Results,
Of all 240 injured persons, students made up the highest proportion (184, 76.7%) followed by
employees (50, 20.8%). The majority of victims were transported to a hospital (147, 61.2%)
or treated by first aid at the scene (83, 34.6%). Only three victims were admitted to the
hospital. Most victims sustained one or more symptoms, including eye irritation (n=117), respiratory
symptoms (n=90), dizziness or other CNS symptoms (n=73), gastrointestinal symptoms (n=44), skin
irritation (n=25), and burns (n=21). The most common cause of events was human error, followed
in frequency by equipment failure and intentional or illegal acts. The substances most
frequently involved in the events were mercury (19, 16.7%), hydrochloric acid (9, 7.9%),
and ethylene glycol (5, 4.4%).
A case vignette illustrates the type of releases that occur at schools. A middle school
student dumped mercury in the hallway of an elementary school. As a result, 543 students
and staff were evacuated and decontaminated. One student rubbed his eyes with the mercury
and was taken to hospital for further decontamination and evaluation. The event lasted for
6 hours.
Yearly analysis of HSEES data shows that, since 1994, mercury remains the most frequently
released substance in schools. Although most of these events do not involve injuries, the
cost of cleanup, time missed from school, and relocation can be substantial.
1993 - 2002
During 1993–2002, the largest proportion of events occurred in
fixed facilities (Table 8). However, the number of reported transportation-related
events is increasing. The increase is partially due to the utilization of
the U.S. Department of Transportation’s Hazardous Materials Information System
as a primary notification source for transportation events. In addition, the total
number of events continued to increase over time, partially because of the addition
of new states to the surveillance system (Figure 7). However, the increase also
occurred among states that have participated in the system since 1993. The increase
in the number of events in these states may have been due, at least in part, to the
expansion of reporting sources. In events involving victims, respiratory symptoms
consistently have been most frequently reported. The number of deaths associated with
events continues to suggest the need to evaluate, not only the danger posed by
exposure to hazardous substances, but also the circumstances surrounding the events
(e.g., a crash resulting from high-speed travel of a truck pulling an ammonia tank).
Employees continue to be the most commonly reported victims of emergency events.
However, members of the general public, responders, and students constitute a
large proportion as well (Figure 8) .
The findings from the HSEES data analyses regarding the proportions of the number
of events with victims and events with evacuations and the distributions of the
numbers and types of injuries reported have been consistent over time.
Click to enlarge view 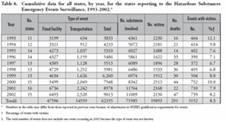
|
| Table 8 |
Click to enlarge view 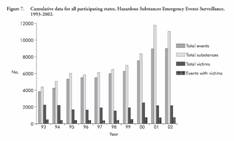 |
| Figure 7 |
Click to enlarge view 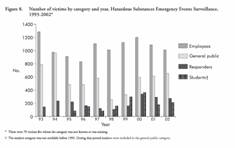 |
| Figure 8 |
References
Appendices
Appendix A ---- The hundred most frequent substances involved in events, Hazardous Substances Emergency Events Surveillance, 2002.
Click to enlarge
view 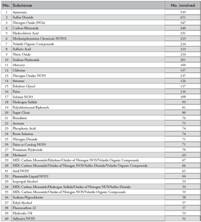
|
Click to enlarge
view 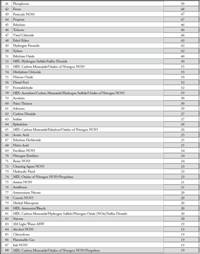
|
Click to enlarge
view 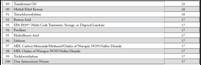
|
Appendix B — Hazardous Substances
Emergency Events Surveillance-Related Publications.
| Agency for Toxic Substances and Disease Registry. Hazardous Substances Emergency Events Surveillance annual report, 1993. Atlanta: US Department of Health and Human Services; 1994. | Hall HI, Haugh GS, Price-Green PA, Dhara VR, Kaye WE. Risk factors for hazardous substance releases that result in injuries and evacuations: data from 9 states. Am J Public Health 1996;86:855-7. |
| Agency for Toxic Substances and Disease Registry. ATSDR update: Hazardous Substances Emergency Events Surveillance (HSEES) system: 1993 data. Health and Environment Digest 1995;8:83-4. | Horton DK, Berkowitz Z, Kaye WE. Surveillance of Hazardous Materials Events in 17 States, 1993-2001: A Report from the Hazardous Substances Emergency Events Surveillance (HSEES) System. Am J Ind Med 2004;45:538-548. |
| Agency for Toxic Substances and Disease Registry. Hazardous Substances Emergency Events Surveillance annual report, 1994. Atlanta: US Department of Health and Human Services; 1995. | Horton DK, Berkowitz Z, Kaye WE. Hydrofl uoric acid releases in 17 states and the acute health effects associated, 1993-2001. J Occup Environ Med 2004;46:501-508. |
| Agency for Toxic Substances and Disease Registry. Hazardous Substances Emergency Events Surveillance System: information for local emergency planning committees and first responders. Atlanta: US Department of Health and Human Services; 1995. | Horton DK, Drew J, Nehls-Lowe H, Otto W, Kaye WE. Public health dispatch: acute tearing agent toxicity after exposure to a theft-deterrent device on a safe—Wisconsin, December 2003. MMWR 2004;53: 176-7. |
| Agency for Toxic Substances and Disease Registry. Hazardous Substances Emergency Events Surveillance annual report, 1995. Atlanta: US Department of Health and Human Services; 1996. | Horton DK, Ernst K, Kaye WE. Homemade chemical bomb events and resulting injuries—selected states, January 1996–March 2003. MMWR 2003;52:662-4. |
| Agency for Toxic Substances and Disease Registry. Hazardous Substances Emergency Events Surveillance annual report, 1996. Atlanta: US Department of Health and Human Services; 1997. | Horton DK, Berkowitz Z, Kaye WE. The acute consequences to children exposed to hazardous substances used in illicit methamphetamine production, 1996 to 2001. J Child Health 2003;1:99-108. |
| Agency for Toxic Substances and Disease Registry. Hazardous Substances Emergency Events Surveillance annual report, 1997. Atlanta: US Department of Health and Human Services; 1998. | Horton DK, Berkowitz Z, Kaye WE. Secondary contamination of ED personnel from hazardous materials events, 1995-2001. Am J Emerg Med 2003;21:199-204. |
| Agency for Toxic Substances and Disease Registry. Hazardous Substances Emergency Events Surveillance annual report, 1998. Atlanta: US Department of Health and Human Services; 199 | Horton DK, Berkowitz Z, Haugh GS, Orr MF, Kaye WE. Acute public health consequences associated with hazardous substances released during transit, 1993– 2000. J Hazard Mater 2003;B98:161-75. |
| Agency for Toxic Substances and Disease Registry. Hazardous Substances Emergency Events Surveillance five-year cumulative report 1993-1997. Atlanta: US Department of Health and Human Services; 2001. | Horton DK, Berkowitz Z, Kaye WE. The public health consequences from acute chlorine releases, 1993-2000. J Occup Environ Med 2002;44:906-13. |
| Agency for Toxic Substances and Disease Registry. Hazardous Substances Emergency Events Surveillance biennial report, 1999-2000. Atlanta: US Department of Health and Human Services; 2002. | Horton DK, Haugh GS, Kaye WE. Public health consequences among first responders to emergency events associated with illicit methamphetamine laboratories—selected states, 1996–1999. MMWR 2000;49:1021-4. |
| Agency for Toxic Substances and Disease Registry. Hazardous Substances Emergency Events Surveillance annual report, 2001. Atlanta: US Department of Health and Human Services; 2003. | Manassaram DM, Orr MF, Kaye WE. Counterterrorism planning using the hazardous substances events surveillance system. Disaster Management and Response 2003;1:35-40. |
| Berkowitz Z, Haugh GS, Orr, MF, Kaye WE. Releases of hazardous substances in schools: data from Hazardous Substances Emergency Events Surveillance System, 1993-1998. J Environ Health 2002;65:20-27 | Manassaram DM, Orr MF, Kaye WE. Hazardous substances events associated with the manufacturing of chemicals and allied products. J Hazardous Mater 2003;104:123-35. |
| Berkowitz Z, Orr MF, Kaye WE, Haugh GS. Adverse public health effects associated with releases of hazardous substances in the agricultural industry and related services in four mid-Western states. J Occup Environ Med 2002;44:714-723. | Orr MF, Kaye WE, Zeitz P, Powers ME, Rosenthal L. Public health risks of railroad hazardous substance emergency events. J Occup Environ Med 2001;43: 94-100. |
| Berkowitz Z, Barnhart HX, Kaye WE. Factors associated with severity of injury resulting from acute releases of hazardous substances in the manufacturing industry. J Occup Environ Med 2003;45:734-42. | Orr MF, Kaye WE, Zeitz P, Powers ME, Rosenthal L. Public health risks of railroad hazardous substance emergency events [letter]. J Occup Environ Med 2001;43:738-40. |
| Burgess JL, Kovalchick DF, Harter L, Kyes KB, Thompson JN. Hazardous materials events: an industrial comparison. J Occup Environ Med 2000;42: 546-53. | Orr MF, Haugh GS, Kaye WE. Hazardous Substances Emergency Events Surveillance, 1993 to 1997. Chemical Health and Safety 2001; [Jan/Feb]:35-41. |
| Burgess JL, Kovalchick DF, Harter L, Kyes KB, Lymp JF, Brodkin CA. Hazardous materials events: evaluation of transport to health care facility and evacuation decisions. Am J Emerg Med 2001;19:99-105. | Souther L, Small-Johnson J, Messing RB. A description of agricultural releases of anhydrous ammonia in Minnesota. Chemical Health and Safety. 2000 [Nov/ Dec]: 16-22. |
| Centers for Disease Control and Prevention. Public health consequences among first responders to emergency events associated with illicit methamphetamine laboratories—selected states, 1996-1999. MMWR 2000;49:1021-4. | Weisskopf MG, Drew JM, Hanrahan LP, Anderson HA. Hazardous ammonia releases in Wisconsin: trends and risk factors for evacuation and injury. Wisconsin Medical Journal. 2000 November:30-46. |
| Centers for Disease Control and Prevention. Homemade chemical bomb events and resulting injuries—selected states, January 1996-March 2003. MMWR 2003;52:662-4. | Welles WL, Wilburn RE. Hazardous Substances Emergency Events Surveillance (HSEES) in New York State, 1993 to 1997. Chemical Health and Safety 2001; [January/February]:42-52. |
| Hall HI, Dhara VR, Price-Green PA, Kaye WE. Surveillance for emergency events involving hazardous substances—United States, 1990-1992. MMWR 1994;43(No. SS-2):1-6. | Wendt RD, Hall HI, Price-Green PA, Dhara VR, Kaye WE. Evaluating the sensitivity of hazardous substances emergency events surveillance: a comparison of three surveillance systems. J Environ Health 1996;58:13-7. |
| Hall HI, Dhara VR, Kaye WE, Price-Green PA. Surveillance of hazardous substance releases and related health effects. Arch Environ Health 1994;49:45-8. | Zeitz P, Berkowitz Z, Orr MF, Haugh GS, Kaye WE. Frequency and type of injuries in responders of hazardous substances emergency events, 1996 to 1998. J Occup Environ Med 2000;42:1115-20. |
| Hall HI, Price-Green PA, Dhara VR, Kaye WE. Health effects related to releases of hazardous substances on the Superfund priority list. Chemosphere 1995;31: 2455-61. | Zeitz P, Orr MF, Kaye WE. Public health consequences of mercury spills: Hazardous Substances Emergency Events Surveillance System: 1993-1998. Environ Health Perspect 2002;110:129-32. |
| Hall HI, Dhara VR, Kaye WE, Price-Green PA. Public health consequences of hazardous substance releases. Toxicol Ind Health 1996;12:289-93. |
Other Reports Available
1995 Annual Report [![]() ]
]
1996 Annual Report [HTML] [![]() ]
]
1997 Annual Report [HTML] [
![]() ]
]
1998 Annual Report [HTML] [![]() ]
]
1999-2000 Biennial Report [HTML]
[![]() ]
]
2001 Annual Report [HTML] [![]() ]
]
2002 Annual Report [ HTML] [![]() ]
]
2003 Annual Report [HTML] [ ![]() ]
]
2004 Annual Report [HTML] [ ![]() ]
]
1993 through 1997 Annual Report [HTML] [![]() ]
]
1998 through 2001 Annual Report [HTML ] [![]() ]
]
Agency for Toxic Substances and Disease Registry, 4770 Buford Hwy NE, Atlanta, GA 30341
Tel: (404) 498-0110 / Public Inquiries: (888) 422-8737