Historical Document
This document is provided by the Agency for Toxic Substances and Disease Registry (ATSDR) ONLY as an historical reference for the public health community. It is no longer being maintained and the data it contains may no longer be current and/or accurate.
Biennial Report 2007-2008
U.S. DEPARTMENT OF HEALTH AND HUMAN SERVICES Agency for Toxic Substances and Disease Registry
Division of Health Studies Surveillance and Registries Branch Atlanta, Georgia
|
In 1980, Congress created the Agency for Toxic Substances and Disease Registry (ATSDR) to implement health-related sections of laws that protect the public from hazardous wastes and environmental spills of hazardous substances. The Comprehensive Environmental Response, Compensation, and Liability Act of 1980 (CERCLA), commonly known as the Superfund Act, designated ATSDR as the lead agency within the U.S. Public Health Service to help prevent or reduce further exposure to hazardous substances and the adverse health effects that might result from such exposures, and to expand the knowledge base about such effects. In accordance with this legislative mandate, this publication reports results and findings of health studies, registries, or other health-related activities supported by ATSDR Comments regarding this report are welcome. Please send your comments to the following address: Agency for Toxic Substances and Disease Registry Attn: Director, Division of Health Studies (F-57) 4770 Buford Highway, NE Atlanta, Georgia 30341
Centers for Disease Control and Prevention Thomas Frieden, MD, MPH, Director
Agency for Toxic Substances and Disease Registry
Henry Falk, MD, MPH, Acting Director
Division of Health Studies
G. David Williamson, PhD, Director
Caroline McDonald, Deputy Director
Anne Sowell, PhD, Assistant Director for Science
SurveillanceRegistries Branch
Hazardous Substances Emergency Events Surveillance
Staff
Ayana R Anderson, MPH
Mary Anne Duncan, DVM, MPH
Nelda Godfrey
Natalia Melnikova, MD, PhD
Maureen Orr,
MS Perri Zeitz Ruckart, MPH
Sue L Sloop, PhD
Angela Walker
Jennifer Wu, MStat
DISCLAIMER The findings and conclusions in this report are those of
the authors and do not necessarily represent the views of the Agency for Toxic
Substances and Disease Registry. Contents Executive SummaryHSEES Pilots in India and Poland Prevention/Outreach Activities The Future of Hazardous Substance Surveillance List of Figures and TablesFigure 1. Participating States Figure 2. Areas of Fixed Facilities Involved in Events Figure 3a. Primary Factors Reported as Contributing to Events Figure 3b. Secondary Factors Reported as Contributing to Events Figure 4. Number of Victims, by Population Group and Type of Event Figure 5a. Distribution of Responders Injured in Fixed Facility Events Figure 5b. Distribution of Responders Injured in Transportation Events Figure 7. Number of Victims, by Category and Year Table 1a. Number Incidents, by State and Type of Event Table 1b. Number of Incidents, by State and Type of Event Table 2. Industries Involved in Hazardous Substances Events, by Category Table 3. Number of Substances Involved Per Event, by Type of Event Table 4. Number of Substances Involved by Substance, Category, and Type of Event Table 5. Number of Victims per Event, by Type of Event Table 6. Frequency of Substance Categories in All Events and Events with Victims Table 7. Frequency of Injuries/Symptoms, by Type of Event Table 8. Distribution of Responder Categories Table 9. Years of Participation, by State, 1993–2008 Executive SummaryOverviewThe Agency for Toxic Substances and Disease Registry (ATSDR) maintained the Hazardous Substances Emergency Events Surveillance (HSEES) system from 1990-2009. HSEES called on state health departments to collect information on the public health consequences of acute hazardous substance incidents. Collected data facilitate national, state, and local preparedness for prevention of, and response to, hazardous substance threats. This report summarizes the 15,506 events reported during the years 2007 and 2008 and the major activities performed by the state programs. Substances
Pilot Projects in India and PolandIn 2004, the State of Gujarat, India and Poland implemented pilot HSEES data collection. Data collection ended during 2007 due to funding constraints.
IntroductionBackgroundThe Centers for Disease Control and Prevention (CDC) defines surveillance as the “. . . ongoing, systematic collection, analysis, and interpretation of health data essential to the planning, implementation, and evaluation of public health practice, closely integrated with the timely dissemination of these data to those who need to know. The final link of the surveillance chain is the application of these data to prevention and control. A surveillance system includes a functional capacity for data collection, analysis, and dissemination that is linked to public health programs.”[1] From 1990 through September 2009, the Agency for Toxic Substances and Disease Registry (ATSDR) maintained an active, state-based Hazardous Substances Emergency Events Surveillance (HSEES) system to determine the public health consequences of hazardous substance releases. The decision to initiate a surveillance system of this type was based on a 1989 study regarding hazardous substances release reporting to three national databases: the National Response Center Database, the Hazardous Material Information System (HMIS), and the Acute Hazardous Events Database. [2] The study revealed database limitations, among which were specific reporting requirements that excluded many events, (for example, the HMIS, did not record events involving intrastate carriers or fixed facilities). Other important information was not recorded, such as the demographic characteristics of victims, the types of injuries sustained, and the number of persons evacuated. As a result of this review, ATSDR implemented the HSEES system to describe more fully the public health consequences of hazardous substances releases and to support informed prevention activities. The HSEES goals were to
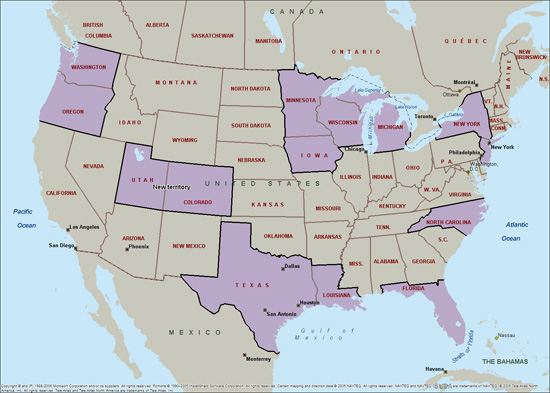
A useful surveillance system is more than a data repository; the data must be employed to protect public health. Each participating state used collected data to promote public health by developing appropriate prevention outreach activities and developing ways to measure their effectiveness. PurposeThis report provides an overview of HSEES activities in the participating states in the period 2007-2008. It summarizes the characteristics of acute releases of hazardous substances and associated public health consequences. It demonstrates how system data are translated into prevention activities to protect public health. MethodsDescriptionIn 2007–2008, 14 state health departments participated in HSEES: Colorado, Florida, Iowa, Louisiana, Michigan, Minnesota, North Carolina, New Jersey, New York, Oregon, Texas, Utah, Washington, and Wisconsin (Figure 1). Information was collected about each event, including substance(s) released, victims, injuries (adverse health effects and symptoms), and evacuations. Because New Jersey was unable to collect complete data in 2008, this report excludes New Jersey 2008 data. Figure 1. Participating StatesSource: Hazardous Substances Emergency Events Surveillance, 2007–2008
Analysis of the number of employees in key industries showed the 14 states that participated in HSEES from 2007-2008 were representative of all 50 states.[3] Several industries were over-represented. For example, because of the large number of oil and gas facilities in Texas, HSEES over-represents the oil and gas industry. A demographic comparison was made of HSEES states and the United States by
Based on these six demographic factors the populations of the 14 HSEES states were generally representative of the entire United States, although Hispanics are over-represented by about 12%, and Native Americans are under-represented by about 30%.[3] Data SourcesEvent information came from various data sources, including records and oral reports of state Environmental Protection Agencies, the U.S. Department of Transportation, the National Response Center, police and fire departments, and hospitals. U.S. Census Bureau data were used to estimate the number of residents in the vicinity of events. Using an approved data collection form, all data were entered into a Web-based data entry system provided by ATSDR. DefinitionsA hazardous substances emergency event is an acute, uncontrolled, or illegal release or threatened release of hazardous substances. An acute, uncontrolled or illegal release is defined as coming out of container and going into the environment, it could occur through food, water, air, or soil. A contained release, i.e. one on one type poisoning is not included. Threatened releases are imminent releases that did not occur but did lead to a public health action (e.g., evacuation) that could potentially impact the health of employees, emergency responders, or members of the general public.
Transportation-related events occur during surface, air, pipeline, or water transport of hazardous substances and before the substance is totally unloaded from a vehicle or vessel. All other events are considered fixed-facility events. HSEES defines victims as persons who experience at least one documented adverse health effect within 24 hours after an event or who die as a consequence of an event. Victims may have more than one injury type or symptom. Reporting ChangesBeginning in 2006, to improve reporting uniformity among states and to reduce investigation of incidents resulting in minimal public health impact, ATSDR changed the inclusion/exclusion criteria for HSEES. Minimum Quantity Before 2006, the reporting guidelines called for a report of any release in an amount for which federal, state, or local law required clean up. In 2006, that requirement was changed to require a report of any release in which the amount of substance released—or that might have been released—was greater than 10 pounds/1 gallon, or release of any amount of a substance on the HSEES mandatory reporting list, regardless of the released amount. This had the effect of increasing some types of incidents and decreasing others. Exclusions Also in 2006, reports of smoke stack emissions above permitted values of carbon monoxide (CO), sulfur oxides (SOX), and/or nitrogen oxides (NOX) were removed, since these have rarely resulted in acute public health impact. As specified in the Comprehensive Environmental Response, Compensation, and Liability Act (CERCLA or “Superfund”) authorizing legislation, petroleum-only releases (e.g., crude oil, gasoline), have always been excluded. ResultsEventsFor 2007, a total of 7,947 acute hazardous substances events met criteria for HSEES inclusion. During 2008, 7,559 events met the criteria. This is an average of 568 per state for 2007 and 581 for 2008. In 2006, the average was 560. For 2005 it was 575, and in 2004 it was 600. Changes in reporting criteria and in participating states make comparisons difficult. During 2007, 5,441 events occurred in fixed facilities and 2,506 events occurred during transportation. Three states, Texas, New York and Louisiana, accounted for 50.0% of all events (Table 1a). Table 1a.Number Incidents, by State and Type of EventSource: Hazardous Substances Emergency Events Surveillance, 2007
* = (number of events by type of event per state/total number of events in that state) X 100 During 2008, 5,224 events occurred in fixed facilities and 2,335 occurred during transportation. Three states, Texas, New York and Louisiana, accounted for 52.4% of all events (Table 1b). Table 1b. Number of Incidents, by State and Type of EventSource: Hazardous Substances Emergency Events Surveillance, 2008
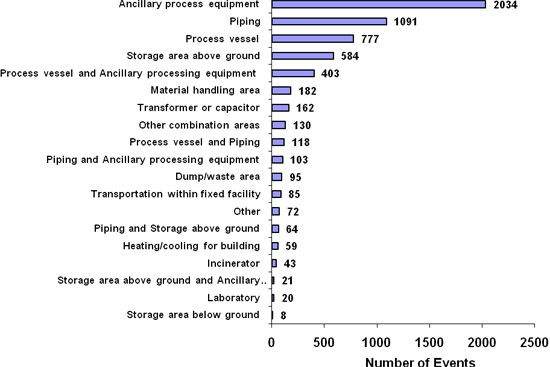
* = (number of events by type of event per state/total number of events in that state) X 100 Fixed Facility EventsFor each fixed-facility event in the North American Industry Classification System (NAICS) (industry categories: 21 Mining, 22 Utilities, 23 Construction, and 31-33 Manufacturing), reporters could select one or two areas (specific location at the fixed facility where the event occurred) or types of equipment involved. Of 6,157 fixed-facility events in these categories, 5,212 (84.7%) reported only one area and 839 (13.6%) reported a combination of two areas. For 106 (1.7%) events, area was not reported. The main areas of fixed facility events that occurred were classified as ancillary processing equipment, piping, process vessel, storage above ground, and ancillary process equipment along with a process vessel (Figure 2). Figure 2. Areas of Fixed Facilities Involved in Events
Transportation Events Of 4,841 reported transportation-related events, 86.9% occurred during ground transport (e.g., truck, van, or tractor), and 8.4% involved transport by rail. Fewer events involved water (2.1%), pipeline (1.0%), air (1.6%), or multiple transportation modes (0.1%). Most transportation-related events involved en route releases discovered later after arriving at a fixed facility (1,625) or during vehicle/vessel unloading (1,331). Fewer (1,259) involved releases from a moving vehicle or vessel or from a stationary vehicle or vessel (571). For 38 incidents, the transportation phase of the release was not reported. Timing of Events The number of events per month ranged from 999 (6.4%) in December to 1,505 (9.7%) in August. The highest number of events occurred in spring and summer months (April-August). Events were approximately twice as likely to occur on a weekday as on a Saturday or Sunday. The majority of events occurred during daytime business hours. Of the 15,311 events for which time of day was reported,
Contributing Factors Contributing factors consisted of primary (root) and secondary (contributing) causes. Primary factors were reported for 15,302 (98.7%) events (Figure 3a). Equipment failure and human error were the leading causal factors. Causal factors differed by location: for fixed-facility events the leading factor was equipment failure; for transportation-related events the leading factor was human error. Figure 3a. Primary Factors Reported as Contributing to EventsSource: Hazardous Substances Emergency Events Surveillance, 2007–2008 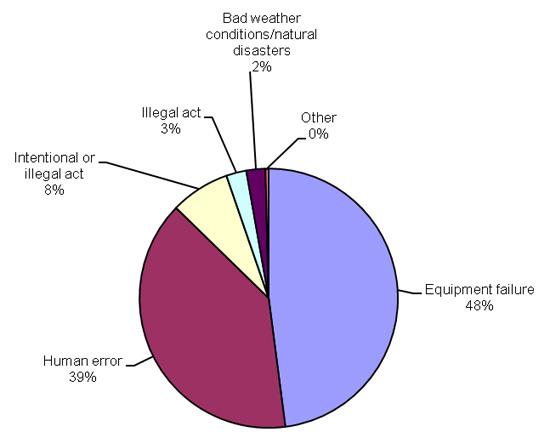
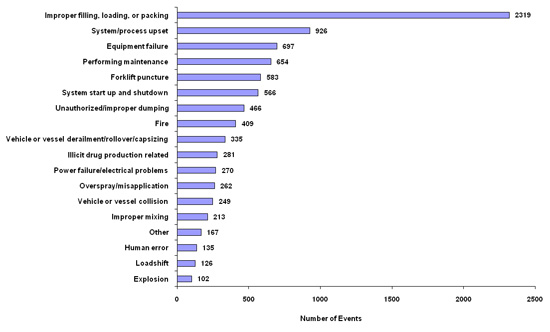
Although secondary factors were reported for 5,383 fixed-facility events and 3,377 transportation events, they were not present in every event (Figure 3b). For fixed-facility events, the most frequently reported secondary factor was system/process upset (873). For transportation-related events, the most frequently reported secondary factor involved improper filling, loading, or packing (1,845). The second most-reported secondary factor in transportation-related events was system/process upset (926). Figure 3b. Secondary Factors Reported as Contributing to EventsSource: Hazardous Substances Emergency Events Surveillance, 2007–2008
Industries
Industries were coded using the North American Industry Classification System (NAICS). The largest number of HSEES events was associated with manufacturing (NAICS 31-33, 5,430 events) and transportation and warehousing (NAICS 48-49, 4,621 events) (Table 2). The NAICS 32 manufacturing segment consisting of wood, paper, printing, petroleum and coal, chemical, plastic and rubber, and nonmetallic mineral manufacturing (4,578) accounted for the largest proportion of the events (29.5%). This segment also had the second highest number of victims (593). NAICS 81 other services had the highest total number of victims (614). The NAICS 81 category had the largest number of events with victims (406). Although NAICS 32 manufacturing and NAICS 48 transportation and warehousing resulted in the largest proportion of events, only 2.6% and 3.3% of those events, respectively, involved victims. By contrast, although NAICS 72 accommodation and food services accounted for only 0.8% of all events, 50.8% of events from that industry involved victims, resulting in a total of 320 victims. Table 2. Industries Involved in Hazardous Substances Events, by CategorySource: Hazardous Substances Emergency Events Surveillance, 2007-2008
*http://www.census.gov/epcd/naics02/naicod02.htm U.S. Census Bureau North American Industry Classification System 2002 § Total percentage doesn’t equal 100 due to rounding. 31 Includes food, beverage,
tobacco, textile, apparel, and leather & allied products manufacturing
32
Includes wood, paper, printing, petroleum & coal, chemical, plastic &
rubber, and non-metallic mineral manufacturing
33 Includes metal, machinery,
electronics, appliances, transportation equipment, furniture and miscellaneous
manufacturing
44 Includes motor vehicle, furniture & home furnishings,
electronics & appliances, building materials & garden equipment, food
& beverages, health & personal care, gasoline, and clothing &
accessories
45 Includes sporting goods, hobby, book & music supplies,
general merchandise, and miscellaneous
48 Includes transportation by air, rail,
water, truck, transit and ground passenger, pipeline, scenic and sightseeing,
and transportation support activities.
49 Includes postal service, couriers
Substances In most events (97.5%), all substances involved actually were released. Threatened releases accounted for 2.0% of events, and 0.5% of events involved substances both threatened and actually released. Of the 19,100 substances involved in events reported to HSEES during 2007–2008, 95.0% actually were released and 5.0% were threatened releases. The majority of events, 14,096, involved only one substance. Two substances were involved in 616 events, and more than two substances were involved in 794 events (Table 3). Fixed-facility events were more likely to have two or more substances involved than were transportation events (11.4% vs. 4.1%). Table 3. Number of Substances Involved Per Event, by Type of EventSource: Hazardous Substances Emergency Events Surveillance, 2007–2008
The five substances most frequently released or threatened to be released in the order of frequency were ammonia, paint not otherwise specified, carbon monoxide, hydrochloric acid, and sulfur dioxide (Appendix A). In fixed facilities, the substance categories for which releases most commonly occurred or were threatened were volatile organic compounds (22.3%), other inorganic substances (18.7%), and mixtures (11.1%) (Table 4). In transportation-related events, the most common categories were paints and dyes (17.4%), acids (16.9%), and volatile organic compounds (14.5%). A single release type was reported for 18,269 substances: spills (9,197), air (7,677), threatened release (965), fire (325), explosion (81), and radiation (24). Two release types were reported for 796 substances in the following combinations: spill and air (571), spill and fire (95), air and fire (47), fire and explosion (44), spill and explosion (25), air and explosion (13), and spill and radiation (1). The release types for 35 substances were missing. Table 4. Number of Substances Involved by Substance, Category, and Type of EventSource: Hazardous Substances Emergency Events Surveillance, 2007–2008
*Substances from different categories that were mixed or
formed from a reaction before the event. VictimsThere were 4,543 victims involved in 1,676 events (10.8% of all events) (Table 5). Of these events, 1,108 had only one victim. Two mass casualty (>50 victims) events occurred, involving 52 and 90 victims. Most victims (90.1%) were injured in fixed-facility events. Fixed facility events were more likely to have three or more victims per event (22.2%) than transportation-related events (11.6%). In addition, 774 persons were observed at a hospital or medical facility but had no symptoms resulting from the event. They were not counted as victims. Table 5. Number of Victims per Event, by Type of EventSource: Hazardous Substances Emergency Events Surveillance, 2007–2008
§ Total percentage doesn’t equal 100 due to rounding Substance Category and VictimsEvents were classified by only one substance category, regardless of whether multiple substances were involved. If multiple substances from the same category were involved, that category was used for the event. If multiple substances from different categories were involved, the event was categorized as “multiple substances.” To judge the relative threat of a substance, we looked at the percentage of events in that substance category with victims (Table 6). The most frequently released substances were not necessarily those most likely to involve victims. For example, events categorized as volatile organic compounds (VOCs) were reported more often than were events in any other category (16.1%), but only 6.3% of all events with victims involved VOCs. Oxy-organics accounted for only 8.1% of all events, yet constituted the largest percentage of events with victims (19.5%). Mixtures across different categories (13.1%) and acids (15.2%) also accounted for a high proportion of events with victims. Table 6. Frequency of Substance Categories in All Events and Events with VictimsSource: Hazardous Substances Emergency Events Surveillance, 2007-2008
§ Total percentage doesn’t equal 100 due to rounding Victim’s sex Sex was known for 3,769 of the victims. Of these, 2,475 (65.7%) were males and 1,294 (34.3%) were females. Of the 2,078 employees and responders for whom sex was reported, 75.1% were males. Victim’s age The median age of the 3,020 victims for whom an exact age was reported was 33 years (range 0–97 years). For the 3,704 victims for whom the age category was reported:
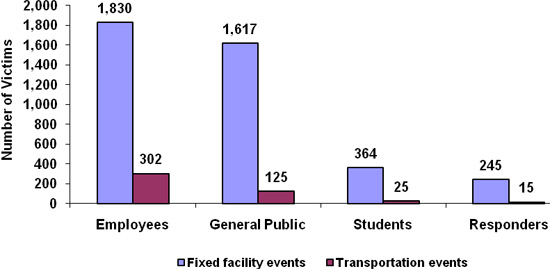
Of the 839 victims for whom age was not reported, 457 were presumed to be adults, because their population group was reported as responders or hospital personnel. Figure 4 shows the distribution of victims by population group and type of event. Employees (2,132) constituted the largest proportion of the population groups affected, followed by members of the general public (1,742). Figure 4. Number of Victims, by Population Group and Type of EventSource: Hazardous Substances Emergency Events Surveillance, 2007–2008
*The category or type of event was missing for 20 persons. In fixed-facility events, 245 responders were injured, career firefighters being the most frequent (Figure 5a). In transportation-related events, 15 responders were injured, police offers being the most frequent (Figure 5b). Figure 5a. Distribution of Responders Injured in Fixed Facility EventsSource: Hazardous Substances Emergency Events Surveillance, 2007–2008
Figure 5b. Distribution of Responders Injured in Transportation EventsSource: Hazardous Substances Emergency Events Surveillance, 2007–2008
A total of 6,838 injuries or symptoms were reported (Table 7). Some victims had more than one injury or symptom. Of all reported injuries or symptoms, the most common in fixed-facility events were respiratory tract irritation (28.6%), dizziness or other central nervous system symptoms (15.2%), headaches (14.1%), gastrointestinal symptoms and eye irritation (both 11.6%). In transportation-related events, trauma (30.2%), respiratory tract irritation (27.4%), dizziness or other central nervous system symptoms (8.7%) and eye irritation (7.9%) were reported most frequently. Table 7. Frequency of Injuries/Symptoms, by Type of EventSource: Hazardous Substances Emergency Events Surveillance, 2007–2008
*The number of injuries is greater than the number of victims (4,543) because
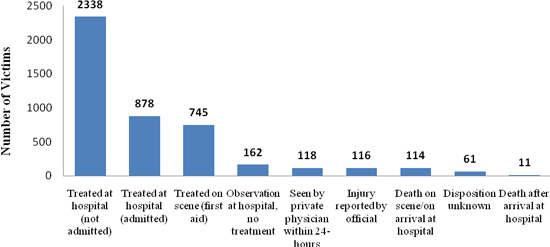
a victim could have more than one injury per event. Of the 4,543 victims, 2,338 were treated at hospitals without admission, 878 were treated at the hospital and admitted, 745 were treated at the scene, and 125 deaths were reported (Figure 6). For 61 victims, disposition was unknown. Figure 6. Injury DispositionSource: Hazardous Substances Emergency Events Surveillance, 2007–2008
Personal Protective EquipmentSelection of appropriate personal protective equipment (PPE) is a complex process that should take into account identification of the hazards or suspected hazards, the routes of potential hazards (e.g., inhalation, skin absorption, ingestion, and eye or skin contact), and the performance of the PPE materials in providing a barrier to these hazards. The amount of protection provided by PPE is material or hazard-specific. PPE is divided into four categories:
Only 288 of 2,132 employee victims wore PPE, as did 136 of 260 responder-victims. Whether PPE was worn was unknown for 79 employee victims and 11 responder victims. Of the employee-victims who wore PPE, most (104) wore level D, 13 wore level C, 2 wore level B, 8 wore level A, and 160 employee victims wore other types of protection. Among the 174 injured firefighters who wore PPE, 41 wore firefighter turnout gear with respiratory protection, and 72 wore firefighter turnout gear without respiratory protection. Two police officers wore level C and 4 employees of company response team wore level D. Nearby PopulationsThe proximity of an event to selected vulnerable areas was automatically determined either by use of geographic information systems (GIS) or, if more accurate data were available, by the health department. For 1,825 events, information about proximity to selected populations was missing altogether. Industries or other businesses were within ¼ mile of 12,297 events, residences within ¼ mile of 11,258 events, schools were within ¼ mile of 1,730 events, licensed daycare centers were within ¼ mile of 1,649 events, recreational areas were within ¼ mile of 1,621 events, nursing homes were within ¼ mile of 568 events, and hospitals were within ¼ mile of 174 events. EvacuationsEvacuations were ordered in 1,155 of 15,462 events for which evacuation status was reported. Of these evacuations, the majority (75.9%) were from the building or affected areas of the buildings. Fewer evacuations were from a defined circular area surrounding the event (12.7%), areas downwind or downstream (3.5%), a circular and downwind or downstream area (3.1%), and no defined criteria (3.5%). Evacuation area criteria were missing for 1.2% of the 1,155 evacuations ordered. The number of persons evacuated was known for 802 (69.4%) of the events and ranged from 0 to 3,800 persons, with a median of 20. The median duration of evacuation was 2 hours (range: 0 hours to 18 days). For 144 (12.5%) events, the duration of evacuation was missing. Sheltering-in-place was ordered by an official in only 156 incidents (0.1%). Sheltering-in-place means to stay inside, seal the windows and doors, and shut off any ventilation from the outside. Sheltering-in-place is ordered when an exposure threat is imminent and the safest option is to stay in one place and avoid evacuating through a hazardous cloud. DecontaminationDecontamination is the removal of contamination by removing contaminated clothing and rinsing the contaminated area with water (or another approved rinse agent). People need to be decontaminated only if they have chemicals on their clothing or bodies which could cause health effects or contribute to secondary contamination (i.e., spread of substance from person to person causing health effects). Of the 4,360 victims for whom decontamination status was known, how many actually required decontamination is not known. Most victims (3,251) were not decontaminated. Of those who were decontaminated, 651 were decontaminated at the scene, 327 were decontaminated at medical facilities, and 131 were decontaminated both at the scene and at medical facilities. Some types of responders are trained to decontaminate. Thus they may be more likely to do so, even if only as a precaution. Of the responder victims, 43.8% of EMS, 53.6% of firefighters, 77.8% of company response team members, 30.0% of police, and 44.4% of responders of unknown type were decontaminated. Non-responders may not be as aware of the need for decontamination. Of the non-responder victims, 27.4% of employees, 17.2% of students, and 20.5% of the general public received decontamination. There were 3,541 exposed non-victims (non-symptomatic) decontaminated. Decontamination was largely done at the scene. Those affected were responders (1,776), general public (1,154) employees (278), and students (223). The median number was 4 persons per event (range: 1–110 persons). For 81 exposed non-victims, decontamination occurred at a medical facility: 28 employees, 41 responders, 11 members of the general public, and 1 student. ResponseOf the 15,506 events with information on responder types, zero responders were reported for 1,114. One responder category was reported for 10,667 events and multiple responder categories for 3,569. The most frequently reported responder group was the company response team, followed by fire departments, law enforcement agencies, third party clean-up contractors, and certified HazMat teams (Table 8). Table 8. Distribution of Responder CategoriesSource: Hazardous Substances Emergency Events Surveillance, 2007–2008
*Total (20,937) is greater than the total number of events with information on responder categories because multiple responder categories could be reported per event. Reporting TimelinessOf the 10,665 events that occurred in fixed facilities, 73.8% were reported within 48 hours of the event; only 33.6% of the 4,841 transportation events were reported within 48 hours. Because obtaining information about transportation-related releases from federal or state departments of transportation was not timely, 2,275 of 4,841 transportation events were reported more than 1 month after occurrence. HSEES Pilots in India and PolandIn 2004, ATSDR began collaborating with India’s National Institute of Occupational Health (NIOH), part of the Indian Council on Medical Research in Gujarat, India, and the Nofer Institute of Occupational Medicine (NIOM) in Lodz, Poland. ATSDR’s purpose was to conduct pilot surveillance projects of acute chemical releases in these two countries using HSEES. The following data represent only 2007 because of funding constraints. IndiaThe case definitions were modified to meet the needs of India, where releases of petroleum are included if the amount released is greater than 1,000 liters. Mass poisonings are also included. Surveillance for the pilot project was limited to Gujarat state, where NIOH is located. Gujarat is a large state in Western India, with a population of more than 50 million. The state is divided into 25 districts. In a recent business census, Gujarat was found to be home to more than 14,000 factories and industrial facilities. Major industries include oil and petroleum products, refineries, mining, and heavy manufacturing operations producing steel and aluminum. The primary event notification source is the media, although reporting mechanisms have been established with the fire brigade and police. Regional data collectors are responsible for data collection, and data are entered by a central data entry person, with the principal investigator providing oversight. In 2007, a total of 230 events were reported, most of which (143) occurred in fixed facilities. Events occurred most frequently in the districts of Vadodora (56) and Ahmedabad (22). The leading industry categories where releases occurred were agriculture, forestry, fishing and hunting (52), manufacturing (43), and transportation (34). The most frequently reported primary factors were human error (50.0%) and equipment failure (48.5%). The most frequently reported secondary factor was fire (46.9%). The substance categories most frequently involved in releases were other substances (40.0%) and pesticides (19.8%). Of the 230 events, 176 involved a total of 218 victims, of whom 102 died. The victims included employees (151), members of the general public (62), firefighter not specified (4), and responders not specified (1). The most frequently reported injuries were chemical burns (32.2%) and respiratory irritation (28.5%). Evacuations were ordered in three events. PolandPoland collected data for the entire country, which is divided into16 voivodships (regions) . The Poland HSEES program used the Fire Department Headquarters in Warsaw as its main reporting source. Other sources were the Regional Inspectorate for Environmental Protection in Lodz; the Chief Sanitary Inspectorate in Warsaw; the Clinic of Acute Poisonings (NIOM); the Department of Environmental Health Hazards (NIOM); the Bureau for Chemical Substances and Preparations in Lodz; and the Department of Health Care Organization (NIOM). In Poland, 181 events were reported in 2007, of which 114 occurred in fixed facilities. Events occurred most often in the regions of Slaskie (24) and Mazowieckie (23). The leading industry categories in which releases occurred were transportation and warehousing (54) and manufacturing (26). The most frequently reported primary factors were equipment failure (47.5%) and human error (41.4%). The most frequently reported secondary factor was unauthorized/improper dumping (34.4%). The substance categories most frequently associated with releases were acids (23.8%) and other inorganic substances (20.6%). Of the 181 events, 24 involved a total of 172 victims, of whom 3 died. The victims included students (131), members of the general public (22), employees (18) and non-specified firefighters (1). The most frequently reported injury was respiratory tract irritation (74.4%). In 20 events evacuations were ordered, with a total of 1,995 people evacuated. India and Poland Pilots ConclusionThe findings from the international projects indicate that the HSEES system can be successfully implemented abroad and can be used as a tool in protecting the health of citizens from hazardous substance releases and subsequent exposures. Summary of Results, 1993–2008HSEES was supported by a series of 5-year competitive, cooperative agreements funded by ATSDR with additional support in recent years from the Centers for Disease Control and Prevention’s Coordinating Office for Terrorism Preparedness and Emergency Response. States receiving funds changed over the years (Table 9). Table 9. Years of Participation, by State, 1993–2008
*NJ was unable to collect complete data during neither 2006 nor 2008 therefore data is excluded from this report for those years. During 1993–2008, the largest proportion of events occurred in fixed facilities (Table 10a). In addition, Table 10a shows that over the previous 5 years a decrease occurred in the number of reported events and substances released, yet the decrease is not statistically significant. When comparing the states that have been consistently involved in HSEES over the past 5 years (Colorado, Iowa, Louisiana, Minnesota, North Carolina, New York, Oregon, Texas, Utah, Washington, and Wisconsin) decreases also occurred in the number of events and substances released (Table 10b). These decreases are not statistically significant either. The decrease in number of events and substances released in Table 10a could be a result of fewer states participating in HSEES and the changes in reporting quantity. Because Table 10b has decreases in the same categories, other explanations for the decline may also be possible. The possibility exists that events actually could have declined. In addition, over this same 5-year period, some event categories showed increases. The number of fatalities increased, with the highest number of fatalities, 69 deaths, occurring in each 2005, 2006, and 2007 (Table 10a). In addition, the number of events with victims increased over time. During 2008, the number of events with victims was the highest in the history of HSEES (948). During 2007, the number of victims was the highest it had been in the last 6 years, indicating that prevention activities are more necessary than ever before. Table 10a. Cumulative Data by YearSource: Hazardous Substances Emergency Events Surveillance, 1993–2008*
*Numbers in the table may differ from those reported in previous years because of edits. †The total number of events does not include one event in 2002 and one in 2005 for which the type of event was unknown. Table 10b. Cumulative Data by year, Consistent HSEES StatesSource: Hazardous Substances Emergency Events Surveillance, 2003–2008*
*Data does not include New Jersey because New Jersey’s data was not included in 2006 and 2008 analysis. *Data does not include New Jersey because New Jersey’s data was not included in 2006 and 2008 analysis.
Employees remained the group most often injured. Members of the general public constituted a large proportion of the victims. Having proper emergency plans in place may alleviate some of these injuries (Figure 7). Figure 7. Number of Vitims, by Category and YearSource: Hazardous Substances Emergency Events Surveillance, 1993–2008
Uses of HSEES DataDuring 2007–2008, ATSDR continued responding to requests for HSEES information from local, state, and federal agencies and organizations. ATSDR and state health department staff presented HSEES data in many local, state, national, and international conferences. The ATSDR HSEES Web site contains annual reports, published journal articles, public use datasets, and other information. The site also contains links to the 14 HSEES state Web sites.
Public Use DatasetATSDR has created a public use HSEES dataset to enable public health professionals and other interested parties to analyze the data. A data dictionary provides users with detailed instructions for working with the dataset. This dataset resides on the HSEES public Web site. Data contained in the file are related to events that occurred in the 17 states participating in HSEES from 1996–2004. Prevention/Outreach ActivitiesOne goal of HSEES was to develop strategies that might reduce future morbidity and mortality resulting from the release of hazardous substances. To accomplish this goal, the HSEES program made an important contribution to building capacity within each participating state health department to target prevention activities related to acute spills and their associated public health consequences. The HSEES system also built capacity to alert the proper authorities when a public health action needed immediate implementation. State HSEES coordinators often conducted activities in collaboration with other local and state agencies. The HSEES program has worked over the years with several CDC Public Health Prevention Specialists building capacity to develop sound prevention activities that can be evaluated for their effectiveness. In 2006, a CDC Public Health Prevention Service fellow developed a “HSEES Prevention Outreach and Evaluation Activity Planning Guide” for use by states. During 2007–2008, HSEES states sponsored 164 prevention/outreach activities that targeted over 390,000 persons. The HSEES Web page contains links to state HSEES Web pages where many of the prevention/outreach materials are posted. Examples of prevention activities for 2007–2008 follow: Awareness-Promoting ActivitiesRaising awareness of the public health significance of acute chemical releases and their impacts is important. This occurred mainly through presentations at meetings and distribution of HSEES materials. While increased awareness might result in reductions in hazardous substance releases and public health impacts, such results are hard to link to HSEES efforts. They may in fact lead to increases, as increased awareness of the program may produce better reporting. Thus, for these activities, states measured the effects of their activities mainly by the number of people they reached and whether that outreach resulted in changed knowledge or attitudes.
Targeted ActivitiesIdentifying high-risk groups and their preferred channels for receiving information is also important for effectively targeting prevention messages. While little research has been conducted in this area, some novel approaches have been tried. Such approaches have and will undergo evaluation to assess their effectiveness. Targeted activities during 2007–2008 included:
Substance-Specific Prevention Activities by HSEES StatesParticipating states targeted common and dangerous substances including mercury, carbon monoxide, chlorine, sulfuric acid, sulfur dioxide, ammonia, pesticides, and other agricultural substances for prevention activities in 2007–2008. States measured immediate effects (e.g., audience numbers) and mid-term effects (e.g., continued interest, requests for information, changes in behavior). Examples of state activities in 2007-2008 include:
Illicit Methamphetamine (Meth)-Related Educational ActivitiesSince 1996, HSEES has identified illicit methamphetamine production as a serious problem. Over the years, states have conducted many activities targeting these labs and precursor chemical theft or purchase. Deterrent activities have resulted in legislation to reduce these labs and their harmful effects. Many states have seen marked reductions in seizures of illegal labs, yet the public health problem persists. Among this year’s activities was dissemination of educational materials about meth labs in Utah. The Future of Hazardous Substance SurveillanceAn external peer review of the HSEES program in 2005 recommended the development of a national approach to chemical events surveillance. In addition to these recommendations, a series of meetings with interested parties has elicited gaps, overlaps, and needs. This process resulted in the development of the National Toxic Substance Incidents Program (NTSIP). The goal of NTSIP is to reduce the morbidity and mortality from toxic substance incidents. NTSIP employs three components: 1) state based surveillance; 2) incident investigations; and 3) national surveillance. Implementation of NTSIP began in fiscal year 2010. References1. Centers for Disease Control and Prevention. Comprehensive plan for epidemiologic surveillance. Atlanta: US Department of Health and Human Services; 1986. 2. Binder S. Death, injuries, and evacuations from acute hazardous materials releases. Am J Public Health 1989;70:1042–4. 3. Developing a Roadmap for the Future of National Hazardous Substances Incident Surveillance. Mary Kay O’Connor Process Safety Center Chemical Engineering Department Texas Engineering Experiment System, Texas A&M University System. Unpublished draft. December 2008. AcknowledgmentsAyana R Anderson, MPH Maureen Orr, MS Perri Zeitz Ruckart, MPH Sue L Sloop, PhD Jenny Wu, MStat We extend our grateful appreciation to our partners in the participating state health departments who, with diligence and dedication, researched and gathered much of the data for this report. Without their assistance, ideas, and comments, this report would not have been possible. Appendix A.Substances Most Frequently Released or Threatened to Be Released.Source: Hazardous Substances Emergency Events Surveillance, 2007–2008
*NOS=Not Otherwise Specified.
Appendix B.2007–2008 Publications 2007 Brackbill R, Horton DK, Ruckart P, Bove F, Orr M, Kapil V, Learn B, Thoroughman D. Hazardous substances released during rail transit — 18 states, 2002–2007. Morbidity and Mortality Weekly Report; 56(22);553-556. Horton DK, Killip K, Kelley C, Howell S, Orr M. 2006. Hazardous materials resulting from the home production of biodiesel — Colorado, May 2006. Morbidity and Mortality Weekly Report; 55(45);1227-1228. Horton DK, Wilburn R, Ehrlich J, Welles WL, Orr M, Kapil V. Elemental mercury releases attributed to antiques—New York, 2000–2006. Morbidity and Mortality Weekly Report; 56(23);576-579. Orr MF, Ruckart PZ. Surveillance of hazardous substances releases due to system interruptions, 2002. J Hazard Mater. 2007; 142: 754-59. Ruckart PZ, Burgess PA. Human error and time of occurrence in hazardous material events in mining and manufacturing. J Hazard Mater. 2007; 142: 747-53. Wattigney WA, Kaye WE, Orr MF. Acute hazardous substance releases resulting in adverse health consequences in children: Hazardous Substances Emergency Events Surveillance System, 1996–2003 . J Environ Health. 2007 Nov;70(4):17-24. 2008 Horton DK, Orr M, Kapil V, Tsongas T, Leiker R. Secondary contamination of medical personnel, equipment, and facilities resulting from hazardous materials events, 2003-2006. Disaster Medicine and Public Health Preparedness. June 2008. Ruckart PZ, Orr MF, Lanier K, Koehler A. Hazardous substances releases associated with Hurricanes Katrina and Rita in industrial settings, Louisiana and Texas. J Hazard Mater. 2008 Nov 15;159(1):53-7. Epub 2007 Oct 18. Wattigney WA, Orr MF, Williamson GD, Everett Jones S. Hazardous chemical incidents in schools — United States, 2002–2007. Morbidity and Mortality Weekly Report 2008; 57:1197-1200. |
|||||||||||||||||||||||||||||||||||||||||||||||||||||||||||||||||||||||||||||||||||||||||||||||||||||||||||||||||||||||||||||||||||||||||||||||||||||||||||||||||||||||||||||||||||||||||||||||||||||||||||||||||||||||||||||||||||||||||||||||||||||||||||||||||||||||||||||||||||||||||||||||||||||||||||||||||||||||||||||||||||||||||||||||||||||||||||||||||||||||||||||||||||||||||||||||||||||||||||||||||||||||||||||||||||||||||||||||||||||||||||||||||||||||||||||||||||||||||||||||||||||||||||||||||||||||||||||||||||||||||||||||||||||||||||||||||||||||||||||||||||||||||||||||||||||||||||||||||||||||||||||||||||||||||||||||||||||||||||||||||||||||||||||||||||||||||||||||||||||||||||||||||||||||||||||||||||||||||||||||||||||||||||||||||||||||||||||||||||||||||||||||||||||||||||||||||||||||||||||||||||||||||||||||||||||||||||||||||||||||||||||||||||||||||||||||||||||||||||||||||||||||||||||||||||||||||||||||||||||||||||||||||||||||||||||||||||||||||||||||||||||||||||||||||||||||||||||||||||||||
Agency for Toxic Substances and Disease Registry, 4770 Buford Hwy NE, Atlanta, GA 30341
Tel: (404) 498-0110 / Public Inquiries: (888) 422-8737