- DISCLAIMER
- LIST OF TABLES
- LIST OF FIGURES
- EXECUTIVE SUMMARY
- INTRODUCTION
- METHODS
- RESULTS
- MERCURY
- USES OF HSEES DATA
- SUMMARY OF RESULTS, 1993-1998
- REFERENCE
- APPENDICES
- Table 1 - Number of events meeting
the surveillance definition, by state and type of event, Hazardous Substances
Emergency Events Surveillance, 1998
- Table 2 - Distribution of the number
of substances released, by type of event, Hazardous Substances Emergency Events
Surveillance, 1998
- Table 3 - Distribution of the number
of substances released, by substance category and type of event, Hazardous
Substances Emergency Events Surveillance, 1998
- Table 4 - Distribution of the number
of victims by type of event, Hazardous Substances Emergency Events Surveillance,
1998
- Table 5 - Number of substances released
in all events and events with victims, by substance category, Hazardous Substances
Emergency Events Surveillance, 1998
- Table 6 - Distribution of type of
injury by type of event, Hazardous Substances Emergency Events Surveillance,
1998
- Table 7a - Profiles of events with
fatalities in fixed-facilities, Hazardous Substances Emergency Events Surveillance,
1998
- Table 7b - Profiles of events with
fatalities in transportation events, Hazardous Substances Emergency Events
Surveillance, 1998
- Table 8 - Cumulative data for all
states, Hazardous Substances Emergency Events Surveillance, 1993-1998
- Figure 1 - Areas of fixed facilities
involved in events, Hazardous Substances Emergency Events Surveillance, 1998
- Figure 2 - Distribution of transportation-related
events, by type of transport, Hazardous Substances Emergency Events Surveillance,
1998
- Figure 3 - Factors reported as contributing
to the occurrence of fixed-facility events, Hazardous Substances Emergency
Events Surveillance, 1998
- Figure 4 - Distribution of victims,
by population group and type of event, Hazardous Subbstances Emergency Events
Surveillance, 1998
- Figure 5 - Distribution of responder
victims, by population group and type of event, Hazardous Substances Emergency
Events Surveillance, 1998
- Figure 6 - Distribution of type of
injury for all events, Hazardous Substances Emergency Events Surveillance,
1998
- Figure 7 - Injury outcome, Hazardous
Substances Emergency Events Surveillance, 1998
- Figure 8 - Distribution of victims,
Hazardous Substances Emergency Events Surveillance, 1993-1998
- Figure 9 - Cumulative data for all
participating states, Hazardous Substances Emergency Events Surveillance,
1993-1998
- Appendix A - The 100 Most Frequently
Released Substances, Hazardous Substances Emergency Events Surveillance, 1998
- Appendix B - Hazardous Substances Emergency Events Surveillance-Related Publications
To describe the distribution and characteristics of hazardous substances emergencies.
To describe the morbidity and mortality experienced by employees, responders, and the general public as a result of hazardous substances releases.
To identify risk factors associated with the morbidity and mortality.
To identify strategies that might reduce future morbidity and mortality resulting from the release of hazardous substances.
This annual report summarizes the characteristics of hazardous substances releases and the associated public health consequences of events reported to the surveillance system during 1998.
Download Adobe Acrobat (PDF) version - 6.9 MB
Historical Document
This document is provided by the Agency for Toxic Substances and Disease Registry (ATSDR) ONLY as an historical reference for the public health community. It is no longer being maintained and the data it contains may no longer be current and/or accurate.
This publication reports the results and findings of a health study, registry, or other health-related activity supported by ATSDR in accordance with its legislative mandate described above.
Comments regarding this report are welcome. Please address to:
Agency for Toxic Substances and Disease Registry
Attn: Director, Division of Health Studies (E-31)
1600 Clifton Road, N.E.
Atlanta, Georgia 30333
Agency for Toxic Substances and Disease Registry
Jeffrey P. Koplan, MD, MPH, Administrator
Henry Falk MD, MPH, Assistant Administrator
Robert F. Spengler, ScD, Associate Administrator for Science
Division of Health Studies
Jeffrey A. Lybarger, MD, MS, Director
Sharon S. Campolucci, MSN, Deputy Director
Nancy Whitehead, Editor
Epidemiology and Surveillance Branch
Hazardous Substances Emergency Events Surveillance Staff
Wendy E. Kaye, PhD, Chief
Zahava Berkowitz, MSc
Gilbert S. Haugh, MS
Maureen Orr, MS
Casetta R. Simmons
Marie L. Socha, MS, MSPH
Perri Zeitz, MPH
DISCLAIMER
Mention of the name of any company or product does not constitute endorsement by the Agency for Toxic Substances and Disease Registry, or the U.S. Department of Health and Human Services.
CONTENTS
LIST OF TABLES
LIST OF FIGURES
LIST OF APPENDICES
EXECUTIVE SUMMARY
Since 1990, the Agency for Toxic Substances and Disease Registry (ATSDR) has maintained and active, state-based Hazardous Substances Emergency Events Surveillance (HSEES) system to describe the public health consequences associated with the release of hazardous substances. Five state health departments participated in the pilot phase of the surveillance system and began data collection on January 1, 1990. Since 1990, the number of participating state health departments has increased, with the largest number of participating states being 14 in 1995 and 1996. In 1997, the New Hampshire Department of Health and Human Services voluntarily withdrew from the HSEES system. This report summarizes the characteristics of events reported to the surveillance system by 13 state health departments during 1998.
Information on acute hazardous substances emergency events was collected. The types of data collected included general information on the event, substance(s) released, number of victims, number and types of injuries, and number of evacuations.
Several data sources were used to obtain the maximum amount of information about each event. These sources included, but were not limited to, records or oral reports of state environmental protection agencies, police and fire departments, and hospitals. The data obtained were computerized using an ATSDR-provided data entry system and were sent to ATSDR quarterly.
The 13 states reported a total of 5987 events for 1998; approximately 79% of the events occurred at fixed facilities, and 21% were transportation related. In 96% of the events, only a single substance was released. The most commonly reported categories of substances were volatile organic compounds; other inorganic substances; a category designated "other," which included substances that could not be placed in one of the other 10 categories; mixtures involving more than one category; ammonia; acids; and pesticides. During this reporting period, 405 events (approximately 7% of all reported events) resulted in a total of 1533 victims. The most frequently reported injuries sustained by victims were respiratory irritation, eye irritation, skin irritation, gastrointestinal problems, and headache. A total of 36 persons died as a result of all events, and 537 events required evacuations.
The findings regarding the distribution of the types of events, the numbers of events with victims and evacuations, and the numbers and types of injuries reported have, overall, been consistent since HSEES inception.
Since 1990, the Agency for Toxic Substances and Disease Registry (ATSDR) has maintained an active, state-based Hazardous Substances Emergency Events Surveillance (HSEES) system to describe the public health consequences associated with the release of hazardous substances. The decision to initiate a surveillance system of this type was made on the basis of a 1988 study on the reporting of hazardous substances releases to three national databases: the National Response Center Database, the Hazardous Materials Information System (HMIS), and the Acute Hazardous Events Database (1). A review of these databases indicated that they were limited because many events were missed because incomplete reporting (for example, the HMIS did not record events involving intrastate carriers or fixed-facility events). Other important types of information were not recorded, including the demographic characteristics of victims, the types of injuries received, and the number of persons evacuated. As a result of this review, ATSDR implemented the HSEES system to more fully describe the public health consequences associated with the release of hazardous substances. The surveillance system has four goals:
In 1998, 13 state health departments (Alabama, Colorado, Iowa, Minnesota, Mississippi, Missouri, New York, North Carolina, Oregon, Rhode Island, Texas, Washington, and Wisconsin) collected data for HSEES. Information was collected on standardized data collection forms. For each event, information was collected about the event, substance(s) released, victims, injuries, and evacuations.
Various data sources were used to obtain information about these events. These sources included, but were not limited to, records and oral reports of state environmental protection agencies, police and fire departments, and hospitals. Census data were used to estimate the number of residents living in the vicinity of the events. All of the data were computerized using data entry system provided by ATSDR, and sent to ATSDR quarterly.
Hazardous substances emergency events are defined by HSEES as uncontrolled or illegal releases or threatened releases of hazardous substances, or the hazardous by-products of substances. Events involving petroleum products exclusively are not included. Events are included if (1) the amount of substance that was released (or that might have been released) needed (or would have needed) to be removed, cleaned up, or neutralized according to federal, state, or local law; or (2) there was only a threatened release of a substance, but the threat led to an action (for example, evacuation) that could have affected the health of employees, emergency responders, or the general public. Victims are defined as persons who had at least one injury or died as a consequence of the event. Victims who receive more than one type of injury are counted once in each applicable type. Events are defined as transportation related if they occurred during surface, air, or water transport of hazardous substances. Fixed-facility events are defined as events that occurred at industrial sites, schools, farms, or any other type of facility. For this report, the area type in fixed-facility events includes only those events related to the following industries: agriculture, forestry, fisheries, mining, construction, manufacturing, communications, fixed-facility transportation events, and other public utilities.
For the data analyses in this report, the substances released were categorized into 11 groups. The category "mixtures" consisted of mixtures of substances from different categories, and the category "other" consisted of substances that could not be placed in one of the other 10 substance categories. The category "other inorganic substances" comprised all inorganic substances, except for acids, bases, ammonia, and chlorine.
A total of 5987 hazardous substances emergency events were reported in 1998 to the HSEES system by the 13 participating state health departments; about 1% of these events were threatened releases. Seventy-nine percent of the events occurred at fixed facilities, and 21% were transportation-related events ( Table 1 ). Forty-eight percent of all events occurred in Texas, but only a small fraction of these events were transportation-related. Thus, an annual calculation by type of event (excluding all events in Texas) indicated 32% of all events were transportation-related and 68% were fixed-facility-related events.
Forty-two percent of all fixed-facility events were reported as involving a process vessel, a reaction chamber in which chemicals are processed ( Figure 1 ). Eleven percent involved ancillary process equipment, 11% involved storage above ground, 9% involved piping, and 9% involved material handling. The remaining percentage of events involved more than one area or the area(s) was unknown. In transportation-related events, 82% occurred during ground transport (for example, truck, van, or tractor), and 14% involved transport by rail ( Figure 2 ). The remaining transportation-related events involved water, air, or pipeline transport.
Factors contributing to fixed-facility events were also reported. Figure 3 . Of the known 4734 fixed-facility events, 2644 (56%) equipment failure was a contributing factor. A total of 888 (19%) fixed-facility events were reported as involving operator error, 271 (6%) involving maintenance, and the remainder were attributable to other factors.
Ninety-six percent of all events involved the release of only one substance. Two substances were released in approximately 2% of the events, and the remainder involved the release of more than two substances ( Table 2 ).
Chemicals were either released or threatened to be released in the events. The number of substances released was higher than the number of events. Most substances released were either spills (43%) or air emissions (40%). Of the spills, 63% occurred in fixed-facility events. Of the air emissions, 98% occurred in fixed-facility events. The remaining releases resulted from fires (5%) or other types of releases (or combinations of types of releases) (10%). Two percent of the substances were threatened to be released.
Of the events with known event time, 38% occurred primarily from 6:00 AM to 12 noon, and 31% from 12 noon to 6:00 PM. Approximately 19% of events occurred on a Saturday or Sunday. Fifty-seven percent of the events occurred between April and September and 43% during the other 6 months of 1998.
Substances
Of the 11 categories into which HSEES substances were grouped, the categories of substances most commonly released in fixed-facility events ( Table 3 ) were other inorganic substances (30%), volatile organic compounds (VOCs) (22%), other substances (15%), mixtures (10%), ammonia (7%), and acids (6%). In transportation-related events, other substances (32%), other inorganic substances (13%), acids (13%), VOCs (9%), pesticides (9%), and bases (7%) were most frequently released. The 100 substances most frequently reported to HSEES for 1998 are listed in Appendix A . Eight of the top 10 substances reported are the same as in 1997.
Table 1. Number of events meeting the surveillance definition, by state and type of event, Hazardous Substances Emergency Events Surveillance, 1998.
|
State reporting event |
Type of event | Total no. of events | |||
|---|---|---|---|---|---|
| Fixed facility | Transportation | ||||
| No. of events | (%) | No. of events | (%) | ||
| Alabama | 91 | (41.7) | 127 | (58.3) | 218 |
| Colorado | 142 | (55.7) | 113 | (44.3) | 255 |
| Iowa | 190 | (66.9) | 94 | (33.1) | 284 |
| Minnesota | 341 | (90.5) | 36 | (9.5) | 377 |
| Mississippi | 107 | (60.1) | 71 | (39.9) | 178 |
| Missouri | 145 | (74.0) | 51 | (26.0) | 196 |
| New York | 383 | (84.4) | 71 | (15.6) | 454 |
| North Carolina | 88 | (56.1) | 69 | (43.9) | 157 |
| Oregon | 100 | (68.0) | 47 | (32.0) | 147 |
| Rhode Island | 30 | (81.1) | 7 | (18.9) | 37 |
| Texas | 2620 | (91.5) | 244 | (8.5) | 2864 |
| Washington | 278 | (70.2) | 118 | (29.8) | 396 |
| Wisconsin | 219 | (51.7) | 205 | (48.3) | 424 |
| Total | 4734 | (79.1) | 1253 | (20.9) | 5987 |
Figure 1. Areas of fixed facilities involved in events, Hazardous Substances Emergency Events Surveillance, 1998.
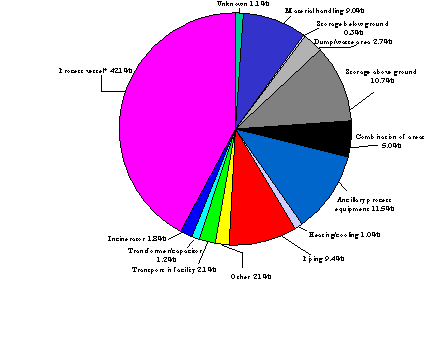
Figure 2. Distribution of transportation-related events, by type of transport, Hazardous Substances Emergency Events Surveillance, 1998
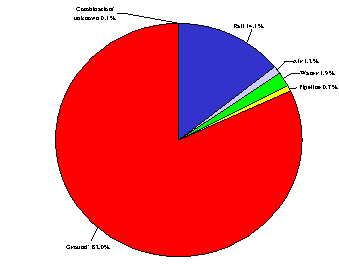
Figure 3. Factors reported as contributing to the occurrence of fixed-facility events, Hazardous Substances Emergency Events Surveillance, 1998.
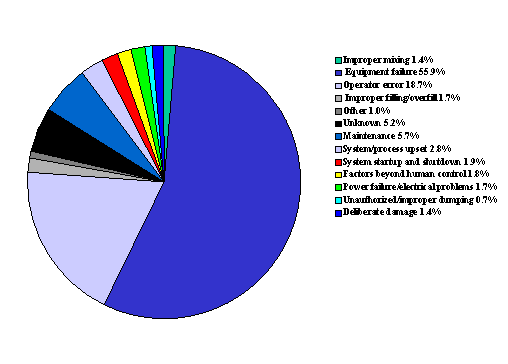
Table 2. Distribution of the number of substances released, by type of event, Hazardous Substances Emergency Events Surveillance,1998.
No. of substances released |
Type of event | All Events All events | |||||||
|---|---|---|---|---|---|---|---|---|---|
| Fixed facility | Transportation | ||||||||
| No. of events | (%) | No. of substances | No. of events | (%) | No. of substances | No. of events | (%) | No. of substances | |
| 1 | 4596 | (97.1) | 4596 | 1179 | (94.1) | 1179 | 5775 | (96.5) | 5775 |
| 2 | 77 | (1.6) | 154 | 48 | (3.8) | 96 | 125 | (2.1) | 250 |
| 3 | 30 | (0.6) | 90 | 15 | (1.2) | 45 | 45 | (0.7) | 135 |
| 4 | 16 | (0.4) | 64 | 7 | (0.6) | 28 | 23 | (0.4) | 92 |
| 5* | 15 | (0.3) | 217 | 4 | (0.3) | 27 | 19 | (0.3) | 244 |
| Total | 4734 | (100.0) | 5121 | 1253 | (100.0) | 1375 | 5987 | (100.0) | 6496 |
* Categories 5 and 6 used in previous years were combined into a single category of 5 due to small numbers.
Table 3. Distribution of the number of substances released, by substance category and type of event, Hazardous Substances Emergency Events Surveillance, 1998.
Substance Category | Type of event | All events | ||||
|---|---|---|---|---|---|---|
| Fixed facility | Transportation | |||||
| No. of substances | (%) | No. of substances | (%) | No. of substances | (%) | |
| Acids | 320 | (6.2) | 184 | (13.4) | 504 | (7.8) |
| Ammonia | 339 | (6.6) | 56 | (4.1) | 395 | (6.1) |
| Bases | 95 | (1.9) | 99 | (7.2) | 194 | (3.0) |
| Chlorine | 95 | (1.9) | 6 | (0.4) | 101 | (1.6) |
| Mixtures* | 489 | (9.5) | 53 | (3.8) | 542 | (8.3) |
| Other inorganic substances | 1532 | (29.9) | 184 | (13.4) | 1716 | (26.4) |
| Other substances | 784 | (15.3) | 443 | (32.2) | 1227 | (18.9) |
| Paints and dyes | 96 | (1.9) | 82 | (6.0) | 178 | (2.7) |
| Pesticides | 188 | (3.7) | 130 | (9.4) | 318 | (4.9) |
| Polychlorinated biphenyls | 50 | (1.0) | 9 | (0.7) | 59 | (0.9) |
| Volatile organic compounds | 1133 | (22.1) | 129 | (9.4) | 1262 | (19.4) |
| Total | 5121 | (100.0) | 1375 | (100.0) | 6496 | (100 |
* Mixtures of substances from different categories.
Victims
A total of 1533 victims were involved in 405 events (7% of all events) ( Table 4 ). Of the events with victims, 51% involved only one victim, and 68% involved either one or two victims. Eighty-six percent of the victims were injured in fixed-facility events.
The substances released most often were not necessarily the most likely to result in victims ( Table 5 ). For example, VOCs were released during 1262 events; however, only 49 (4%) of these events resulted in injury. Conversely, chlorine was released in only 101 events, and 29 (29%) of these events resulted in injury, indicating its greater potential for immediate harm. Substances associated with events with 10 or more victims were commonly released as air emissions (36%), spills (34%), or a combination of the two (9%).
The population groups most often injured were employees (66%) and the general public (17%) ( Figure 4 ). Eighty emergency response personnel were involved in fixed-facility events. Of those, 32% were professional firefighters; 25% police, 17% volunteer firefighters, 14% emergency medical technicians, 6% hospital personnel, and the remainder were emergency responders and firefighters of unknown type ( Figure 5 ). There were 18 emergency-responder victims involved in transportation-related events. Of these, 33% were police officers, 28% were professional firefighters, 22% were emergency responders of unknown affiliation, and 17% were volunteer firefighters. In 1998, responders were less likely to be placed in the category "responders of unknown type" than previous years.
The types of injuries sustained by victims are shown in Table 6 and Figure 6 . The victims sustained a total of 2783 injuries. Some victims had more than one injury. The most commonly reported injuries in fixed-facility events were respiratory irritation (34%), eye irritation (13%), skin irritation (12%), gastrointestinal problems (10%), and headache (9%). In transportation-related events, respiratory irritation (24%), trauma (20%), eye irritation (13%), dizziness and other central nervous system symptoms (9%), and headache (9%) were reported most frequently. Trauma was reported more frequently in transportation-related events (20%) than in fixed-facility events (2%). The trauma might have been caused by the sequence of events (for example, a motor vehicle accident) leading to the release of a hazardous substance, and not necessarily by exposure to the hazardous substance itself.
Table 4. Distribution of the number of victims, by type of event, Hazardous Substances Emergency Events Surveillance, 1998.
| No. of victims | Type of event | All events | |||||||
|---|---|---|---|---|---|---|---|---|---|
| Fixed facility | Transportation | ||||||||
| No. of events | (%) | No. of victims | No. of events | (%) | No. of victims | No. of events | (%) | No. of victims | |
| 1 | 130 | (44.8) | 130 | 77 | (67.0) | 77 | 207 | (51.1) | 207 |
| 2 | 53 | (18.3) | 106 | 15 | (13.0) | 30 | 68 | (16.8) | 136 |
| 3 | 24 | (8.3) | 72 | 9 | (7.8) | 27 | 33 | (8.2) | 99 |
| 4 | 23 | (7.9) | 92 | 7 | (6.1) | 28 | 30 | (7.4) | 120 |
| 5 | 16 | (5.5) | 80 | 2 | (1.7) | 10 | 18 | (4.4) | 90 |
| 6 | 44 | (15.2) | 835 | 5 | (4.4) | 46 | 49 | (12.1) | 881 |
| Total | 290 | (100.0) | 1315 | 115 | (100.0) | 218 | 405 | (100.0) | 1533 |
Table 5. Number of substances released in all events and events with victims, by substance category, Hazardous Substances Emergency Events Surveillance, 1998.
| Substance Category | No. of releases | (%) | No. of releases with victims | (%) | Percentage of releases with victims |
|---|---|---|---|---|---|
| Acids | 504 | (7.8) | 74 | (13.5) | 14.7 |
| Ammonia | 395 | (6.1) | 50 | (9.2) | 12.7 |
| Bases | 194 | (3.0) | 16 | (2.9) | 8.2 |
| Chlorine | 101 | (1.6) | 29 | (5.3) | 28.7 |
| Mixtures | 542 | (8.3) | 40 | (7.3) | 7.4 |
| Other inorganic substances | 1716 | (26.4) | 103 | (18.9) | 6.0 |
| Other, not otherwise specified | 1227 | (18.9) | 150 | (27.5) | 12.2 |
| Paints and dyes | 178 | (2.7) | 12 | (2.2) | 6.7 |
| Pesticides | 318 | (4.9) | 23 | (4.2) | 7.2 |
| Polychlorinated biphenyls | 59 | (0.9) | 0 | (0.0) | 0.0 |
| Volatile organic compounds | 1262 | (19.4) | 49 | (9.0) | 3.9 |
| Total | 6496* | (100.0) | 548 | (100.0) | 8.4 |
*Total exceeds total number of events (5987) because events at which more than one substance was released were counted more than once.
Figure 4. Distribution of victims, by population group* and type of event, Hazardous Substances Emergency Events Surveillance, 1998.
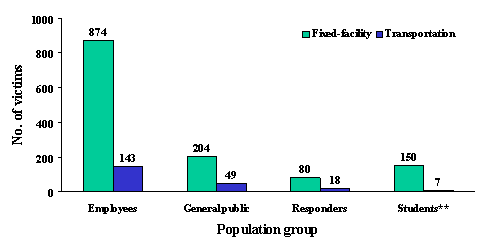
* There were 8 victims (7 in fixed-facility events and 1 in a transportation-related event) for whom population group was unknown.
**There were 3 events with 89, 35 and 14 students, respectively.
Table 6. Distribution of type of injury, by type of event,* Hazardous Substances Emergency Events Surveillance,1998.
Type of injury | Type of event | All events | ||||
|---|---|---|---|---|---|---|
| Fixed facility | Transportation | |||||
| No. of injuries | (%) | No. of injuries | (%) | No. of injuries | (%) | |
| Chemical burns | 71 | (2.9) | 24 | (7.1) | 95 | (3.4) |
| Heart problems | 40 | (1.6) | 2 | (0.6) | 42 | (1.5) |
| Dizziness /CNS† | 170 | (7.0) | 30 | (8.9) | 200 | (7.2) |
| Eye irritation | 311 | (12.7) | 43 | (12.8) | 354 | (12.7) |
| Headache | 210 | (8.6) | 29 | (8.6) | 239 | (8.6) |
| Heat stress | 7 | (0.3) | 4 | (1.2) | 11 | (0.4) |
| Gastrointestinal problems | 248 | (10.1) | 19 | (5.6) | 267 | (9.6) |
| Respiratory system | 821 | (33.6) | 80 | (23.7) | 901 | (32.4) |
| Shortness of breath | 140 | (5.7) | 13 | (3.8) | 153 | (5.5) |
| Skin irritation | 287 | (11.7) | 11 | (3.3) | 298 | (10.7) |
| Thermal burns | 36 | (1.5) | 8 | (2.4) | 44 | (1.6) |
| Trauma | 56 | (2.3) | 67 | (19.9) | 123 | (4.4) |
| Other | 49 | (2.0) | 7 | (2.1) | 56 | (2.0) |
| Total | 2446 | (100.0) | 337 | (100.0) | 2783 | (100.0) |
* The number of injuries is greater than the number of victims, because a victim could have had more than one injury.
† Central nervous system symptoms.
Figure 5. Distribution of responder victims, by population group and type of event, Hazardous Substances Emergency Events Surveillance, 1998.
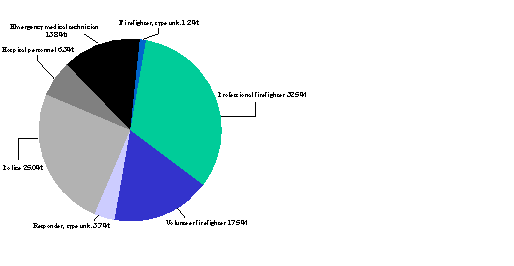
Unk.=specific type unknown.
Figure 6. Distribution of type of injury for all events, Hazardous Substances Emergency Events Surveillance, 1998.
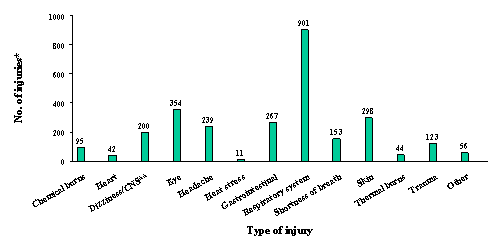
* A total of 2783 injuries was reported. The number of injuries was greater than the number of victims, because some victims had more than one injury.
† Central nervous system symptoms.
The sex of 85% of the victims was known; of these, 72% were male. Among the population groups, more of the emergency responders (93%) and employees (75%) were male. The age of 64% of the victims was known; of these, the mean age was 36 years (range: 1-77 years). Most (56%) victims were transported to a hospital and treated on an outpatient basis, and 2.3% died.
Among victims, 60% of employees, 34% of emergency responders, and 99% of students had not worn any form of personal protective equipment. For injured employees reported as wearing personal protective equipment, a combination of gloves, eye protection, and a hard hat were worn (41%). Thirteen percent wore gloves alone, and 7% wore level "D" protection, as defined by the Occupational Safety and Health Administration (OSHA). Of the known personal protective equipment worn, the most frequently worn by emergency responders was firefighter turnout gear (30%) and OSHA level "A" protection (15%).
Level "A" protection is worn when the highest level of respiratory, skin, and eye protection is needed. It includes supplied-air respirator, approved by the Mine Safety and Health Administration (MSHA), U.S. Department of Labor, and the National Institute for Occupational Safety and Health (NIOSH); pressure-demand, self-contained breathing apparatus; fully encapsulating chemical-resistant suit; coveralls; long cotton underwear; chemical resistant gloves (inner); boots, chemical-resistant, steel toe and shank; hard hat; disposable gloves and boot covers; cooling unit; and 2-way radio communications. Level "D" is worn as a work uniform and is not recommended for sites with respiratory or skin hazards. Level "D" includes coveralls, gloves, boots/shoes (leather or chemical-resistant, steel toe and shank), safety glasses or chemical splash goggles, and hard hat. Level "D" provides no protection against chemical hazards. Firefighter turnout gear is protective clothing normally worn by firefighters during structural fire-fighting operations, and is similar to level "D" protection.
Three events involved 138 students. One event, with 14 victims, took place in a middle school during a summer swimming class when a loose fitting on a pipe resulted in a spill and air emission of muriatic acid. Eight students were treated at the scene, and 6 were transported to a hospital, treated and released. The second event involved 92 victims, of which 89 were students and 3 staff members, took place in a junior high school (1200 students) where pepper gas was inappropriately released in a large dispersal area. All 92 victims were transported to a hospital. Seventy-eight of the students and 3 staff members were treated and released, and 11 students were treated and admitted. The third event involved 35 victims. It resulted from emission of VOCs by a textile manufacturing plant in an industrial complex near a school. Some students were affected by fumes in the school, and some were overcome in a school bus on their way home from school. The source of the release was initially unknown, but was later determined. Most of the symptoms were nausea, dizziness, shortness of breath, and vomiting. Twenty-two students were transported to a hospital, treated, and released. The remainder were treated on the scene.
A total of 36 persons died as a result of 25 hazardous substances emergency events (Tables 7a and 7b ). Thirteen fixed-facility events resulted in 19 fatalities (53%), and 12 transportation events resulted in 17 fatalities (47%). These frequencies demonstrate that transportation events may result in a higher proportion of deaths among victims than fixed-facility events, which was also reported in 1997. Six persons died in 1 event, 4 in 1 event, 2 in each of 3 separate events, and 1 in each of 20 separate events. A total of 31 substances were released. The types of releases in fixed-facility events were air emissions (40%), fire and explosion (27%), and spills with air emissions (13%). The types of releases in transportation events were most commonly spills (44%) and fire (31%).
Of the 36 persons who died as a result of hazardous substances releases, 35 were male, and the sex of one individual was not known. Twenty-four were employees, 11 were members of the general public, and the status of one individual was not known. In fixed-facility events, no deaths were reported for emergency responders, and one member of the general public was killed. Eleven of the 36 persons who died had sustained traumatic injuries, mostly in transportation events, and 11 of the remainder died of thermal burns, or thermal burns with smoke inhalation.
Evacuations
Evacuations were ordered in 520 events, and the evacuation status of 17 events was unknown. Of known evacuations, 66% were of a building or the affected part of a building. Eighteen percent were of a defined circular area surrounding an event, 8% were made on the basis of actual or anticipated downwind dispersion, 5% were made on the basis of a circular and downwind or downstream dispersion area, and 3% were reported as having no criteria. The median number of persons evacuated was 20. In 61 events, in-place sheltering was ordered by an official, and instructions regarding precautions to take during in-place sheltering were provided by an official in 48 of these events.
Contingency Plans
The types of contingency or preparedness plans used during an event varied, with 60% involving the use of a company's operating procedures. Nineteen percent of events were reported as using an incident-specific ad hoc plan, and 18% involved the use of a hazardous materials (HazMat) or other response team's standard operating procedures.
Figure 7. Injury outcome, Hazardous Substances Emergency Events Surveillance, 1998.
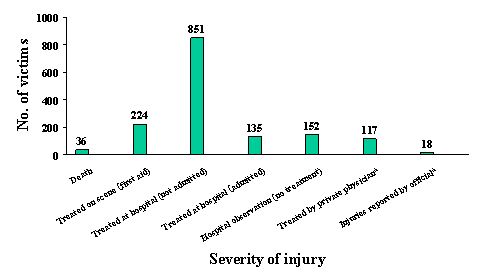
† Within 24 hours.
Table 7a.Profiles of events with fatalities in fixed-facilities, Hazardous Substances Emergency Events Surveillance, 1998.
| Event | Industry/ location |
Type of release | Chemicals (quantities) | Factors | Victim Category | Sex | Injury | PPE* | No. of deaths |
|---|---|---|---|---|---|---|---|---|---|
| 1 | Lumber/ wood treatment |
Spill | Creosote (2 gal.) | Operator | Employee | M | Trauma | 079** | 1 |
| 2 | Explosive incinerator | Explosion | Explosives | Unknown | Employee | M | Trauma | Unknown | 1 |
| 3 | Fish & marine animal oil products | Air emission | Hydrogen sulfide | Decaying organic matter | Employee | M | H2S poison | None | 1 |
| 4 | Dairy agriculture | Air emission | Nitrogen dioxide | Operator error | Employee | M | Respiratory, chemical burns, chemical asphyxia | None | 1 |
| 5 | Industrial yard | Explosion | Acetylene | Operator error | Employee | M | Trauma | None | 1 |
| 6 | Food/chem/ pharm. processing |
Spill+air emission | Ammonia | Operator error | Employee | M | Respiratory, chemical burns | Unknown | 1 |
| 7 | Vineyard, winery | Air emission | Carbon dioxide | Equipment failure | Employee | M | Suffocation | Unknown | 1 |
| 8 | Construction | Fire+ explosion |
Indeterminant (1 gallon) | Operator error | Employee | M | Respiratory, chemical, and thermal burns | Unknown | 1 |
| 9 | Construction | Air emission | CO/H2S(10 lbs) | Unknown | Employee | M | Respiratory, suffocation | Level "D" | 1 |
| 10 | Tavern | Spill+air emission | Ammonia (1000 cubic feet) | Operator error | Employee | M | Chemical burns | None | 1 |
| 11 | Silicon computer chip | Fire+ explosion | Hydrochloric acid, silicon tetrachloride (33000 lbs) | Equipment failure | Employee | M | Chemical burns | 678*** | 2 |
| 12 | Multiple family residence | Air emission | Arsenic trioxide, hydrochloric acid | Drugs | General public | M | Chemical death | None | 1 |
| 13 | Petroleum refinery | Fire+ explosion | Coke oven emission | Equipment failure | Employee | M | Thermal burns, smoke inhalation | Level "D" | 6 |
*Personal protective equipment.
**Gloves, eye protection, and steel-toed shoes.
***Firefighter turn-out gear, eye protection, and hard hat.
Table 7b. Profile of events with fatalities in transportation events, Hazardous Substances Emergency Events Surveillance, 1998.
| Event | Industry/ location |
Type of release | Chemicals (quantities) | Victim Category | Sex | Injury | PPE* | No. of deaths |
|---|---|---|---|---|---|---|---|---|
| 1 | Truck | Fire | Ammonium nitrate (12000 lbs) | General public | M | Thermal burns | None | 4 |
| 2 | Truck | Spill | Diesel fuel (100 gal) nitrogen (1 lb) | General public | M | Trauma | None | 1 |
| 3 | Truck | Spill | Corrosive dye (100 gal) | Employee | M | Trauma | None | 1 |
| 4 | Truck | Spill | Paint or coating (75 gal) | Unknown | Unknown | Trauma | Unknown | 1 |
| 5 | Truck | Spill+air emission | Hydrofluoric acid (20000 lbs) | Employee | M | Thermal burns | None | 1 |
| 6 | Fertilizer distributor | Threatened | Ammonia | Employee | M | Trauma | None | 1 |
| 7 | Crop duster | Spill+fire | Atrazine (80 gal) aviation fuel/oil (25 gal) | Employee | M | Trauma, thermal burns | Unknown | 1 |
| 8 | Truck | Spill | Toluene diamine (3000 gal) | General public | M | Trauma | None | 1 |
| 9 | Truck | Spill | Alcohol/ether/paint or coating (10 gal) | Employee | M | Trauma | None | 1 |
| 10 | Private citizen | Spill | Chloroform (5 gal) | General public | M | Asphyxia | None | 1 |
| 11 | Industrial gases | Spill+air emission | Carbon dioxide | Employee General public | M | Trauma | None | 1 |
| 12 | Illegal drug lab | Fire | Ammonia, isopropanol, lithium | General public | M | Smoke inhalation | None | 2 |
*Personal protective equipment.
Additional analyses of events involving mercury were conducted to determine their association with the adverse public health consequences of personal injuries and evacuations. Children and pregnant women are more sensitive to mercury exposure then other adults. Children can be exposed to mercury through inappropriate handling of products containing mercury (e.g., thermometers, florescent light bulbs, and medicines) in a medical facility or in a school lab. Mercury was among the 10 most commonly released substances reported to the surveillance system during 1998 ( Appendix A ). A total of 127 releases of mercury were reported to the system, of which one release included more than one substance. Ninety-eight percent of mercury events occurred at fixed facilities, and 2% were transportation related. Eighty-eight percent of these releases had information on the amount of substance that was released, which ranged from 1 milliliter to 1 gallon. Of the known factors, 77 (61%) releases occurred due to operator error, and 26 (21%) were the result of equipment failure. Twenty-six percent of the events occurred in an educational facility, 20% in residential areas, 16% in health care facilities, 14% in government/state/municipal facilities, and the remainder (24%) in other types of facilities. Ninety-six percent of the releases were spills, and the remainder involved mostly air emissions and explosions.
Three (2%) of the 126 events that involved only mercury resulted in 5 victims, all occurring in private households. Three were males and 2 females. Four victims, three of which were injured in one event, had elevated levels of mercury in their blood, and one suffered from gastrointestinal problems and headache. None of the victims wore personal protective equipment. Four victims were transported and treated in the hospital, and one of those was admitted. One was seen by a private physician within 24-hours of the event.
Evacuations were ordered in 33 (26%) of the 126 events involving only mercury. Thirteen evacuations were ordered at elementary, secondary, and vocational schools, and at colleges and universities. Evacuations involved a range of 2 to 250 persons. Although the status of evacuation in one school event was not known, 80 persons were evacuated. The median number of persons evacuated at schools was 30. The length of the evacuation period, available for 88% of events with known evacuation orders, ranged from 1 to 953 hours. These figures illustrate the potential financial costs associated with events involving mercury.
In 1998, ATSDR continued to respond to requests for HSEES information from local, state, and federal agencies and organizations. In addition, ATSDR continued to receive requests from researchers in various countries and territories for copies of the HSEES protocol and data collection form to help them develop similar surveillance systems in their countries. Also, HSEES data have been used to produce the publications listed in Appendix B .
Development of an Internet Web site specifically for persons, organizations, and agencies interested in the activities of the HSEES system is planned in the future. This Web site will, initially, provide access to published HSEES annual reports and other information that can be downloaded to a user's personal computer. Internet linkages to other relevant Web sites will be available on the HSEES Website. Currently, the 1997 annual report is posted on the Web at the following Internet location (URL): http://www.atsdr.cdc.gov/HS/HSEES/annual97.html. Other plans include collaboration with the Federal Chemical Safety and Hazard Investigation Board and other agencies and organizations involved with response to chemical terrorism, emergency response, hazardous substances releases, and public health. Six years of HSEES data are now available for trend analysis, and several publications are under way. Participating states will develop their own cumulative data reports and prevention plans.
A new Internet-based data-entry system that is year 2000 compliant will be available online in December 1999 for the use of the participating states. This will allow improved data management and synchronization, as well as more rapid reporting, which could lead to broader uses of the data.
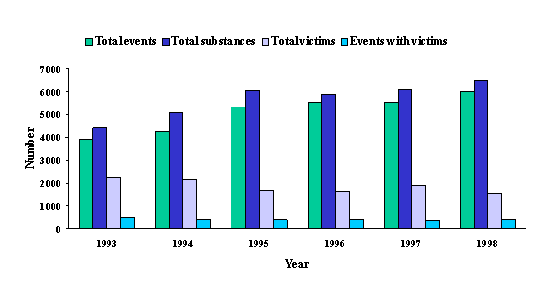
The number of events, substances released, events with victims, and deaths
for the years 1993 through 1998 are shown in
Table 8. During this period, most events
involved a single substance at fixed facilities. However, the number of transportation
events is increasing, probably the result of enhanced reporting in cooperating
states. Respiratory symptoms have consistently been reported as the most common
type of injury sustained by victims. The number of events and the number of
substances released during 1998 were the highest in the 6-year period considered.
Although the number of victims reported to HSEES in 1998 was among the smallest
reported during the period 1993-1998, there were 36 fatalities. This is the
highest number ever reported, and the highest proportion of deaths (2.3%) among
victims.
The percentage of events involving victims has remained at 7% for the last 3 years. A decrease in the percentage of events involving victims could be indicative of additional or strengthened procedures to protect health and safety, or perhaps better reporting of events with no victims. However, the number of deaths associated with events continues to suggest the need to evaluate not only the danger posed by exposure to hazardous substances, but also the circumstances surrounding the occurrence of events.
Employees continue to be the most commonly reported victims of emergency events Figure 8. Cumulative data on the number of events, substances, victims, and events involving victims are displayed in Figure 9. Overall, the findings of HSEES data collection have remained fairly consistent throughout the years.
Findings from HSEES data collection efforts provide useful information regarding risk factors related to the occurrence of emergency events and the associated morbidity and mortality. This information can be used to develop training and health education programs for persons involved in hazardous substances emergency response and planning and for manufacturers and transporters of hazardous materials. It can also be useful for training hospital emergency room personnel who may treat victims of emergency events resulting from accidental spills or acts of terrorism.
Table 8. Cumulative data for all states, Hazardous Substances Emergency Events Surveillance, 1993-1998.*
| Year | No. of states | Type of event | No. of substances released | No. of deaths | No. of victims | Events with victims |
Total (%)of events |
Fixed facility | Transportation | Total number of events | ||
|---|---|---|---|---|---|---|---|---|---|---|---|---|
| 1993 | 11 | 3254 | 637 | 3891 | 4419 | 16 | 2248 | 482 | (12) | |||
| 1994 | 12 | 3323 | 909 | 4232 | 5093 | 20 | 2178 | 414 | (10) | |||
| 1995 | 14 | 4300 | 1039 | 5339 | 6058 | 14 | 1689 | 402 | (8) | |||
| 1996 | 14 | 4341 | 1159 | 5500 | 5877 | 33 | 1620 | 390 | (7) | |||
| 1997 | 13 | 4387 | 1128 | 5515 | 6090 | 28 | 1896 | 372 | (7) | |||
| 1998 | 13 | 4734 | 1253 | 5987 | 6496 | 36 | 1533 | 405 | (7) | |||
| Total | 24339 | 6125 | 30464 | 34033 | 147 | 11164 | 2465 | (8) | ||||
* Numbers in the table may differ from those reported in previous years because of adjustments in HSEES qualification requirements for events.
†Percentage of events with victims.
Figure 8. Distribution of victims, Hazardous Substances Emergency Events Surveillance, 1993-1998.†
†The numbers of unknown victims are as follows: 14 for 1993, 6 for 1994, 3 for 1996, 14 for 1997, 8 for 1998.
Figure 9. Cumulative data for all participating states, Hazardous Substances Emergency Events Surveillance, 1993-1998.
1. Binder S. Death, injuries, and evacuations from acute hazardous materials releases. Am J Public Health 1989; 79:1042-4.
Appendix A -- The 100 Most Frequently Released Substances, Hazardous Substances Emergency Events Surveillance, 1998
*NOS--Not otherwise specified.
†Unable to assign a standardized name for the substance.
§ NPK --Nitrogen, phosphorous, potassium.
VOC--Volatile organic compounds.
Appendix B -- Hazardous Substances Emergency Events Surveillance-Related Publications
Agency for Toxic Substances and Disease Registry. ATSDR update: Hazardous Substances Emergency Events Surveillance (HSEES) system: 1993 data. Health and Environment Digest 1995;8:83-4.
Agency for Toxic Substances and Disease Registry. Hazardous Substances Emergency Events Surveillance System: information for local emergency planning committees and first responders. Atlanta: US Department of Health and Human Services, Public Health Service; 1995.
Agency for Toxic Substances and Disease Registry. Hazardous Substances Emergency Events Surveillance Annual Report, 1997. Atlanta: US Department of Health and Human Services; 1998.
Agency for Toxic Substances and Disease Registry. Hazardous Substances Emergency Events Surveillance Annual Report, 1996. Atlanta: US Department of Health and Human Services; 1997.
Agency for Toxic Substances and Disease Registry. Hazardous Substances Emergency Events Surveillance Annual Report, 1995. Atlanta: US Department of Health and Human Services; 1996.
Agency for Toxic Substances and Disease Registry. Hazardous Substances Emergency Events Surveillance Annual Report, 1994. Atlanta: US Department of Health and Human Services; 1995.
Agency for Toxic Substances and Disease Registry. Hazardous Substances Emergency Events Surveillance Annual Report, 1993. Atlanta: US Department of Health and Human Services; 1994.
Hall HI, Dhaka VR, Kaye WE, Price-Green PA. Public health consequences of hazardous substance releases. Toxicol Ind Health 1996;12:289-93.
Hall HI, Dhaka VR, Kaye WE, Price-Green PA. Surveillance of hazardous substance releases and related health effects. Arch Environ Health 1994;49:45-8.
Hall HI, Dhaka VR, Price-Green PA, Kaye WE. Surveillance for emergency events involving hazardous substances-United States, 1990-1992. MMWR 1994;43(No. SS-2):1-6.
Hall HI, Haugh GS, Price-Green PA, Dhaka VR, Kaye WE. Risk factors for hazardous substance releases that result in injuries and evacuations: data from 9 states. Am J Public Health 1996;86:855-7.
Hall HI, Price-Green PA, Dhaka VR, Kaye WE. Health effects related to releases of hazardous substances on the Superfund priority list. Chemosphere 1995;31:2455-61.
Wendt RD, Hall HI, Price-Green PA, Dhaka VR, Kaye WE. Evaluating the sensitivity of hazardous substances emergency events surveillance. A comparison of three surveillance systems. J Environ Health 1996;58(9):13-17.
Other HSEES documents available: 1995 Annual Report [HTML] [![]() ]
]
1996 Annual Report [HTML] [![]() ]
]
1997 Annual Report [HTML] [![]() ]
]
1998 Annual Report [![]() ]
]
1999-2000 Biennial Report [HTML]
[![]() ]
]
2001 Annual Report [HTML] [![]() ]
]
2002 Annual Report [HTML] [![]() ]
]
2003 Annual Report [HTML] [ ![]() ]
]
2004 Annual Report [HTML] [ ![]() ]
]
1993 through 1997 Annual Report [HTML] [![]() ]
]
1998 through 2001 Annual Report [HTML] [![]() ]
]
Agency for Toxic Substances and Disease Registry, 4770 Buford Hwy NE, Atlanta, GA 30341
Tel: (404) 498-0110 / Public Inquiries: (888) 422-8737