- Disclaimer
- List of Tables
- List of Figures
- List of Appendices
- Executive Summary
- Introduction
- Methods
- Results
- Summary of Results, 1993-2005
- Public Use Dataset
- Prevention Activities
- Uses of HSEES Data
- HSEES Pilots in India and Poland
- References
- Describe the distribution and characteristics of acute hazardous substances releases;
- Describe the morbidity and mortality among employees, responders, and the general public that resulted from hazardous substances releases; and
- Develop strategies that might reduce future morbidity and mortality.
- Numerous presentations and newsletter articles to emergency management and planning agencies, state fire marshal’s offices, Community Awareness and Emergency Response (CAER) groups, hazmat agencies, etc.
- Outreach to local public health agencies to improve reporting between the state HSEES system and local health departments.
- Periodic (quarterly/biannual) newsletter distribution.
- Presentations and brochures to improve reporting from potential sources of data, including the Poison Center Network Coordinating Committee, Worker’s Compensation Commission Safety and Health Conference, Toxic Substances Coordinating Committee, and large industries.
- Continued expansion of public health alerting networks.
- Wisconsin wrote and published an article addressing the adverse public health effects resulting from acute chlorine and ammonia releases in Wisconsin over the 11-year period of 1993 to 2003 as a follow-up to a presentation at the 2004 Collegium Ramazzini (Bhopal, India 20th Anniversary Session).
- Washington prepared and distributed a calendar on the top 10 released substances.
- New York distributed and evaluated nine brochures in the Reducing Mercury in Schools series. The state distributed more than 110,000 brochures to numerous groups and on its Website.
- Florida provided the feature article in the Florida Environmental Health Journal concerning HSEES data on carbon monoxide poisonings during power outages caused by hurricanes.
- North Carolina distributed 200 fact sheets on carbon monoxide.
- Iowa spread its agricultural ammonia safety sticker campaign into 15 more counties and subsequently saw reductions in spills in 8 of those counties.
- Iowa gave an ammonia presentation at the National Environmental Health Association.
- Wisconsin identified “action partners’ (collaborators) and gained consensus for a statewide ammonia prevention/outreach initiative.
- Texas and North Carolina prepared and distributed sodium hydroxide fact sheets.
- Minnesota participated in Meth day at the Minnesota state capital to raise awareness of the meth problem in the state. Legislation was subsequently passed limiting access to meth precursors, resulting in a large reduction in the number of meth labs in the state.
- Iowa created a drug lab safety poster for 40 rest areas.
- Oregon participated in a roundtable on the meth epidemic at the state public health association.
- North Carolina presented data on meth lab dangers to county sanitation workers.
- North Carolina distributed 1,650 fact sheets on meth.
- Oregon presented on best practices for decontamination of children at a drug-endangered children training session.
- Utah contacted local health departments to remind them of the law requiring them to report meth labs to the state health department.
- New York participated in a group that studied the efficacy and toxicity of three chemical additives to act as deterrents in anhydrous ammonia thefts and assisted in the preparation of a report for the Governor and Legislature on Additives to Anhydrous Ammonia.
- New York helped prepare a Governor’s program bill that was passed into a law that made the possession of precursor chemicals illegal, possession of anhydrous ammonia for the production of meth a felony, increased penalties under child endangerment laws for the manufacture of meth in the presence of a child, provided for development of a mandatory reporting system for all law enforcement agencies, and required increased education of mandatory reporters on recognition of labs.
- Texas produced an article for a school health bulletin.
- Utah used its outreach fact sheet to day care centers concerning mixing of cleaning to help develop effectiveness measurements.
- Colorado, Minnesota, and Wisconsin prepared spill data for their counties, and Louisiana did so for its parishes. Data were published and distributed.
- Louisiana prepared the Mississippi River Industrial Corridor and the Calcasieu Industrial Corridor fact sheet and saw slight reductions in events subsequently.
- New York and Minnesota gave presentations at numerous emergency responder training events.
- Washington evaluated the data on multiple casualty events.
Download Adobe Acrobat (PDF) version - 452KB
This document is provided by the Agency for Toxic Substances and Disease Registry (ATSDR) ONLY as an historical reference for the public health community. It is no longer being maintained and the data it contains may no longer be current and/or accurate.
In 1980, Congress created the Agency for Toxic Substances and Disease Registry (ATSDR) to implement health-related sections of laws that protect the public from hazardous wastes and environmental spills of hazardous substances. The Comprehensive Environmental Response, Compensation, and Liability Act of 1980 (CERCLA), commonly known as the "Superfund" Act, designated ATSDR as the lead agency within the Public Health Service to help prevent or reduce further exposure to hazardous substances and the adverse health effects that result from such exposures, and also to expand the knowledge base about such effects.
This publication reports the results and findings of a health study, registry, or other health-related activity supported by ATSDR in accordance with its legislative mandate described above.
Comments regarding this report are welcome. Please send your comments to the following address:
Agency for Toxic Substances and Disease Registry
Attn: Director, Division of Health Studies (E-31)
4770 Bufford Highway, N.E.
Atlanta, Georgia 30341
Centers For Disease Control and Prevention
Julie L. Gerberding, MD, MPH, Director
Agency for Toxic Substances and Disease Registry
Howard Frumkin, MD, DrPH, Director
Division of Health Studies
G. David Williamson, PhD, Director
Sharon Campolucci, MSN, Deputy Director
Anne Sowell, PhD, Assistant Director for Science
Surveillance and Registries Branch
Vikas Kapil, D.O., M.P.H., Chief
Hazardous Substances Emergency Events Surveillance Staff
Norys Guerra MD, MPH
Kevin Horton, MSPH
Natalia Melnikova, MD, PhD
Maureen Orr, MS
Perri Zeitz Ruckart, MPH
Casetta R. Simmons
Wendy Wattigney, MStat
Jennifer Wu, Mstat
Contents
Use of trade names and commercial sources is for identification only and does not imply endorsement by the Agency for Toxic Substances and Disease Registry or the U.S. Department of Health and Human Services.
List of Tables
Table 2 – Number of substances involved per event, by type of event—Hazardous Substances Emergency Events Surveillance, 2005
Table 3 – Industries involved in hazardous substance events, by category—Hazardous Substances Emergency Events Surveillance, 2005
Table 4 – Number of substances involved, by substance category and type of event—Hazardous Substances Emergency Events Surveillance, 2005
Table 5 – Number of victims per event, by type of event—Hazardous Substances Emergency Events Surveillance, 2005
Table 6 – Frequency of substance categories in all events and events with victims—Hazardous Substances Emergency Events Surveillance, 2005
Table 7 – Frequencies of injuries/symptoms, by type of event—Hazardous Substances Emergency Events Surveillance, 2005
Table 8 – Distribution of personnel who responded to the event—Hazardous Substances Emergency Events Surveillance, 2005
Table 9 – Cumulative data by year—Hazardous Substances Emergency Events Surveillance, 1993–2005
Table 10 – Time period each state participated in Hazardous Substances Emergency Events Surveillance, 1993–2005
List of Figures
Figure 1 – Areas of fixed facilities involved in mining, manufacturing, and utility events— Hazardous Substances Emergency Events Surveillance, 2005
Figure 2 – Distribution of transportation-related events, by type of transport—Hazardous Substances Emergency Events Surveillance, 2005
Figure 3a – Primary factors reported as contributing to events, by type of events—Hazardous Substances Emergency Events Surveillance, 2005
Figure 3b – Secondary factors reported as contributing to events— Hazardous Substances Emergency Events Surveillance, 2005
Figure 4 – Number of victims, by population group and type of event—Hazardous Substances Emergency Events Surveillance, 2005
Figure 5a – Distribution of responders injured in fixed facility events, by type of responder—Hazardous Substances Emergency Events Surveillance, 2005
Figure 5b – Distribution of responders injured in transportation events, by type of responder—Hazardous Substances Emergency Events Surveillance, 2005
Figure 6 – Injury disposition—Hazardous Substances Emergency Events Surveillance, 2005
Figure 7 – Number of victims, by category and year—Hazardous Substances Emergency Events Surveillance, 2005
List of Appendices
Appendix
A – Most frequently released substances, Hazardous Substances Emergency Events Surveillance, 2005
Appendix
B – Publications reference list
Executive Summary
The Hazardous Substances Emergency Events Surveillance (HSEES) system, maintained by the Agency for Toxic Substances and Disease Registry (ATSDR), actively collects information to describe the public health consequences of acute releases of hazardous substances in 15 states. This report summarizes the characteristics of events reported to ATSDR by all participating state health departments in 2005. Information about acute events involving hazardous substances was collected, including the substance(s) released, number of victims, number and types of injuries, and number of evacuations. The data were computerized by use of an ATSDR-provided Web-based data entry system.
A total of 8,603 events were reported. In 7,552 (89.9%) events, only one substance was released. The most commonly reported categories of substances were other inorganic substances (excluding chemicals in the categories of acids, bases, ammonia, and chlorine), volatile organic compounds, and mixtures involving substances from different categories that were mixed or formed from a reaction before release. During this reporting period, 778 events (9.0% of all reported events) resulted in a total of 2,034 victims, 69 (3.4%) of whom died. The most frequently reported injuries were respiratory irritation, headaches, and dizziness/central nervous system symptoms. Evacuations were ordered for 481 (5.6%) events.
Findings regarding the percentage of events involving victims and the distribution of types of injuries reported have been consistent in recent years. Topics targeted for intervention in 2005 included 1) general awareness-increasing activities; 2) illegal methamphetamine (meth) lab activities, including promotion of preventative legislation; 3) outreach on high-risk substances, including ammonia, chlorine, cleaning products, sodium hydroxide, carbon monoxide, and mercury; and 4) outreach to targeted populations, including children, high-risk counties and industrial corridors, and responders.
The Centers for Disease Control and Prevention defines
surveillance as the
"ongoing, systematic collection, analysis, and
interpretation of health data essential to the planning, implementation, and
evaluation of public health practice, closely integrated with the timely
dissemination of these data to those who need to know. The final link of the
surveillance chain is the application of these data to prevention and control. A
surveillance system includes a functional capacity for data collection,
analysis, and dissemination linked to public health programs"
[1].
Since 1990, the Agency for Toxic Substances and Disease Registry (ATSDR) has maintained an active, state-based Hazardous Substances Emergency Events Surveillance (HSEES) system to describe the public health consequences of releases of hazardous substances. The decision to initiate a surveillance system of this type was based on a study published in 1989 about the reporting of hazardous substances releases to three national databases: the National Response Center Database, the Hazardous Materials Information System (HMIS), and the Acute Hazardous Events Database [2]. A review of these databases indicated limitations. Many events were missed because of specific reporting requirements (for example, the HMIS did not record events involving intrastate carriers or fixed-facility events). Other important information was not recorded, such as the demographic characteristics of victims, the types of injuries sustained, and the number of persons evacuated. As a result of this review, ATSDR implemented the HSEES system to more fully describe the public health consequences of releases of hazardous substances. HSEES goals are to
For a surveillance system to be useful, it must not only be a repository for data, but the data must also be used to protect public health. Each participating state analyzes its data, develops appropriate prevention outreach activities, and develops ways to measure their effectiveness of activities. These activities are intended to provide industry, responders, and the public with information that can help prevent chemical releases and can reduce morbidity and mortality if a release occurs. This report provides an overview of HSEES activities for 2005 in all participating states. It summarizes the characteristics of acute releases of hazardous substances and their associated public health consequences, and it demonstrates how data from the system are translated into prevention activities to protect public health.
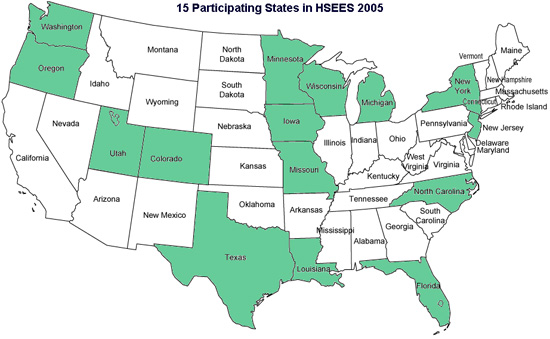
In 2005, 15 state health departments participated in HSEES: Colorado, Florida, Iowa, Louisiana, Michigan, Minnesota, Missouri, North Carolina, New Jersey, New York, Oregon, Texas, Utah, Washington, and Wisconsin. Information was collected about each event, including substance(s) released, victims, injuries (adverse health effects and symptoms), and evacuations.
Various data sources were used to obtain information about these events. These sources included records and oral reports of state environmental protection agencies, the U.S. Department of Transportation, the National Response Center, police and fire departments, and hospitals. U.S. Census Bureau data were used to estimate the number of residents in the vicinity of the events. All data were computerized by use of a Web-based data entry system provided by ATSDR.
HSEES defines hazardous substances emergency events as acute uncontrolled or illegal releases or threatened releases of hazardous substances. Events involving releases of only petroleum are excluded. Events are included if (a) the amount of substance released (or that might have been released) needed (or would have needed) to be removed, cleaned up, or neutralized according to federal, state, or local law; or (b) the release of a substance was threatened, but the threat led to an action (for example, evacuation) that could have affected the health of employees, emergency responders, or members of the general public. HSEES defines victims as persons who experience at least one documented adverse health effect within 24 hours after the event or who die as a consequence of the event. Victims who receive more than one type of injury or symptom are counted once for each applicable injury type or symptom. Events are defined as transportation-related if they occur (a) during surface, air, pipeline, or water transport of hazardous substances; or (b) before the substance is unloaded from a vehicle or vessel. All other events are considered fixed-facility events.
For data analyses, the substances released were categorized into 16 groups. The category “mixture” comprises substances from different categories that were mixed or formed from a reaction before the event; the category “other inorganic substances” comprises all inorganic substances except acids, bases, ammonia, and chlorine; and the category “other” comprises substances that could not be grouped into one of the existing categories.
For 2005, HSEES received reports of 8,603 acute hazardous substances events; 210 (2.4%) of these events were threatened releases; 99 (1.5%) were events in which substances were both threatened to be released and actually released. The number of events occurring in fixed facilities was 6,386 (74.2%), while 2,216 (25.8%) occurred during transportation. Two states, Texas and New York, reported 38.4% of all releases (Table 1).
Table 1. Number of events meeting the surveillance definition, by state and type of event—Hazardous Substances Emergency Events Surveillance, 2005
| STATE | Fixed facility | Transportation | No. of all events | ||
|---|---|---|---|---|---|
| No. of Event | %* | No. of event | %* | ||
| Colorado | 62 | 38.5 | 99 | 61.5 | 161 |
| Florida | 399 | 68.8 | 181 | 31.2 | 580 |
| Iowa | 216 | 71.5 | 86 | 28.5 | 302 |
| Louisiana | 704 | 81.2 | 163 | 18.8 | 867 |
| Michigan | 258 | 67.4 | 125 | 32.6 | 383 |
| Minnesota | 271 | 66.6 | 136 | 33.4 | 407 |
| Missouri | 145 | 46.3 | 168 | 53.7 | 313 |
| New Jersey | 574 | 76.6 | 175 | 23.4 | 749 |
| New York | 724 | 72.2 | 279 | 27.8 | 1003 |
| North Carolina | 164 | 52.2 | 150 | 47.8 | 314 |
| Oregon | 129 | 70.5 | 54 | 29.5 | 183 |
| Texas | 2012 | 87.6 | 285 | 12.4 | 2297 |
| Utah | 442 | 85.5 | 75 | 14.5 | 517 |
| Washington | 134 | 74.4 | 46 | 25.6 | 180 |
| Wisconsin | 152 | 43.9 | 194 | 56.1 | 346 |
| Total | 6386 | 74.2 | 2216 | 25.8 | 8602 |
*Percentage = (number of events by type of event per state/total number of events in that state) x 100
** Of total 8603 events, one event in Washington State had event type missing.
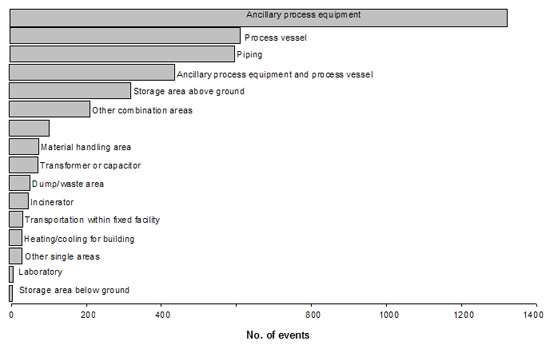
For fixed-facility events occurring in mining, manufacturing, or utilities, reporters could select one or two types of area or equipment involved in the event. Of all 4,149 fixed-facility events in these industries, 3,222 (77.7%) reported one type of area and 759 (18.3%) reported a combination of two area types. Type of area was not reported for 168 (4.0%) events. The main areas were classified as follows: 1,321 (33.2%) ancillary processing equipment, 614 (15.4%) process vessel, 600 (15.1%) piping, and 323 (8.1%) storage above ground (Figure 1).
Figure 1. Areas of fixed facilities involved in mining, manufacturing, and utility events— Hazardous Substances Emergency Events Surveillance, 2005
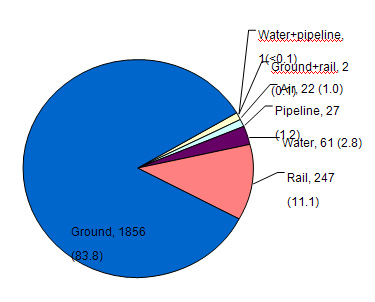
Of the 2,216 transportation-related events, 1,858 (83.8%) occurred during ground transport only (e.g., truck, van, or tractor), and 247 (11.1%) involved transport by rail only (Figure 2). Fewer events involved water, air, and pipeline transportation modes. Most ground transportation events (73.8%) involved trucks. The largest proportions of transportation-related events involved releases from a moving vehicle or vessel (718 [32.4%]) and releases en route that were later discovered at fixed facilities (630 [28.4%]). Of the 2,216 transportation-related events, 603 (27.3%) occurred during unloading of a stationary vehicle or vessel.
Figure 2. Distribution of transportation-related events, by type of transport— Hazardous Substances Emergency Events Surveillance, 2005
Factors consisted of primary (root) and secondary (immediate contributing) causes. Primary factors were reported for 8,523 (99.1%) events (Figure 3a). Overall, equipment failure was the most frequent primary factor. For fixed facilities, the most common primary factor was equipment failure (3,623 [56.7%]); for transportation-related events, human error (1,464 [66.1%]) was most common. Secondary factors were reported for 5,289 (61.5%) events (Figure 3b). Of the reported secondary factors, most fixed-facility events involved system/process upset (737 [19.1%), and most transportation-related events involved improper filling, loading, or packing (752 [51.3%]).
Figure 3a. Primary factors reported
as contributing to events, by type of events — Hazardous Substances Emergency
Events Surveillance, 2005
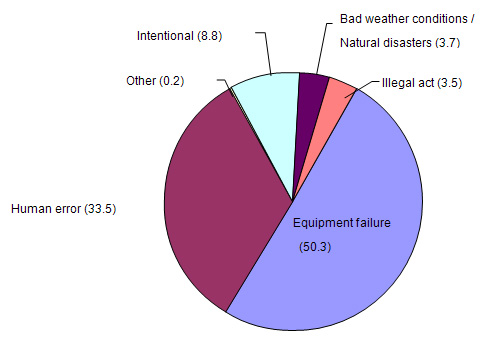
Figure 3b.
Secondary factors reported as contributing to events — Hazardous Substances
Emergency Events Surveillance, 2005*
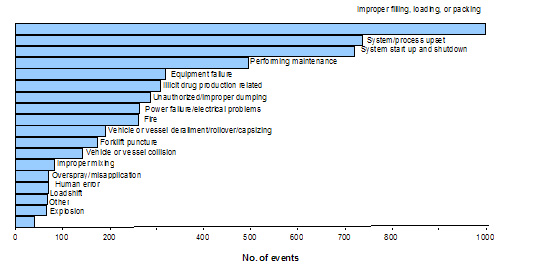
* Of total 8603 events, 3272 have no secondary factor, and 42 have secondary factor missing.
A total of 7,551 (89.9%) of all events involved the release of only one substance. Two substances were released in 394 (4.4%) of the events, and more than two substances were released in 657 (7.6%) (Table 2). Fixed-facility events were more likely to have two or more substances released in an event than transportation events (14.4% vs. 5.8%).
Table 2. Number of substances involved per event, by type of event—Hazardous Substances Emergency Events Surveillance, 2005
| No. sub-stances | Type of event | All events | |||||||
|---|---|---|---|---|---|---|---|---|---|
| Fixed facility | Transportation | ||||||||
| No. events | % | Total sub-stances | No. events | % | Total sub-stances | No. events | % | Total sub-stances | |
| 1 | 5464 | 85.6 | 5464 | 2087 | 94.2 | 2087 | 7551 | 89.9 | 7551 |
| 2 | 305 | 4.8 | 610 | 89 | 4.0 | 178 | 394 | 4.4 | 788 |
| 3 | 127 | 2.0 | 381 | 23 | 1.0 | 69 | 150 | 1.5 | 450 |
| 4 | 332 | 5.2 | 1328 | 8 | 0.4 | 32 | 340 | 2.8 | 1360 |
| >=5 | 158 | 2.5 | 1290 | 9 | 0.4 | 66 | 167 | 1.4 | 1356 |
| Total | 6386 | 100.0 | 9073 | 2216 | 100.0 | 2432 | 8602 | 100.0 | 11505 |
* Of total 8603 events, one event in Washington State had event type missing.
The number of events by month ranged from 561 (6.5%) in December to 861 (10.0%) in August, with the summer months having the highest number of events. The proportion of events ranged from 15.1% to 17.5% during weekdays, and from 8.1% to 9.8% during weekend days. Of all 8,516 (99.0%) events for which time of day or time category was reported, 34.9% occurred from 6:00 AM to 11:59 AM, 31.8% from 12:00 PM to 5:59 PM, 18.2% from 6:00 PM to 11:59 PM, and the remainder between midnight and 5:59 AM.
The largest number of HSEES events was associated with the manufacturing (3,553 [41.3%]) and transportation (1865 [21.7%]) industries (Table 3). Within manufacturing, wood, paper, printing, petroleum and coal, chemical, plastic and rubber, and non-metallic mineral manufacturing (3,069 [86.4%]) accounted for most of the events. The largest number of events with victims occurred in the other services (205 [26.3%]), a number that includes repair and maintenance; personal and laundry services; religious, grantmaking, civic, and professional services; and private households. The total number of victims was greatest in other services (321 [15.8%]), followed by not-an-industry (212 [10.4%]), and manufacturing of wood, paper, printing, petroleum and coal, chemical, plastic and rubber, and non-metallic mineral (201 [9.9%]). Although the wood, paper, printing, petroleum and coal, chemical, plastic and rubber, and non-metallic mineral manufacturing industry resulted in a large proportion of events with victims and a large number of victims, only 1.8% of all this category of events involved victims. Conversely, 55.9% of all events in accommodation and food services industry involved victims; however, they constituted only a small proportion (2.4%) of events with victims.
Table 3. Industries involved in hazardous substance events, by category—Hazardous Substances Emergency Events Surveillance, 2005
| Industry Category | Total Events | Events with victims | % of events with victims | Total No. of victims | |||
|---|---|---|---|---|---|---|---|
| 2-digit NAICS Classification* | No. | % | No. | % | No. | (min - max) | |
| (11) Agriculture, Forestry, Fishing and Hunting | 159 | 1.8 | 23 | 3.0 | 14.5 | 109 | (1-67) |
| (21) Mining | 164 | 1.9 | 4 | 0.5 | 2.4 | 6 | (1-2) |
| (22) Utilities | 432 | 5.0 | 12 | 1.5 | 2.8 | 29 | (1-7) |
| (23) Construction | 63 | 0.7 | 6 | 0.8 | 9.5 | 8 | (1-3) |
| (31) Manufacturing 3 ¶ | 195 | 2.3 | 28 | 3.6 | 14.4 | 80 | (1-10) |
| (32) Manufacturing 1 † | 3069 | 35.7 | 56 | 7.2 | 1.8 | 201 | (1-45) |
| (33) Manufacturing 2 ‡ | 289 | 3.4 | 23 | 3.0 | 8.0 | 56 | (1-14) |
| (42) Wholesale Trade | 494 | 5.7 | 19 | 2.4 | 3.8 | 85 | (1-51) |
| (44) Retail Trade 1 § | 85 | 1.0 | 16 | 2.1 | 18.8 | 41 | (1-18) |
| (45) Retail Trade 2 # | 36 | 0.4 | 7 | 0.9 | 19.4 | 37 | (1-22) |
| (48) Transportation | 1865 | 21.7 | 85 | 10.9 | 4.6 | 182 | (1-36) |
| (49) Warehousing | 83 | 1.0 | 3 | 0.4 | 3.6 | 3 | (1) |
| (51) Information | 10 | 0.1 | 1 | 0.1 | 10.0 | 4 | (4) |
| (52) Finance and Insurance | 5 | 0.1 | 2 | 0.3 | 40.0 | 3 | (1-2) |
| (53) Real Estate and Rental and Leasing | 104 | 1.2 | 18 | 2.3 | 17.3 | 78 | (1-16) |
| (54) Professional, Scientific, and Technical Services | 36 | 0.4 | 3 | 0.4 | 8.3 | 7 | (1-3) |
| (55) Management of Companies and Enterprises | 1 | 0.0 | 0 | 0.0 | 0.0 | 0 | 0 |
| (56) Administrative and Support and Waste Management and Remediation Services | 179 | 2.1 | 21 | 2.7 | 11.7 | 69 | (1-30) |
| (61) Educational Services | 115 | 1.3 | 36 | 4.6 | 31.3 | 142 | (1-15) |
| (62) Health Care and Social Assistance | 69 | 0.8 | 17 | 2.2 | 24.6 | 63 | (1-9) |
| (71) Arts, Entertainment, and Recreation | 49 | 0.6 | 12 | 1.5 | 24.5 | 90 | (1-37) |
| (72) Accommodation and Food Services | 34 | 0.4 | 19 | 2.4 | 55.9 | 125 | (1-53) |
| (81) Other Services | 431 | 5.0 | 205 | 26.3 | 47.6 | 321 | (1-10) |
| (92) Public Administration | 73 | 0.8 | 15 | 1.9 | 20.5 | 34 | (1-7) |
| Not an Industry | 448 | 5.2 | 110 | 14.1 | 24.6 | 212 | (1-22) |
| Unknown | 115 | 1.3 | 37 | 4.8 | 32.2 | 49 | (1-4) |
| Total | 8603 | 100.0 | 778 | 100.0 | 9.0 | 2034 | (1-67) |
* Based on U.S. Census Bureau North American Industry Classification System Revisions 2002.
(http://www.census.gov/epcd/naics02/naicod02.htm)
¶ Includes food, beverage, tobacco, textile, apparel, and leather and allied products manufacturing
† Includes wood, paper, printing, petroleum & coal, chemical, plastic & rubber, and non-metallic mineral manufacturing
‡ Includes metal, machinery, electronics, transportation equipment, furniture and miscellaneous manufacturing
§ Includes motor vehicle, furniture & home furnishings, electronics & appliances, building materials & garden equipment, food & beverages, health & personal care, gasoline, and clothing & accessories
# Includes sporting goods, hobby, book & music supplies, general merchandise, and miscellaneous
A total of 11,506 substances were involved in the 8,603 events, of which 916 (8.0%) substances were reported as threatened to be released. The substances most frequently released were carbon monoxide, sulfur dioxide, ammonia, and nitrogen oxide (Appendix A). Substances were grouped into 16 categories. The substance categories most commonly released in fixed-facility events were other inorganic substances (2,329 [25.7%]), volatile organic compounds (1,616 [17.8%]), and mixtures (1,388 [15.3%]) (Table 4). In transportation-related events, the most common substance categories released were acids (383 [15.7%]), paints and dyes (376 [15.5], and volatile organic compounds (359 [14.8%]).
Two types of releases (e.g., spill and air) could be reported for each substance. Only one type of release was associated with the following: air releases (5,716 [52.7%]), spills (3,855 [35.6%]), threatened releases (916 [8.4%]), fire (322 [3.0%]), explosion (28 [0.3%]), and radiation (8 [0.1%]). Of events with two types of releases, the following combinations were reported: spill and air releases (457 [69.1%]), spill and fire (84 [12.7%]), air releases and fire (44 [6.7%]), fire and explosion (58 [8.8%]), spill and explosion (11 [1.7%]), air releases and explosion (6 [0.9%]), and spill and radiation (1 [0.2%]).
Table 4. Number of substances involved, by substance category and type of event—Hazardous Substances Emergency Events Surveillance, 2005
| Substances category | Fixed facility event | Transportation event | All events | |||
|---|---|---|---|---|---|---|
| No. substances | % | No. substances | % | No. substances | % | |
| Acids | 557 | 6.1 | 383 | 15.7 | 940 | 8.2 |
| Ammonia | 456 | 5.0 | 85 | 3.5 | 541 | 4.7 |
| Bases | 216 | 2.4 | 225 | 9.3 | 441 | 3.8 |
| Indeterminate¶ | 5 | 0.1 | 3 | 0.1 | 8 | 0.1 |
| Chlorine | 286 | 3.2 | 63 | 2.6 | 349 | 3.0 |
| Formulations | 8 | 0.1 | 3 | 0.1 | 11 | 0.1 |
| Hetero-Organics | 39 | 0.4 | 16 | 0.7 | 55 | 0.5 |
| Hydrocarbons | 101 | 1.1 | 38 | 1.6 | 139 | 1.2 |
| Mixture across Chemical Category* | 1388 | 15.3 | 88 | 3.6 | 1476 | 12.8 |
| Other † | 410 | 4.5 | 175 | 7.2 | 585 | 5.1 |
| Other inorganic substances ‡ | 2329 | 25.7 | 184 | 7.6 | 2513 | 21.8 |
| Oxy-Organics | 1035 | 11.4 | 151 | 6.2 | 1186 | 10.3 |
| Paints & dyes | 137 | 1.5 | 376 | 15.5 | 513 | 4.5 |
| PCB's | 73 | 0.8 | 9 | 0.4 | 82 | 0.7 |
| Pesticides | 276 | 3.0 | 192 | 7.9 | 468 | 4.1 |
| Polymers | 141 | 1.6 | 82 | 3.4 | 223 | 1.9 |
| Volatile organic compounds | 1616 | 17.8 | 359 | 14.8 | 1975 | 17.2 |
| Total | 9073 | 100.0 | 2432 | 100.0 | 11505 | 100.0 |
¶ Type of event was unknown for one substance in the paints and dyes category.
* Substances from different categories that were mixed or formed from a reaction before the event.
† Not belonging to one of the existing categories.
‡ All inorganic substances except for acids, bases, ammonia, and chlorine.
There were 2,034 victims involved in 778 events (9.0% of all events). Of these events, 495 (63.6%) involved only one victim, and 108 (13.9%) involved two victims (Table 5). Of all victims, 1,721 (84.6%) were injured in fixed-facility events. Fixed-facility events were more likely to have three or more victims per event (24.0%) than were transportation-related events (16.2%). An additional 718 persons in 233 events (2.7% of all events) were observed at a hospital or medical facility but did not have symptoms resulting from the event and were not, therefore, counted as victims.
Table 5. Number of victims per event, by type of event—Hazardous Substances Emergency Events Surveillance, 2005
| No. victims | Fixed Facility | Transportation | All events | ||||||
|---|---|---|---|---|---|---|---|---|---|
| No. event | % | Total victims | No. event | % | Total victims | No. event | % | Total victims | |
| 1 | 397 | 63.0 | 397 | 98 | 66.2 | 98 | 495 | 63.6 | 495 |
| 2 | 82 | 13.0 | 164 | 26 | 17.6 | 52 | 108 | 13.9 | 216 |
| 3 | 49 | 7.8 | 147 | 10 | 6.8 | 30 | 59 | 7.6 | 177 |
| 4 | 25 | 4.0 | 100 | 3 | 2.0 | 12 | 28 | 3.6 | 112 |
| 5 | 13 | 2.1 | 65 | 2 | 1.4 | 10 | 15 | 1.9 | 75 |
| >=6 | 64 | 10.2 | 848 | 9 | 6.1 | 111 | 73 | 9.4 | 959 |
| Total | 630 | 100.0 | 1721 | 148 | 100.0 | 313 | 778 | 100.0 | 2034 |
To represent the magnitude of the effects of substances involved in injuries, the number of events in a specific substance category was compared with the number of events in the same substance category that involved victims. In events that involved one or more substances from a specific substance category, substances were counted once in that category. In events that involved two or more substances from different categories, substances were counted once in the multiple substance category. Substances released most often were not necessarily the most likely to involve victims (Table 6). For example, events categorized as other inorganic substances constituted 15.2% of all events; however, only 4.1% of these events resulted in injuries. Conversely, events involving chlorine exclusively accounted for 3.6% and those involving ammonia exclusively 5.4% of all events, but 29.4% of the chlorine events and 10.5% of ammonia events involved injuries.
Table 6. Frequency of substance categories in all events and events with victims—Hazardous Substances Emergency Events Surveillance, 2005
| Substance category | All events | Event with victim | |||
|---|---|---|---|---|---|
| No. | % | No. | % of all releases with victims | % of events with victims in substance category | |
| Acids | 687 | 8.0 | 83 | 10.7 | 12.1 |
| Ammonia | 465 | 5.4 | 49 | 6.3 | 10.5 |
| Bases | 326 | 3.8 | 27 | 3.5 | 8.3 |
| Chlorine | 313 | 3.6 | 92 | 11.8 | 29.4 |
| Formulations | 10 | 0.1 | 2 | 0.3 | 20.0 |
| Hetero-Organics | 47 | 0.5 | 7 | 0.9 | 14.9 |
| Hydrocarbons | 46 | 0.5 | 5 | 0.6 | 10.9 |
| Mixture across Chemical Category† | 1384 | 16.1 | 79 | 10.2 | 5.7 |
| Multiple substance category | 868 | 10.1 | 72 | 9.3 | 8.3 |
| Other ‡ | 315 | 3.7 | 35 | 4.5 | 11.1 |
| Other inorganic substances § | 1303 | 15.2 | 53 | 6.8 | 4.1 |
| Oxy-Organics | 718 | 8.4 | 165 | 21.2 | 23.0 |
| Paints & dyes | 469 | 5.5 | 6 | 0.8 | 1.3 |
| Pesticides | 368 | 4.3 | 52 | 6.7 | 14.1 |
| Polychlorinated biphenols (PCBs) | 74 | 0.9 | 0 | 0.0 | 0.0 |
| Polymers | 175 | 2.0 | 8 | 1.0 | 4.6 |
| Volatile organic compounds | 1030 | 12.0 | 43 | 5.5 | 4.2 |
| Total¶ | 8598 | 100.0 | 778 | 100.0 | 9.0 |
† Substances from different categories that were mixed or formed from a reaction before the event.
‡ Not classified.
§ All inorganic substances except for acids, bases, ammonia and chlorine.
¶ Of a total 8,603 events, 5 events with 8 substances were excluded because they were not assigned a substance category.
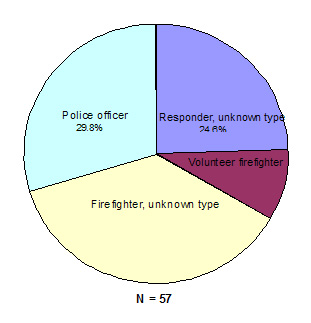
Members of the general public (955 [47.0%]) constituted the largest proportion of the population groups injured, followed by employees (795 [39.1%]) (Figure 4). In fixed-facility events, 127 emergency response personnel were injured. Of those, most (44 [34.6%]) were police officers, (Figure 5a). In transportation-related events, 57 responders were injured; most (21 [36.8%]) were firefighters of unknown type (Figure 5b). Of injured responders, career firefighters were injured more frequently in fixed-facility events (20.5%) than in transportation related events (0%).
Figure 4. Number of victims, by population group
and type of event—Hazardous Substances Emergency Events Surveillance, 2005
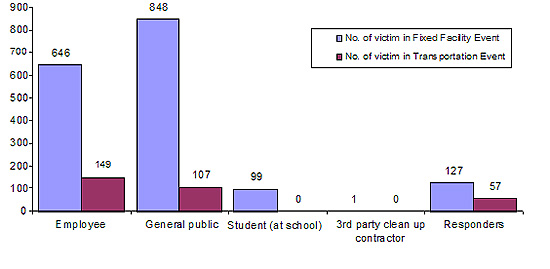
Figure 5a. Distribution of responders injured in fixed facility events, by type of responder —Hazardous Substances Emergency Events Surveillance, 2005
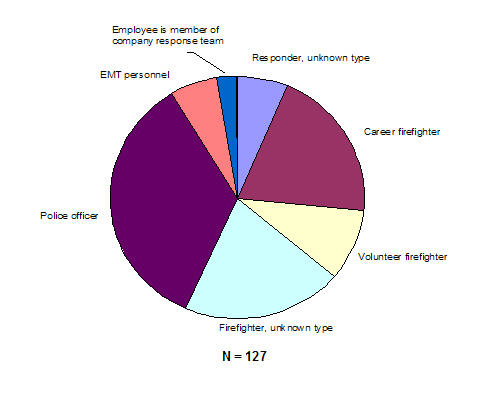
Figure 5b. Distribution of responders injured in transportation events, by type of responder—Hazardous Substances Emergency Events Surveillance, 2005
Victims were reported to sustain a total of 3,222 injuries or symptoms (Table 7). Some victims had more than one injury or symptom. Of all reported injuries or symptoms, the most common injuries or symptoms in fixed-facility events were respiratory irritation (850 [30.4%]), headaches (473 [16.9%]), and dizziness or central nervous system symptoms (389 [13.9%]). In transportation-related events, respiratory irritation (116 [27.2%]) and trauma (106 [24.9%]) were reported most frequently. Most (63.8%) of the trauma injuries in transportation-related events were not substance-related; these injuries resulted from a chain of events—such as a motor vehicle accident leading to the release of a hazardous substance—and not from exposure to the substance itself.
Table 7. Frequencies of injuries/symptoms, by type of event—Hazardous Substances Emergency Events Surveillance, 2005
| Injury/symptom | Fixed facility | Transportation | All events | |||
|---|---|---|---|---|---|---|
| No. | % | No. | % | No. | % | |
| Burns† | 118 | 4.2 | 42 | 9.9 | 160 | 5.0 |
| Dizziness/central nervous system symptoms | 389 | 13.9 | 27 | 6.3 | 416 | 12.9 |
| Eye Irritation | 247 | 8.8 | 30 | 7.0 | 277 | 8.6 |
| Gastrointestinal | 281 | 10.1 | 26 | 6.1 | 307 | 9.5 |
| Headache | 473 | 16.9 | 15 | 3.5 | 488 | 15.1 |
| Heart problems | 12 | 0.4 | 4 | 0.9 | 16 | 0.5 |
| Heat Stress | 9 | 0.3 | 1 | 0.2 | 10 | 0.3 |
| Other | 23 | 0.8 | 3 | 0.7 | 26 | 0.8 |
| Respiratory irritation | 850 | 30.4 | 116 | 27.2 | 966 | 30.0 |
| Short of breath | 142 | 5.1 | 34 | 8.0 | 176 | 5.5 |
| Skin Irritation | 137 | 4.9 | 22 | 5.2 | 159 | 4.9 |
| Trauma‡ | 115 | 4.1 | 106 | 24.9 | 221 | 6.9 |
| Total | 2796 | 100.0 | 426 | 100.0 | *3222 | 100.0 |
* The number of injuries is greater than the number of victims (2,034) because a victim could have had more than one injury.
† Of the 160 burn injuries, 79 were chemical-related, 68 were thermal burns, 6 were both chemical and thermal, and the type was unknown for 7.
‡ Of the 221 trauma injuries, 71 were chemical-related, 141 were not chemical-related, 3 were both, and type was unknown for 4.
The median age of the 1,181 (58.1%) victims for whom exact age was reported was 35 years (range: 0–100 years). For the 1,579 (77.6%) injured persons for whom an age category was reported, 9 (0.6%) were under 1 year of age, 42 (2.7%) were 1–4 years of age, 190 (12.0%) were 5–14 years of age, 106 (6.7%) were 15–19 years of age, 843 (53.4%) were 20–44 years of age, 322 (20.4%) were 45–64 years of age, and 67 (4.2%) were >65 years of age. Of the 455 injured persons for whom age was not reported, 240 (52.3%) were presumably adults (because their population group was reported as responders or employees), and 215 (47.3%) could have been adults or children (because their population group was reported as members of the general public and students).
Sex was known for 1,670 (82.1%) of the victims; of these, 1,064 (63.7%) were males. Of all employees and responders for whom sex was reported, 80.0% were males.
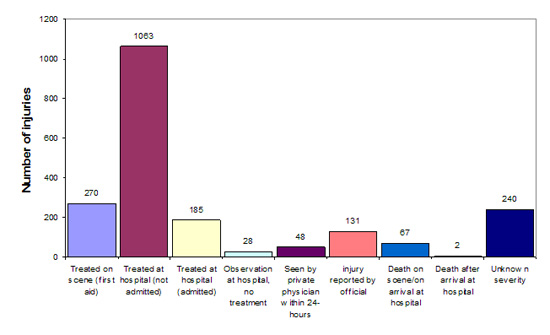
Of the 2,034 victims, 1,063 (52.3%) were treated at hospitals without admission, and 270 (13.3%) were treated at the scene; 69 (3.4%) deaths were reported (Figure 6). The severity was unknown for 240 (11.8%) victims. PPE use was reported for 711 (89.4%) of employee-victims and 133 (72.3%) responder-victims. Most of the employee-victims (87.5%) and 48.1% of the responder-victims had not worn any form of PPE. Employee-victims (35 [4.9%]) who wore PPE most often used minimal protection such as gloves, eye protection, hard hat, and/or steel-toed shoes. Responder-victims (26 [19.6%]) who wore PPE most often used firefighter turnout gear with respiratory protection, followed by minimal protection such as gloves, eye protection, hard hat, and/or steel-toed shoes (23 [17.3%]). Firefighter turnout gear is protective clothing usually worn by firefighters during structural firefighting operations and is similar to Level ”D” protection. The Occupational Safety and Health Administration defines Level “D” protection as coveralls, boots/shoes (chemical-resistant leather, steel toe and shank), safety glasses or chemical splash goggles, and hard hats. Level “D” provides limited protection against chemical hazards.
Three events involved more than 50 victims each. In one event, a farm worker misapplied a mixture of pesticides, causing 67 people at a nearby elementary school to experience adverse health effects, including gastrointestinal problems, headaches, dizziness/central nervous system effects, and respiratory and skin irritation. The farm worker used the wrong applicator, and although he allowed a 50-foot buffer zone between the farm and the school, 8–10 mph winds blew the mixture into the school’s air handling system. The school was immediately evacuated, and it remained closed for one week until clean-up was completed. Fifty-seven (85.1%) victims were students and 8 (11.9%) were staff members; it was unknown if the remaining 2 (3.0%) victims were students or staff members. Most (89.6%) victims had their injuries reported by an official within 24 hours of the event, 6 (9.0%) were seen by a private physician within 24 hours of the event, and 1 (1.5%) was treated at a hospital but not admitted.
In another event, a housekeeper at a hotel was taking out the trash and accidentally set off a can of pepper spray that a tourist had left in the trash. The fumes drifted into other parts of the hotel and caused 53 hotel guests to experience headaches and respiratory irritation; 52 were treated at a hospital and released, and one person was admitted to a hospital. Three hundred people were evacuated from the hotel for 12 hours while the building was decontaminated by hazmat crews.
A fire at an agriculture warehouse caused 51 people (44 members of the general public, 6 responders of unknown type, and 1 career firefighter) to experience adverse health effects, including respiratory irritation, headaches, dizziness/central nervous system effects, eye irritation, shortness of breath, skin irritation, and gastrointestinal problems. Forty-four people were treated at a hospital and released, three people were admitted to a hospital, and four people were seen by a private physician. Additionally, 11 people were observed at a hospital but did not have any symptoms or injuries. A section of the highway was closed, and businesses and homes within a ½-mile radius of the event were evacuated for 2.5 days. It is unknown what caused the fire, but it is speculated to have been an electrical problem.
Figure 6. Injury disposition—Hazardous Substances
Emergency Events Surveillance, 2005
The proximity of an event location to selected populations was determined by use of geographic information systems (GIS) or health department records. Reported residences were within ¼ mile of 6,475 (77.6%) events, schools were within ¼ mile of 911 (11.1%) events, hospitals were within ¼ mile of 83 (1.0%) events, nursing homes were within ¼ mile of 349 (4.2%) events, licensed daycare centers were within ¼ mile of 1,027 (12.5%) events, industries or other businesses were within ¼ mile of 7,956 (96.0%) events, and recreational areas were within ¼ mile of 805 (9.8%) events. Information about proximity of the event location to selected populations was missing for 261–371 events.
The number of events at which persons were at risk of exposure was determined primarily by use of GIS. There were 6,626 (80.3%) events in which persons were living within ¼ mile of the event; 7,347 (89.0%) events with persons living within ½ mile; and 7,967 (96.5%) events with persons living within 1 mile. Information was missing on the number of persons living within ¼ mile for 351 events, within ½ mile for 351 events, and within 1 mile for 350 events.
Evacuations were ordered in 481 (5.6%) of 8,579 events for which the evacuation status was reported. Of these evacuations, 77.7% were from buildings or affected parts of buildings; 10.0% were from defined circular areas surrounding the event locations; 4.9% were from areas downwind or downstream of the event; and 2.8% were from circular and downwind or downstream areas. The remainder had no defined criteria. The number of persons evacuated was known for 341 (70.9%) events. This number ranged from 1 to 8,000 persons, with a median of 20. However, one ordered evacuation was reported as having no evacuees. The median length of evacuation was 2 hours (range: 6 minutes to 14 days). Evacuation length was missing for 45 (9.4%) events. Of all 8,603 events, 1,735 (20.2%) had access to the area restricted; 98 (1.1%) events had in-place sheltering ordered by an official.
Of the 1,843 (90.6%) victims for whom decontamination status was known, 1,585 (86.0%) were not decontaminated, 150 (8.1%) were decontaminated at the scene, 72 (3.9%) were decontaminated at medical facilities, and 36 (2.0%) were decontaminated at both the scene and at medical facilities.
For events in which uninjured persons were decontaminated, the median number of uninjured decontaminated individuals was 3 persons per event (range: 1–200 persons). Decontamination was done at medical facilities for 3 uninjured employees, 7 uninjured responders, 24 uninjured members of the general public, and 3 students. Decontamination was done at the scenes for 169 uninjured employees, 470 uninjured responders, 85 uninjured members of the general public, and 281 uninjured students.
Of the 8,572 (99.6%) events with information on who responded to the event, 1,843 (21.5%) events reported no response. In 1,876 (27.9%) events, there were multiple types of responders: 810 (43.2%) events reported 2 categories of responders, 504 (26.9%) events reported 3 categories, 318 (17.0%) events reported 4 categories, and 244 (13.0%) events reported 5 or more categories. A total of 10,644 responder categories were reported; the most frequent was the response team from the company where the release occurred (4,761 [44.7%]), followed by fire departments (1,380 [13.0%]), law enforcement agencies (1,181 [11.1%]), and certified HazMat teams (814 [7.6%]) (Table 8).
Table 8. Distribution of personnel who responded to the event—Hazardous Substances Emergency Events Surveillance, 2005
| Responder Category | No.† | % of Events |
|---|---|---|
| Certified HazMat team | 814 | 7.6 |
| Company's response team | 4761 | 44.7 |
| Dept. of works/utilities/transportation (inlcudes Coast Guard) | 231 | 2.2 |
| Emergency medical technicians | 499 | 4.7 |
| Environmental agency/EPA | 608 | 5.7 |
| Fire department | 1380 | 13.0 |
| Health department/health agency | 169 | 1.6 |
| Hospital personnel | 89 | 0.8 |
| Law enforcement agency | 1181 | 11.1 |
| Other | 33 | 0.3 |
| Specialized multiagency teams | 28 | 0.3 |
| State, county or local emergency managers /coordinators /planning committees | 137 | 1.3 |
| Third party clean-up contractors | 714 | 6.7 |
| Total | 10644 | 100.0 |
* In 31 events, response information was not reported and in 1843 events there was no response.
† Total (10644) greater than total number of event (8603) because multiple responder categories could be reported per event.
Of the 6,386 events that occurred in fixed facilities, 3,960 (62.0%) were reported within 48 hours of occurrence, while 790 (35.7%) of the 2,216 transportation events were reported within 48 hours. Information about road-related releases from federal or state departments of transportation was not timely; 1,018 of 2,216 (45.9%) transportation events were reported more than one month after occurrence. Of the 8,603 events reported in 2005, the incident information for 4,750 (55.2%) events was entered into HSEES system in 48 hours; information for 6,275 (72.9%) events was reported within 7 days, and information for 1,643 (19.1%) events was reported more than one month after the incident happened.
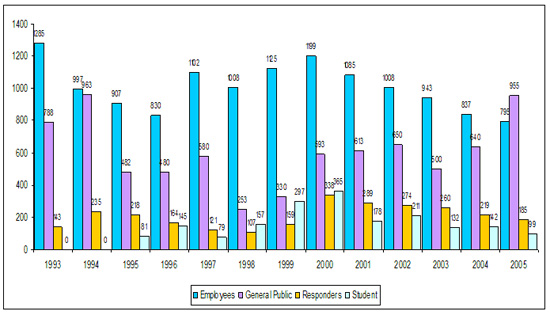
During 1993–2005, the largest proportion of events occurred in fixed facilities (Table 9). The percentage of events with victims was highest in 1993 (12.1%) and lowest in 1997 (6.7%). Respiratory irritation has consistently been the most frequently reported injury. Employees continue to be the most commonly reported victims of acute chemical releases. However, in 2005 the percentage of employee victims was 39.1%, the lowest percentage in the last 13 years. Members of the general public constitute a large proportion of the victims as well (Figure 7). In 2005 the percentage of victims who were members of the general public (46%) reached the highest level in 13 years. Table 10 shows the states that have participated in HSEES from 1993–2005.
The number of deaths associated with acute hazardous substances events has increased in recent years. Many of these deaths were attributed to non-chemical circumstances surrounding the events (e.g., a crash resulting from high-speed travel of a truck pulling an ammonia tank).
Table 9. Cumulative data by year—Hazardous Substances Emergency Events Surveillance, 1993–2005
| Year | No. Participating states | Type of event | No. substances released | No. victim | No. deaths | Events with victims | |||
|---|---|---|---|---|---|---|---|---|---|
| Fixed facility | Transportation | Total | No. | %† | |||||
| 1993 | 11 | 3,199 | 634 | 3,833 | 4,361 | 2,230 | 16 | 464 | 12.1 |
| 1994 | 12 | 3,321 | 912 | 4,233 | 5,072 | 2,181 | 21 | 414 | 9.8 |
| 1995 | 14 | 4,273 | 1,037 | 5,310 | 6,027 | 1,688 | 14 | 402 | 7.6 |
| 1996 | 14 | 4,327 | 1,159 | 5,486 | 5,861 | 1,622 | 33 | 390 | 7.1 |
| 1997 | 13 | 4,385 | 1,128 | 5,513 | 6,089 | 1,896 | 28 | 372 | 6.7 |
| 1998 | 13 | 4,729 | 1,252 | 5,981 | 6,486 | 1,533 | 36 | 405 | 6.8 |
| 1999 | 13 | 4,634 | 1,626 | 6,260 | 6,974 | 1,912 | 30 | 504 | 8.0 |
| 2000 | 15 | 5,499 | 2,049 | 7,548 | 8,342 | 2,513 | 44 | 752 | 10.0 |
| 2001 | 16 | 6,736 | 2,242 | 8,978 | 11,764 | 2,168 | 22 | 710 | 7.9 |
| 2002 | 15 | 6,493 | 2,520 | 9,013‡ | 11,009 | 2,150 | 47 | 739 | 8.2 |
| 2003 | 15 | 6,782 | 2,323 | 9,105 | 12,018 | 1,835 | 51 | 720 | 7.9 |
| 2004 | 13 | 5,687 | 2,057 | 7,744 | 10,323 | 1,838 | 41 | 620 | 8.0 |
| 2005 | 15 | 6,386 | 2,216 | 8,602‡ | 11,506 | 2,034 | 69 | 778 | 9.0 |
| Total | 66,451 | 21,155 | 69,991 | 105,832 | 25,600 | 452 | 7,270 | 9.1 | |
The number of substances released has also increased. The percentage of events with victims was highest in 1993 (12.1%) and lowest in 1997 (6.7%).
Respiratory irritation has consistently been the most frequently reported injury.
Employees continue to be the most commonly reported victims of acute chemical releases. However, in 2004 the percentage of employee victims was 45.5%, which is the second lowest year in the last 12 years (1994, 45.4%). Members of the general public constitute a large proportion of the victims as well (Figure 7). The number of injured responders has increased recently, and this increase likely results from police officers who are injured when responding to events involving the manufacture of methamphetamine.
The number of deaths associated with acute hazardous substances events has increased in recent years. Many of these deaths were attributed to nonchemical circumstances surrounding the events (e.g., a crash resulting from high-speed travel of a truck pulling an ammonia tank).
Figure 7. Number of victims, by category and year—Hazardous Substances Emergency Events Surveillance, 2004*
ATSDR has created a public-use HSEES dataset to enable public health professionals and other interested parties to perform their own analyses. A data dictionary provides users with detailed instructions for working with the dataset. This dataset is available for download from the ATSDR Web site. Data contained in the file are related to events that occurred in the 17 participating HSEES states from 1996 to 2005. The public use dataset contains 65,629 records.
Table 10. Time period each state participated in Hazardous Substances Emergency Events Surveillance, 1993–2005
| State | Years Participated |
|---|---|
| Alabama | 1993-2003 |
| Colorado | 1993-2005 |
| Florida | 2005 |
| Iowa | 1993-2005 |
| Louisiana | 2001-2005 |
| Michigan | 2005 |
| Minnesota | 1995-2005 |
| Mississippi | 1995-2003 |
| Missouri | 1994-2005 |
| New Hampshire | 1993-1996 |
| New Jersey | 2000-2005 |
| New York | 1993-2005 |
| North Carolina | 1993-2005 |
| Oregon | 1993-2005 |
| Rhode Island | 1993-2001 |
| Texas | 1993-2005 |
| Utah | 2000-2005 |
| Washington | 1993-2005 |
| Wisconsin | 1993-2005 |
Numerous prevention outreach activities were conducted in 2005. Appendix B is a cumulative list of journal articles produced by the ATSDR HSEES Program through 2005. Activities in 2005 included:
Awareness promoting activities
Substance-specific prevention activities
Illicit methamphetamine (meth)-related activities
During 2005, ATSDR continued to respond to requests for HSEES information from local, state, and federal agencies and organizations. The ATSDR HSEES Internet Website page is available at http://www.atsdr.cdc.gov/HS/HSEES/. At this site, annual reports and other information can be downloaded. Internet links to other relevant Web sites (e.g., participating state Web sites) and the public-use dataset are also available. Each state site is updated with state activities and annual reports.
HSEES-related activities in 2005 included collaboration with other agencies and organizations that are involved with response to chemical terrorism, emergency response, hazardous substances, and public health (e.g., the U.S. Environmental Protection Agency).
An important contribution of HSEES data is its help in building capacity within each participating state health department to target prevention activities related to acute spills and their associated public health consequences. Because HSEES is funded in part through the Centers for Disease Control and Prevention (CDC)’s Coordinating Center for Terrorism Preparedness and Emergency Response, the HSEES system is also building capacity to alert the authorities when a public health action needs to be implemented immediately. Activities are conducted by state HSEES coordinators, often in collaboration with other local and state agencies. The program has been working over the years with several CDC Public Health Prevention Specialists to build capacity within the program to develop sound prevention activities that can be evaluated for their effectiveness.
HSEES Pilots in India and Poland
In 2004, ATSDR began collaborating with India’s National Institute of Occupational Health (NIOH), part of the Indian Council on Medical Research in Gujarat, India and the Nofer Institute of Occupational Medicine (NIOM) in Lodz, Poland, to conduct a pilot surveillance project of acute chemical releases in these two countries by using HSEES.
India
The case definitions were modified to meet India’s needs. In India, releases of petroleum are included if the amount released is greater than 1,000 liters, and mass poisonings are also included. Surveillance for the pilot project was limited to Gujarat state, where NIOH is located. Gujarat is a large state in Western India with a population of more than 50 million. In a recent business census, Gujarat was found to be home to more than 14,000 factories and industrial facilities. Major industries include oil and petroleum products, refineries, mining, and heavy manufacturing operations producing steel and aluminum. The primary notification source for events is the media, although reporting mechanisms have been established with the fire brigade and police. Regional data collectors are responsible for data collection, and data are entered by a central data entry person, with oversight of the Principal Investigator.
In India, 93 events were reported in 2005, most of which (70 [75.3%]) occurred in a fixed facility. Of the 25 districts in Gujarat, India, the most frequent events occurred in Vadodora (36 [38.7%]) and Ahmedabad (17 [18.3%]). The leading industry categories where releases occurred included manufacturing (36 [38.7%]) and transportation (18 [19.4%]). The substance categories most frequently involved in releases were other substances and volatile inorganic compounds. Of the 93 events, 60 (64.5%) involved a total of 236 victims, of whom 93 (39.4%) died. The most commonly reported victims were employees and members of the general public. The most frequently reported injuries were burns and respiratory irritation.
Poland
In Poland, data were collected for the entire country. The Poland HSEES program used the Fire Department Headquarters in Warsaw as its main reporting source. Other sources used by Poland HSEES were the Regional Inspectorate for Environmental Protection in Lodz; the Chief Sanitary Inspectorate in Warsaw; the Clinic of Acute Poisonings (NIOM); the Department of Environmental Health Hazards (NIOM); the Bureau for Chemical Substances and Preparations in Lodz; and the Department of Health Care Organization (NIOM).
In Poland, 268 events were reported in 2005, most of which (163 [61.0%]) were transportation-related. Of the 16 voivodships (regions) in Poland, the most frequent events occurred in Slaskie (46 [17.2%]), Mazowieckie (32 [11.9%]), and Dolnoslaskie (31 [11.6%]). The leading industry categories where releases occurred included transportation (91 [34.0%]), other services (74 [27.6%]), and manufacturing (metal, electric, vehicle) (19 [7.1%]). The substance categories most frequently associated with releases were other inorganic substances, acids, and volatile inorganic compounds. Of the 268 events, 43 (16.0%) involved a total of 191 victims, of whom one (0.5%) died. The most commonly reported victims were students, employees, and members of the general public. The most frequently reported injuries were respiratory, gastrointestinal symptoms, and headaches.
The findings from the international projects indicate that HSEES can be successfully implemented abroad and that HSEES is a potential strategy to protect the health of international citizens from hazardous substances releases and subsequent exposures.
1. Centers for Disease Control and Prevention. Comprehensive plan for epidemiologic surveillance. Atlanta: US Department of Health and Human Services; 1986.
2. Binder S. Death, injuries, and evacuations from acute hazardous materials releases. Am J Public Health 1989;70:1042-4.
Most frequently released substances, Hazardous Substances Emergency Events Surveillance, 2005
| Substance name | No. of Releases | % of Releases | Rank |
|---|---|---|---|
| Carbon Monoxide | 702 | 6.10 | 1 |
| Nitrogen Oxide (nox) (includes Oxides of Nitrogen) | 665 | 5.78 | 2 |
| Sulfur Dioxide | 570 | 4.95 | 3 |
| Ammonia | 528 | 4.59 | 4 |
| Paint not otherwise specified | 441 | 3.83 | 5 |
| Volatile Organic Compounds not otherwise specified | 343 | 2.98 | 6 |
| Sulfuric Acid | 262 | 2.28 | 7 |
| Sodium Hydroxide | 254 | 2.21 | 8 |
| Chlorine | 239 | 2.08 | 9 |
| Hydrochloric Acid | 238 | 2.07 | 10 |
| Benzene | 145 | 1.26 | 11 |
| Methamphetamine Chemicals not otherwise specified | 139 | 1.21 | 12 |
| Mercury | 130 | 1.13 | 13 |
| Ethylene Glycol | 128 | 1.11 | 14 |
| Hydrogen Sulfide | 117 | 1.02 | 15 |
| Nitric Oxide | 115 | 1.00 | 16 |
| Nitrogen Dioxide | 92 | 0.80 | 17 |
| Acetone | 86 | 0.75 | 18 |
| Polychlorinated Biphenyls | 77 | 0.67 | 19 |
| Butadiene | 74 | 0.64 | 20 |
| Vinyl Chloride | 74 | 0.64 | 21 |
| Sodium Hypochlorite | 65 | 0.56 | 22 |
| Acid not otherwise specified | 63 | 0.55 | 23 |
| Toluene | 61 | 0.53 | 24 |
| Freon | 58 | 0.50 | 25 |
| Resin not otherwise specified | 57 | 0.50 | 26 |
| Solvent not otherwise specified | 56 | 0.49 | 27 |
| Hydrogen Peroxide | 52 | 0.45 | 28 |
| Asbestos | 52 | 0.45 | 29 |
| Iodine | 52 | 0.45 | 30 |
| Ethylene | 46 | 0.40 | 31 |
| Hydrochloric (Muriatic) Acid | 45 | 0.39 | 32 |
| Propylene | 45 | 0.39 | 33 |
| Methanol not otherwise specified | 44 | 0.38 | 34 |
| Nitric Acid | 44 | 0.38 | 35 |
| Antifreeze | 43 | 0.37 | 36 |
| Pesticide not otherwise specified | 42 | 0.37 | 37 |
| Propane | 42 | 0.37 | 38 |
| Pseudoephedrine | 42 | 0.37 | 39 |
| Diesel Fuel | 42 | 0.37 | 40 |
| Phosphoric Acid | 41 | 0.36 | 41 |
| Potassium Hydroxide | 40 | 0.35 | 42 |
| Xylene | 40 | 0.35 | 43 |
| Alumina, Activated | 40 | 0.35 | 44 |
| Alcohol not otherwise specified | 39 | 0.34 | 45 |
| Chloroform | 36 | 0.31 | 46 |
| Methamphetamine | 36 | 0.31 | 47 |
| Ethylene Oxide | 35 | 0.30 | 48 |
| Ethyl Ether | 35 | 0.30 | 49 |
| Isopropyl Alcohol | 33 | 0.29 | 50 |
| Hydrofluoric Acid | 32 | 0.28 | 51 |
| Nitrous Oxide | 32 | 0.28 | 52 |
| Ethyl Alcohol | 32 | 0.28 | 53 |
| Phosphorus | 31 | 0.27 | 54 |
| Flammable Liquid not otherwise specified | 30 | 0.26 | 55 |
| Mix: Carbon Monoxide/Hydrogen Sulfide/Nitrogen Oxide/Sulfur Dioxide/Volatile Organic Compounds not otherwise specified | 30 | 0.26 | 56 |
| Ink not otherwise specified | 29 | 0.25 | 57 |
| Lithium | 29 | 0.25 | 58 |
| Adhesive not otherwise specified | 28 | 0.24 | 59 |
| Ethanol not otherwise specified | 28 | 0.24 | 60 |
| Paint Thinner not otherwise specified | 28 | 0.24 | 61 |
| Sodium Chloride | 28 | 0.24 | 62 |
| Styrene | 28 | 0.24 | 63 |
| Corrosive not otherwise specified | 27 | 0.23 | 64 |
| Ethylene Dichloride | 27 | 0.23 | 65 |
| 1,3-Butadiene | 25 | 0.22 | 66 |
| Carbon Monoxide not otherwise specified | 25 | 0.22 | 67 |
| Isopropanol not otherwise specified | 25 | 0.22 | 68 |
| Urea Ammonium Nitrate | 24 | 0.21 | 69 |
| Acetic Acid | 23 | 0.20 | 70 |
| Mix: Carbon Monoxide/Nitrogen Oxide | 23 | 0.20 | 71 |
| Carbon Tetrachloride | 21 | 0.18 | 72 |
| Coleman Fuel | 21 | 0.18 | 73 |
| Nitrogen Fertilizer | 21 | 0.18 | 74 |
| Caustic Soda | 20 | 0.17 | 75 |
| Ammonium Nitrate | 19 | 0.17 | 76 |
| Carbon Dioxide | 19 | 0.17 | 77 |
| Fluorocarbon 22 | 19 | 0.17 | 78 |
| Formaldehyde | 19 | 0.17 | 79 |
| Propylene Glycol | 19 | 0.17 | 80 |
| Sulfur Molten | 19 | 0.17 | 81 |
| Battery Acid | 18 | 0.16 | 82 |
| Mix: Carbon Monoxide/Nitrogen Dioxide/Nitrogen Oxide/Sulfur Dioxide | 18 | 0.16 | 83 |
| Motor Oil | 18 | 0.16 | 84 |
| Mix: Carbon Monoxide/Nitrogen Dioxide/Propylene | 17 | 0.15 | 85 |
| Mix: Ammonia/Carbon Monoxide | 16 | 0.14 | 86 |
| Mix: Carbon Monoxide/Nitrogen Oxide/Sulfur Dioxide/Volatile Organic Compounds not otherwise specified | 16 | 0.14 | 87 |
| Phenol | 16 | 0.14 | 88 |
| Cleaning Agent not otherwise specified | 15 | 0.13 | 89 |
| Lighter Fluid not otherwise specified | 15 | 0.13 | 90 |
| Methyl Alcohol | 15 | 0.13 | 91 |
| Sulfuric (Battery) Acid | 15 | 0.13 | 92 |
| Acetylene | 14 | 0.12 | 93 |
| Hexane | 14 | 0.12 | 94 |
| Methyl Ethyl Ketone | 14 | 0.12 | 95 |
| Mix: Carbon Monoxide/Ethylene/Nitrogen Dioxide | 14 | 0.12 | 96 |
| Mix: Carbon Monoxide/Nitrogen Dioxide/Nitrogen Oxide | 14 | 0.12 | 97 |
| Mix: Hydrogen Sulfide/Sulfur Dioxide | 14 | 0.12 | 98 |
Publications reference list
2005
Ernst KP, Wattigney WA, Kaye WE. Releases from improper chemical mixing, Hazardous Substances Emergency Events Surveillance system, 1996-2001. J Occup Environ Med 2005; 47:287-93.
Centers for Disease Control and Prevention (CDC). Public health consequences from hazardous substances acutely released during rail transit-South Carolina, 2005; selected states, 1999-2004. MMWR 2005;53:64-7.
Horton DK, Burgess P, Rossiter S, Kaye WE. Secondary contamination of emergency department personnel from o-chlorobenzylidene malononitrile exposure, 2002. Am J Emerg Med 45(6):655-658.
Horton DK, Berkowitz Z, Kaye WE. Morbidity and mortality from hazardous materials events in the personal services industry, 1993–2001: A follow-Up report from the Hazardous Substances Emergency Events Surveillance (HSEES) system. Am J Ind Med 47:419-427.
Kaye WE, Orr MF, Wattigney WA. Surveillance of Hazardous Substances Emergency Events: identifying areas for public health prevention. Int J Hyg Environ Health 208(2005):37-44.
2004
Berkowitz Z, Horton DK, Kaye WE. Hazardous substances releases causing fatalities and/or people transported to hospitals: rural/agricultural vs. other areas. Prehospital Disaster Med 2004;19(3):213-20.
Centers for Disease Control and Prevention (CDC). Brief report: exposure to tear gas from a theft-deterrent device on a safe-Wisconsin, December 2003. MMWR 2004;53:176-7.
Horton DK, Berkowitz Z, Kaye WE. Hydrofluoric acid releases in 17 states and the acute health effects associated, 1993-2001. J Occup Environ Med 2004;46:501-8.
Centers for Disease Control and Prevention (CDC). Brief report: Injuries associated with homemade fireworks-selected states, 1993-2004. MMWR. 2004;53(25):562-3.
Horton DK, Berkowitz Z, Kaye WE. Surveillance of hazardous materials events in 17 states, 1993-2001: a report from the Hazardous Substances Emergency Events Surveillance (HSEES) system. Am J Ind Med 2004;45:539-48.
Centers for Disease Control and Prevention (CDC). Carbon monoxide releases and poisonings attributed to underground utility cable fires-New York, January 2000-December 2003. MMWR 2004;53:920-2.
Ruckart PZ, Borders J, Villanacci J, Harris R, Samples-Ruiz M. The role of adverse weather conditions in acute releases of hazardous substances, Texas, 2000-2001. J Hazard Mater 2004;115:27-31.
Ruckart PZ, Wattigney W, Kaye WE. Risk factors for acute chemical releases with public health consequences: Hazardous Substances Emergency Events Surveillance in the U.S., 1996-2001. Environ Health 2004;3(1):10.
Ruckart PZ, Orr MF, Kaye WE. Hazardous chemical releases in the home. J Environ Health 2004;67(5):14-9.v
2003
Berkowitz Z, Barnhart HX, Kaye WE. Factors associated with severity of injury resulting from acute releases of hazardous substances in the manufacturing industry. J Occup Environ Med 2003;45:734-42.
Centers for Disease Control and Prevention (CDC). Homemade chemical bomb events and resulting injuries-selected states, January 1996-March 2003. MMWR 2003;52:662-4.
Horton DK, Berkowitz Z, Kaye WE. The acute consequences to children exposed to hazardous substances used in illicit methamphetamine production, 1996 to 2001. J Child Health 2003;1:99-108.
Horton DK, Berkowitz Z, Kaye WE. Secondary contamination of ED personnel from hazardous materials events, 1995-2001. Am J Emerg Med 2003;21:199-204.
Horton DK, Berkowitz Z, Haugh GS, Orr MF, Kaye WE. Acute public health consequences associated with hazardous substances released during transit, 1993-2000. J Hazard Mater 2003;B98:161-75.
Manassaram DM, Orr MF, Kaye WE. Hazardous substances events associated with the manufacturing of chemicals and allied products. J Hazard Mater 2003;104:123-35.
Manassaram DM, Orr MF, Kaye WE. Counterterrorism planning using the hazardous substances events surveillance system. Disaster Manag Response 2003;1:35-40.
Weisskopf MG, Drew JM, Hanrahan LP, Anderson HA, Haugh GS. Hazardous ammonia releases: public health consequences and risk factors for evacuation and injury, United States, 1993-1998. J Occup Environ Med 2003;45(2):197-204.
2002
Berkowitz Z, Haugh GS, Orr MF, Kaye WE. Releases of hazardous substances in schools: data from Hazardous Substances Emergency Events Surveillance system, 1993-1998. J Environ Health 2002;65:20-7.
Berkowitz Z, Orr MF, Kaye WE, Haugh GS. Adverse public health effects associated with releases of hazardous substances in the agricultural industry and related services in four mid-Western states. J Occup Environ Med 2002;44:714-23.v
Horton DK, Berkowitz Z, Kaye WE. The public health consequences from acute chlorine releases, 1993-2000. J Occup Environ Med 2002;44:906-13.
Zeitz P, Orr MF, Kaye WE. Public health consequences of mercury spills: Hazardous Substances Emergency Events Surveillance System: 1993-1998. Environ Health Perspect 2002;110:129-32.
2001
Burgess JL, Kovalchick DF, Harter L, Kyes KB, Lymp JF, Brodkin CA. Hazardous materials events: evaluation of transport to health care facility and evacuation decisions. Am J Emerg Med 2001;19:99-105. Orr MF, Kaye WE, Zeitz P, Powers ME, Rosenthal L. Public health risks of railroad hazardous substance emergency events. J Occup Environ Med 2001;43:94-100. Orr MF, Haugh GS, Kaye WE. Hazardous Substances Emergency Events Surveillance (HSEES), 1993 to 1997. Chemical Health and Safety 2001;35-41. Welles WL, Wilburn RE. Hazardous Substances Emergency Events Surveillance (HSEES) in New York State, 1993 to 1997. Chemical Health and Safety 2001;42-52.2000
Burgess JL, Kovalchick DF, Harter L, Kyes KB, Thompson JN. Hazardous materials events: an industrial comparison. J Occup Environ Med 2000;42:546-53.
Centers for Disease Control and Prevention (CDC). Public health consequences among first responders to emergency events associated with illicit methamphetamine laboratories-selected states, 1996-1999. MMWR 2000;49:1021-4.
Souther L, Small-Johnson J, Messing RB. A description of agricultural releases of anhydrous ammonia in Minnesota. Chemical Health and Safety 2000;16-22.
Weisskopf MG, Drew JM, Hanrahan LP, Anderson HA. Hazardous ammonia releases in Wisconsin: trends and risk factors for evacuation and injury. Wisc Med J 2000;30-46.
Zeitz P, Berkowitz Z, Orr MF, Haugh GS, Kaye WE. Frequency and type of injuries in responders of hazardous substances emergency events, 1996 to 1998. J Occup Environ Med 2000;42:1115-20.
1996
Hall HI, Dhara VR, Kaye WE, Price-Green PA. Public health consequences of hazardous substance releases. Toxicol Ind Health 1996;12:289-93.
Hall HI, Haugh GS, Price-Green PA, Dhara VR, Kaye WE. Risk factors for hazardous substance releases that result in injuries and evacuations: data from 9 states. Am J Public Health 1996;86:855-7.
Wendt RD, Hall HI, Price-Green PA, Dhara VR, Kaye WE. Evaluating the sensitivity of hazardous substances emergency events surveillance: a comparison of three surveillance systems. J Environ Health 1996;58:13-7.
1995
Agency for Toxic Substances and Disease Registry. ATSDR update: Hazardous Substances Emergency Events Surveillance (HSEES) system: 1993 data. Health and Environment Digest 1995;8:83-4.
Hall HI, Price-Green PA, Dhara VR, Kaye WE. Health effects related to releases of hazardous substances on the Superfund priority list. Chemosphere 1995;31:2455-61.
1994
Hall HI, Dhara VR, Price-Green PA, Kaye WE. Surveillance for emergency events involving hazardous substances-United States, 1990-1992. MMWR 1994;43(No. SS-2):1-6.
Hall HI, Dhara VR, Kaye WE, Price-Green PA. Surveillance of hazardous substance releases and related health effects. Arch Environ Health 1994;49:45-8.
Other HSEES documents available:
1993 through 1997 Annual Report | PDF Version,
1831KB
1995 Annual Report | PDF Version, 141KB
1996 Annual Report | PDF Version, 157KB
1997 Annual Report | PDF Version,
1822KB
1998 Annual Report | PDF Version,
6905KB
1998 through 2001 Annual Report | PDF Version,
355KB
1999-2000 Biennial Report | PDF Version,
13404KB
2001 Annual Report | PDF Version, 848KB
2002 Annual Report | PDF Version, 3441KB
2003 Annual Report | PDF Version, 1208KB
2004 Annual Report | PDF Version, 475KB
Agency for Toxic Substances and Disease Registry, 4770 Buford Hwy NE, Atlanta, GA 30341
Tel: (404) 498-0110 / Public Inquiries: (888) 422-8737