PFAS in the U.S. Population

Most people in the United States have been exposed to PFAS and have PFAS in their blood.
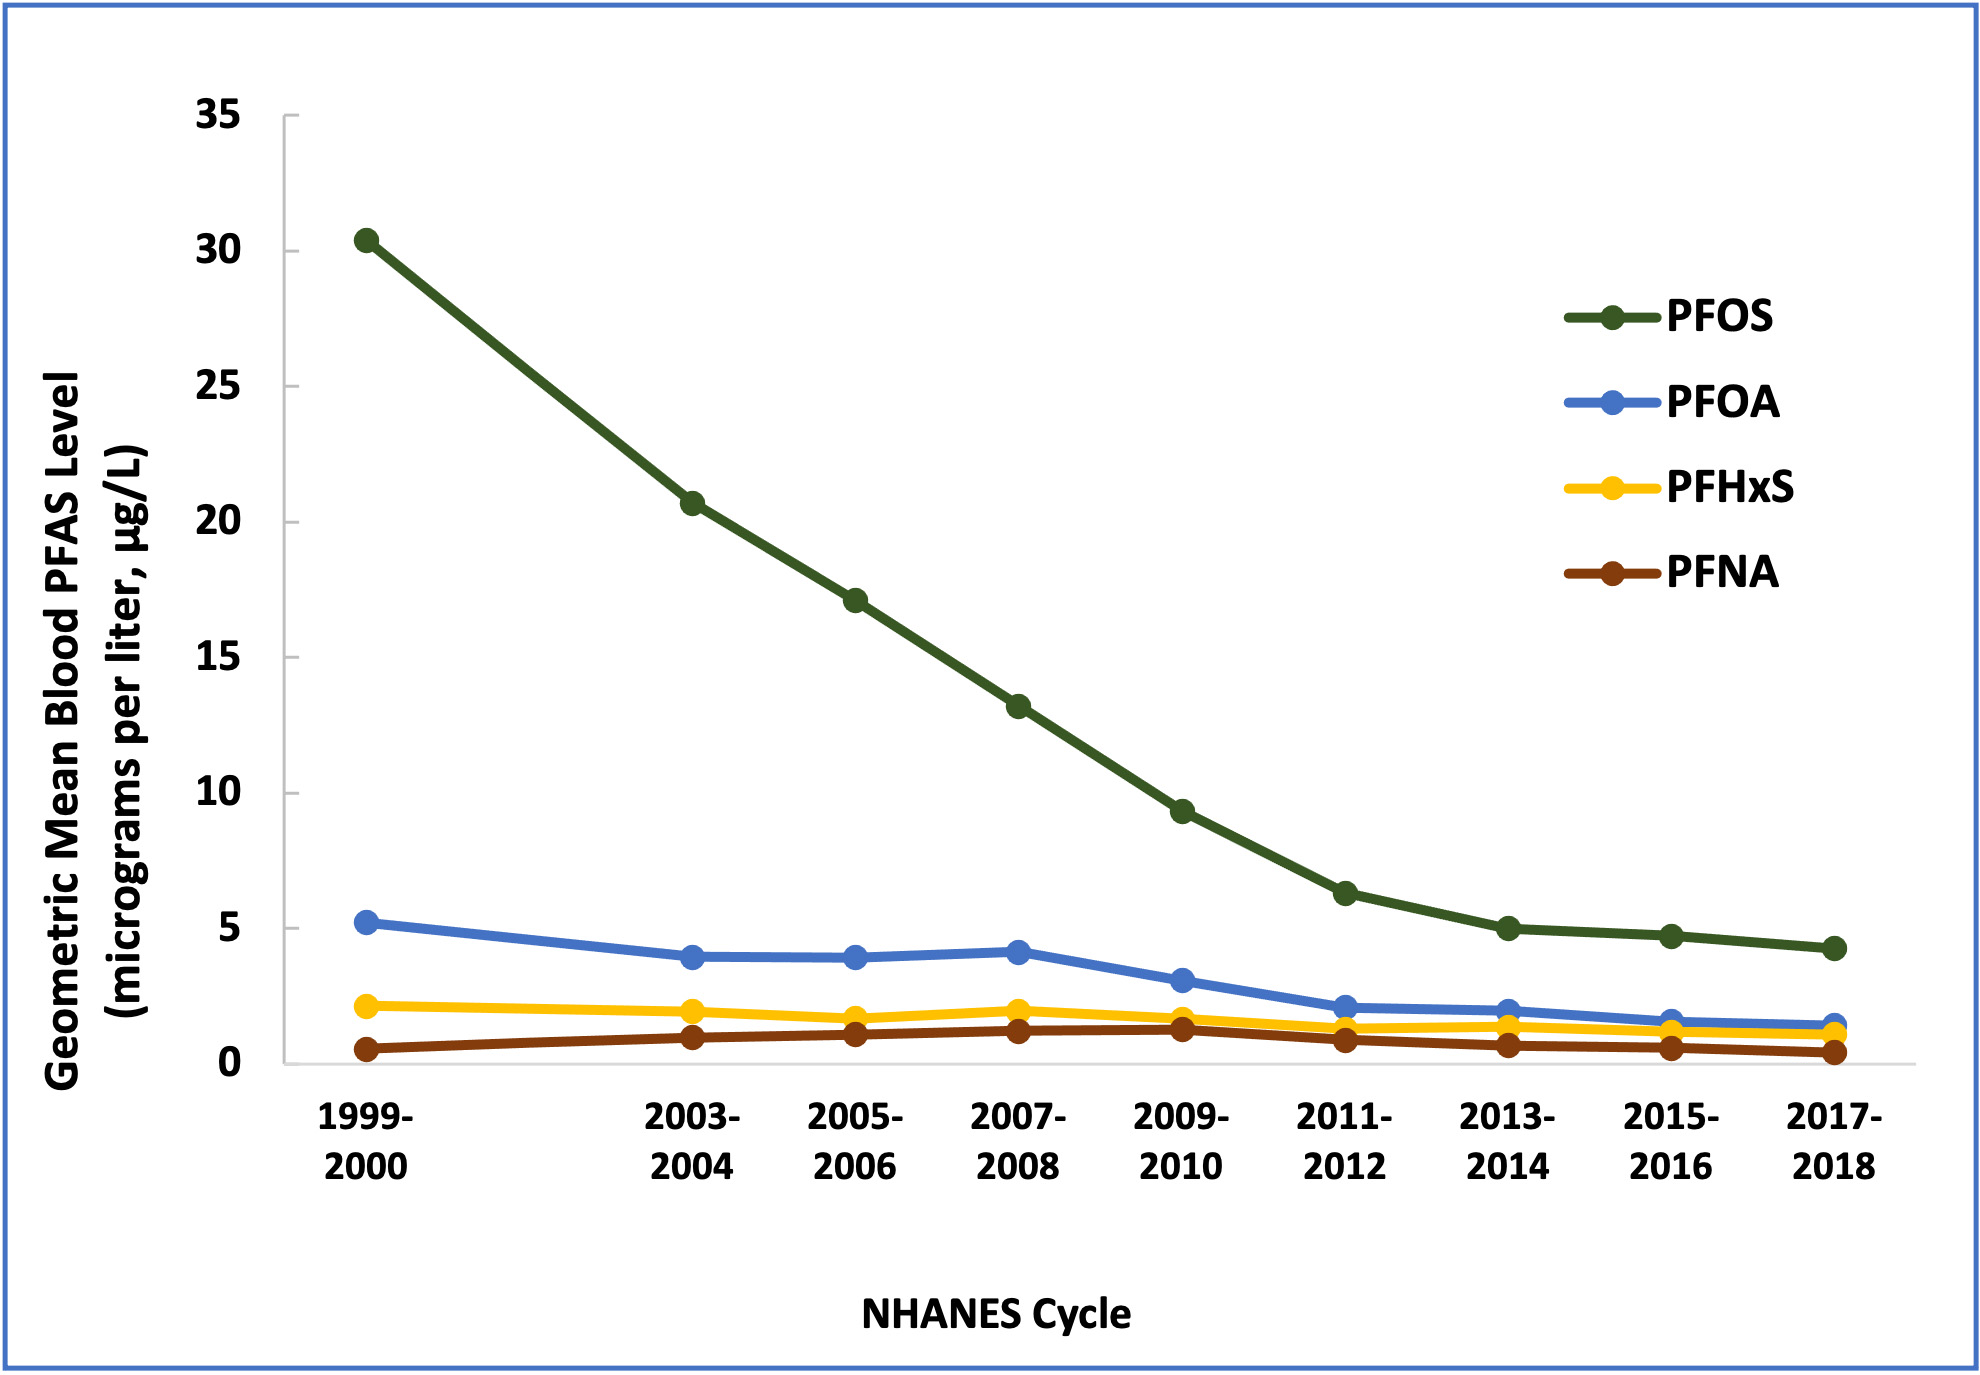
The National Health and Nutrition Examination Survey (NHANES) has measured PFAS-levels in blood in the U.S. population since 1999. NHANES is a program of studies designed by the Centers for Disease Control and Prevention (CDC) to evaluate the health and nutrition of adults and children in the United States. NHANES data are publicly released in 2-year cycles.
Since 2002, the production and use of PFOS and PFOA in the United States has declined. As the use of some PFAS have declined, some blood PFAS levels have gone down as well.
- From 1999-2000 to 2017-2018, blood PFOS levels declined by more than 85%.
- From 1999-2000 to 2017-2018, blood PFOA levels declined by more than 70%.
However, as PFOS and PFOA are phased out and replaced, people may be exposed to other PFAS.
Biomonitoring Studies
Biomonitoring studies have measured PFAS levels in other groups including:
- Workers in PFAS manufacturing facilities
- Communities with contaminated drinking water
- The general U.S. population

Data Source
Centers for Disease Control and Prevention. National Report on Human Exposure to Environmental Chemicals, Biomonitoring Data Tables for Environmental Chemicals. Atlanta, GA: U.S. Department of Health and Human Services, Centers for Disease Control and Prevention.
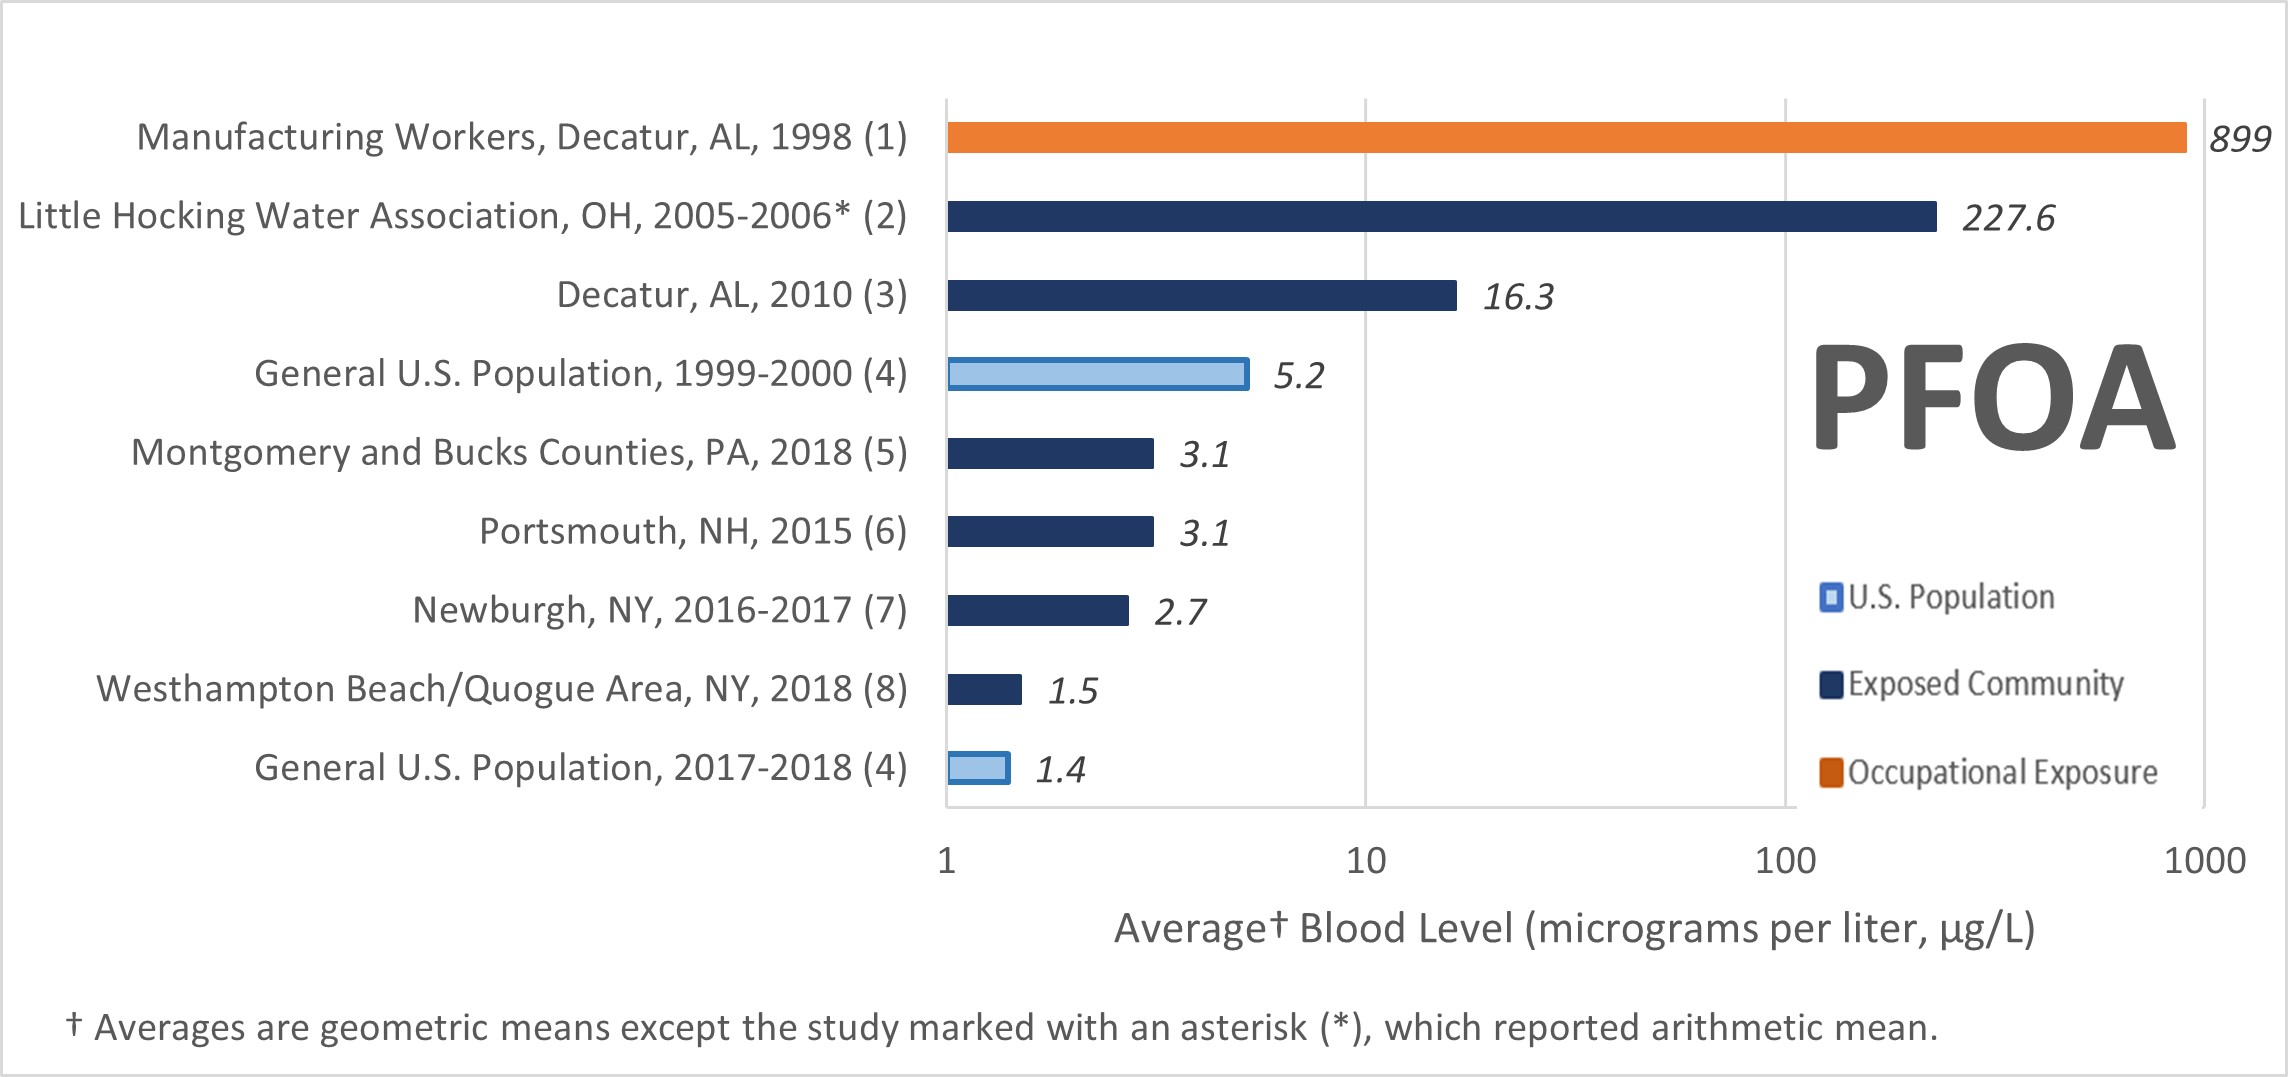
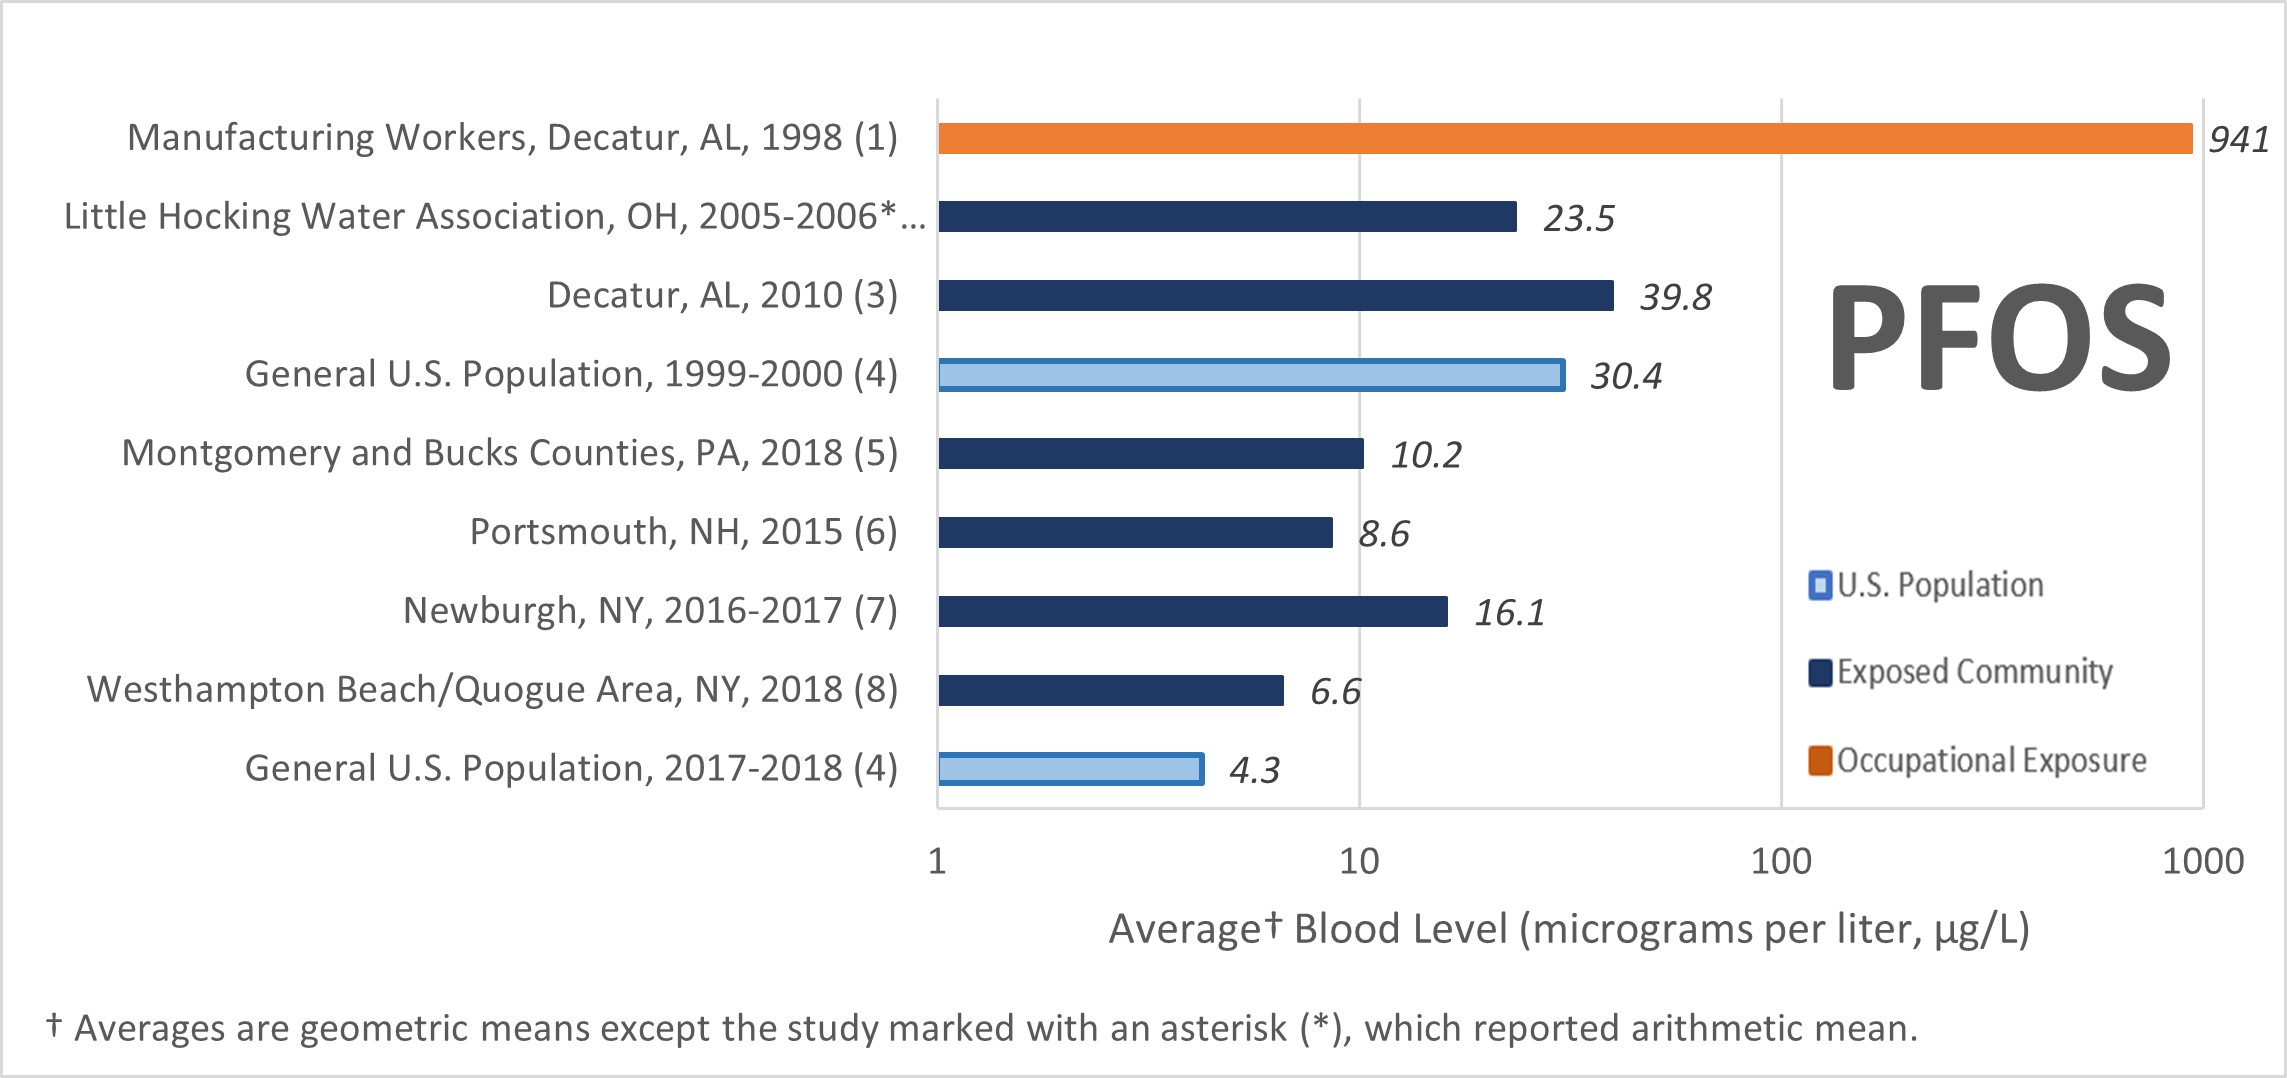
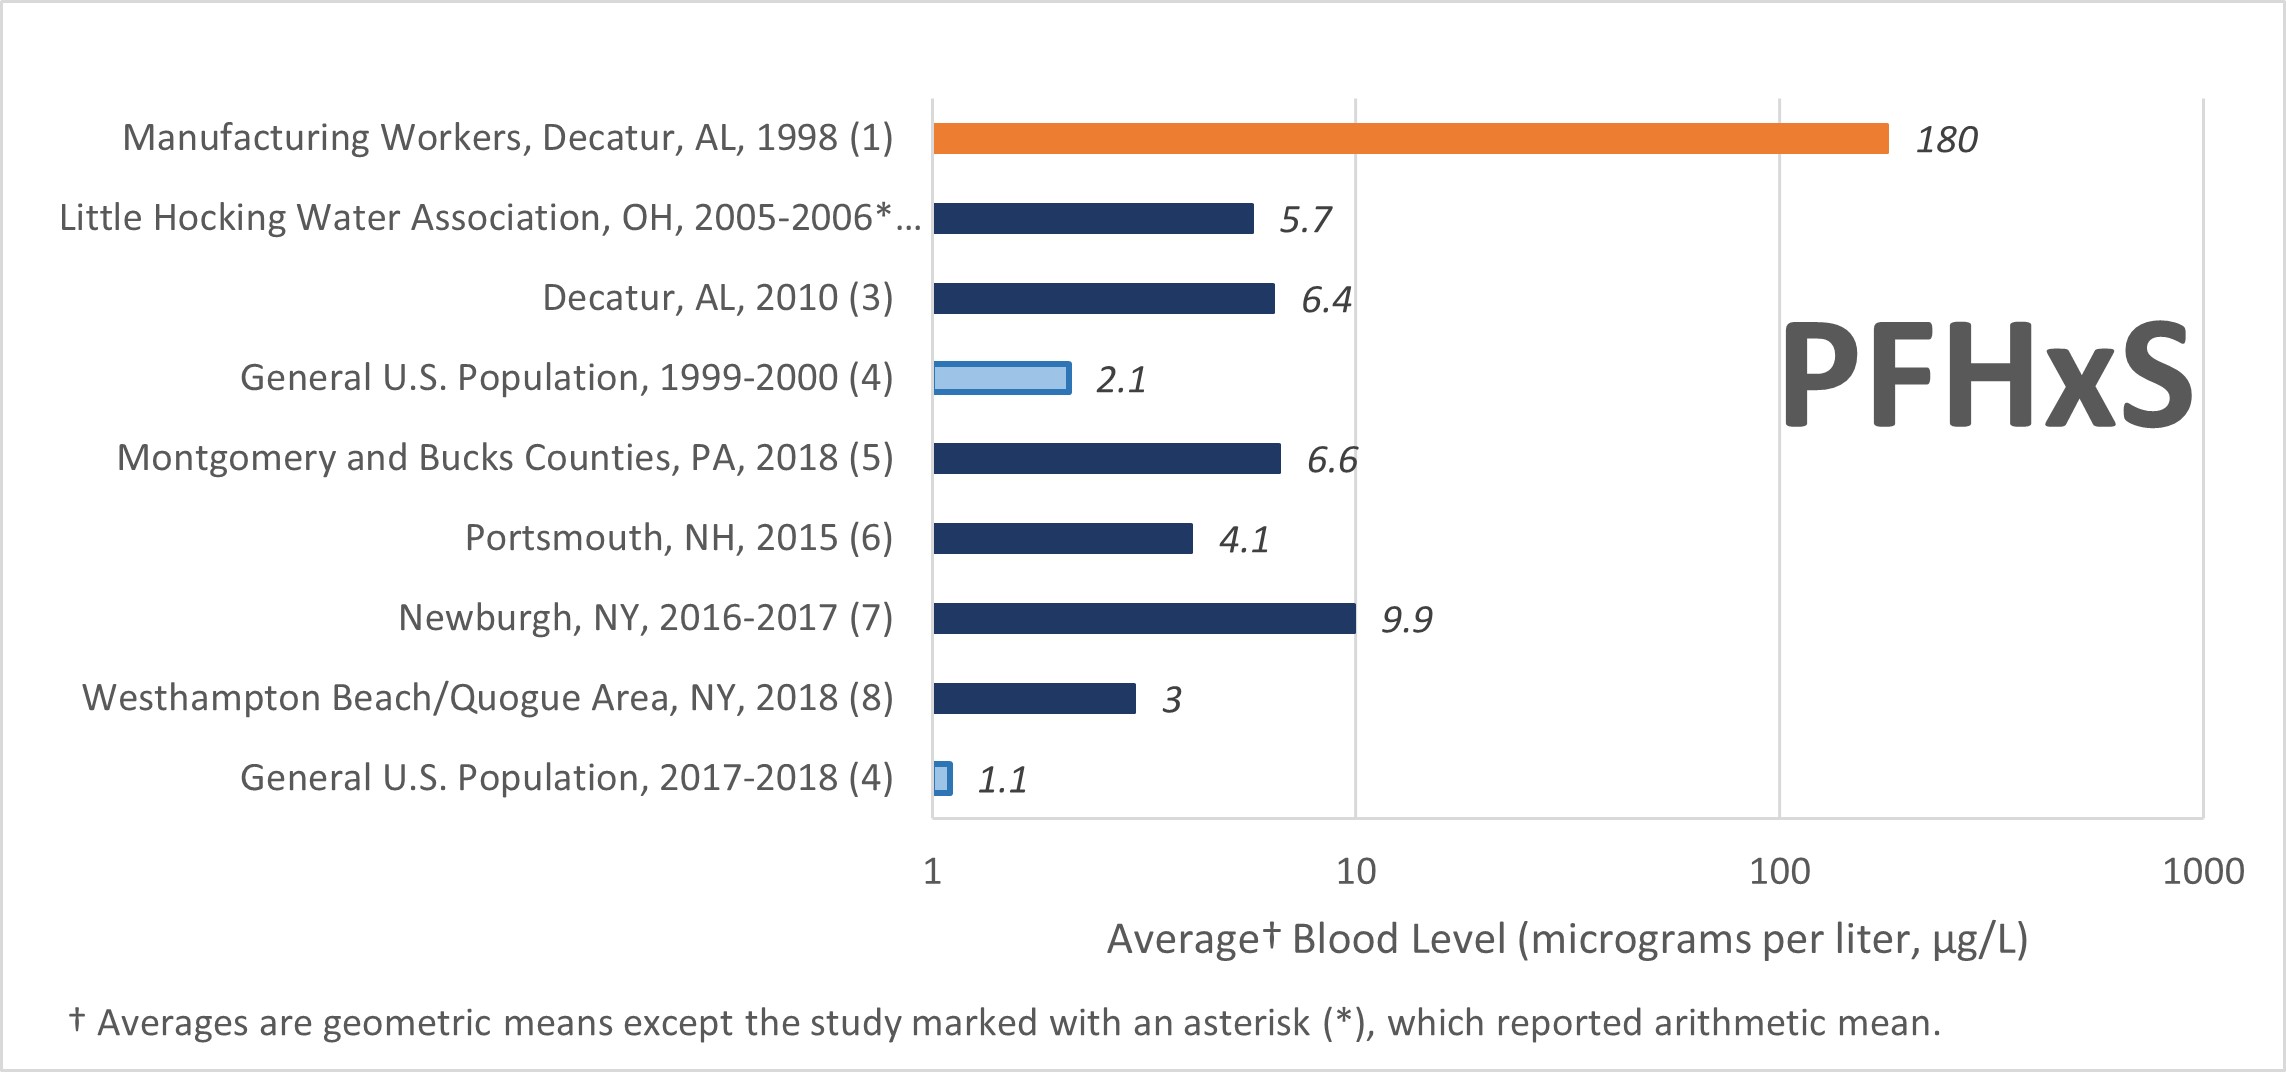
The figures below show PFOA, PFOS, and PFHxS blood levels measured in different exposed populations, compared to levels CDC measured in the general U.S. population in 1999-2000, 2015-2016, and 2017-2018. ATSDR biomonitoring information is also available through PFAS exposure assessments.

References and Data Sources
- G.W. Olsen, et al., 2003. https://www.tandfonline.com/doi/pdf/10.1080/15428110308984859?needAccess=true
- Frisbee, et al., 2005/2006. https://ehp.niehs.nih.gov/doi/pdf/10.1289/ehp.0800379
- Agency for Toxic Substances and Disease Registry, 2010. https://www.atsdr.cdc.gov/HAC/pha/Decatur/Perfluorochemical_Serum%20Sampling.pdf
- Centers for Disease Control, NHANES, 1999-2018. https://www.cdc.gov/exposurereport/data_tables.html
- Pennsylvania Department of Health, 2019. https://www.health.pa.gov/topics/Documents/Environmental%20Health/PEATT%20Pilot%20Project%20Final%20Report%20April%2029%202019.pdf
- New Hampshire Department of Health and Human Services, 2015. https://www.dhhs.nh.gov/sites/g/files/ehbemt476/files/documents/2021-11/pease-pfc-blood-testing.pdf
- New York Department of Health, 2016/2017. https://www.health.ny.gov/environmental/investigations/newburgh/docs/infosheetgroupresults.pdf
- New York Department of Health, 2018. https://www.health.ny.gov/environmental/investigations/drinkingwaterresponse/docs/westhampton_quogue_group_level_blood_testing
For more information about PFAS visit:
ATSDR: https://www.atsdr.cdc.gov/pfas/
EPA: https://www.epa.gov/chemical-research/research-and-polyfluoroalkyl-substances-pfas

