
CSPECE gives towns, cities, and states a framework to adopt practices that will make sure ECE progra...

Stories which highlight practical approaches and solutions that our states have used to protect chil...
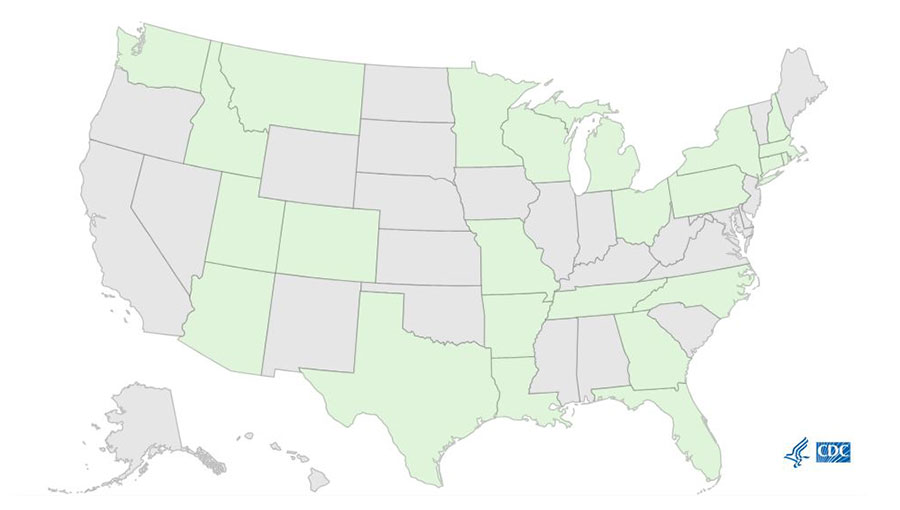
Interactive map of states funded for CSPECE and their program contacts.
Learn about the resources available to help you keep children in your community safe and healthy whe...
Why choose safe places?
Featured

Use these resources to learn more about CSPECE and to help keep children in your community safe.
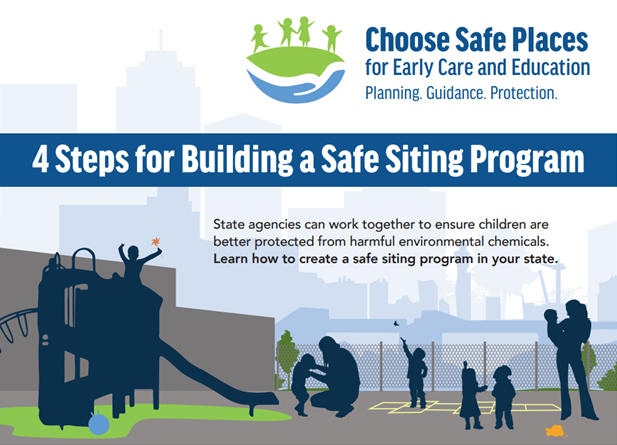
This infographic shows how state agencies can work together to ensure children are better protected...
Supplement that identifies potential environmental exposures to children during a disaster recovery.

Framework to adopt practices that will make sure ECE programs are away from chemical hazards.