Data Visualization and Interactive Mapping for Flu Surveillance
Influenza (flu) surveillance data is important to inform prevention efforts and control the spread and impact of flu across geographic locations. CDC receives a large amount of flu data from states, but the complex information can be difficult to interpret and identify trends. The Flu Division of the National Center for Immunization and Respiratory Diseases (NCIRD) stores flu data in FluView Interactive, the Division’s leading product for flu surveillance data. The Flu Division partners with the Geospatial Research, Analysis, and Services Program (GRASP) to enrich and expand FluView Interactive with greater analysis and interactive functions to improve users’ experience with the data.
| Interested? Check out the Flu View Interactive tool. | |
|
|
Public Health Impact: FluView Interactive targets areas for control efforts and tracked progress towards prevention goals, increases awareness of flu season, and promotes the importance of flu vaccines.
Partners: Influenza (Flu) Division, National Center for Immunization and Respiratory Diseases Geospatial Expertise Provided: Data visualization, interactive mapping, and geographic information systems (GIS) |
Interactive Flu Surveillance
FluView Interactive provides public health officials, scientists, healthcare providers, news media, and the general public with flu surveillance data in the form of maps and visualizations that are up-to-date and easy to understand. Any user can access flu information collected by CDC monitoring systems for a more in-depth exploration of flu patterns in time and space.
GRASP Provides Geospatial Expertise in Interactive Mapping
GRASP and the Flu Division established a partnership during the 2009 H1N1 flu pandemic. With expertise in data science, geospatial technology, and geographic information systems (GIS), GRASP set up a new data management structure and software that improved the Flu Division’s surveillance data and enabled users to explore data in five categories to understand the extent and severity of flu cases.
GRASP ensures FluView Interactive stays up-to-date with technology advancements so that the interactive maps, visualizations, and reports continue to be informative tools for both the scientific community and the general public. GRASP scientists and technologists design, build, and maintain web applications and widgets that validate and update the data each week. GRASP and the Flu Division continue to work together to increase the usability of flu surveillance data to inform and strengthen communities at risk.
Increasing Awareness of Flu Surveillance for Communities
FluView Interactive receives more than six million views per year and allows CDC to share flu data in a meaningful way. December and January have the highest number of views during peak flu season. Public health officials and scientists use FluView Interactive to more effectively target areas for control efforts and track progress towards prevention goals. Healthcare providers and news media are able to increase awareness of flu season and promote the importance of flu vaccines and other prevention practices, such as hand washing. The general public can access FluView Interactive to see the status of flu in their specific community, city, or state. The direct connection to flu data gives all users the tools to understand the unique characteristics of each flu season and take action in their communities.
Learn more about GRASP.
Influenza (flu) is a contagious respiratory illness caused by flu viruses. It can cause mild to severe illness, and at times can lead to death. Some people are more likely to get flu complications, such as older people, young children, and people with certain health conditions.
Data visualization is a way of presenting complex ideas of place and health in a graphical form so that it is easier to understand and process.
Interactive Mapping allows users to select from a range of data layers and map features to create and view customized maps and visualizations of various public health data. Users can discern spatial patterns and relationships that increase understanding of health outcomes and risk factors in time and space.
FluView is a weekly flu surveillance report that helps public health partners and state and local health departments to visualize and track flu activity in the U.S.
FluView Interactive is a series of dynamic visualizations that allow any Internet user to access flu information collected by CDC’s monitoring systems.
U.S. Influenza Surveillance System collects, compiles and analyzes information on flu activity year-round in the United States. It is a collaborative effort between CDC and its partners in state, local, and territorial health departments, public health and clinical laboratories, vital statistics offices, healthcare providers, clinics, and emergency departments. The system is managed by CDC’s Flu Division.
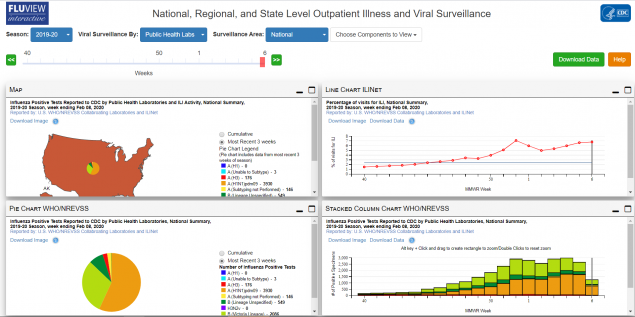
FluView Interactive Dashboard

48.8 million
Number of people in the U.S. who had flu in 2017/2018 flu season
6.4 million
Number of FluView Interactive page views in FY2018
December & January
Months with highest number of views for FluView Interactive
