Mapping SARS-CoV-2 Seroprevalence Reveals Health Disparities
During the height of the COVID-19 pandemic in 2020, public health officials had trouble evaluating the total number of people infected with the SARS-CoV-2 virus. Test supplies were limited, and people would typically get tested for COVID-19 only when they had severe symptoms. As a result, many communities with high infection rates experienced continued spreading of the virus with limited detection.
The Geospatial Research, Analysis, and Services Program (GRASP), the CDC COVID-19 Response Epidemiology Task Force, and the COVID-19 Response Chief Health Equity Office (CHEO) used a dataset containing over 1.5 million nationwide SARS-CoV-2 seroprevalence (antibody) samples to reveal a more complete picture of nationwide SARS-CoV-2 infection trends and health disparities.
As part of routine blood screening for infectious diseases, donation centers added screening for SARS-CoV-2 antibodies to their standard blood panels. Researchers realized that they could use blood donors’ antibody data to better understand the prevalence of SARS-CoV-2 infection.
Using Geospatial Technology to Prepare Dataset for Mapping
GRASP worked closely with Jefferson Jones, MD, in the Coronavirus and Other Respiratory Viruses Division of the National Center for Immunization and Respiratory Diseases and the Seroprevalence Team within the CDC COVID-19 Response Epidemiology Task Force, to map nationwide, region-specific SARS-CoV-2 antibody prevalence blood samples from 1.5 million blood donations. The samples came from 17 different blood collection centers across the United States and Puerto Rico. They were collected between July 2020 and July 2021. The samples were collected as part of the Multistate Assessment of SARS-CoV-2 Seroprevalence in Donors (MASS-D) study.
An initial challenge for GRASP was that the seroprevalence dataset was only available at the zip code level. The team would need county-level data if they wanted to investigate the relationship between seroprevalence and social vulnerability. To further complicate matters, donation zip codes can cross county and state boundaries, and zip code representation within counties varies significantly. As part of the research process, GRASP developed geographical inclusion criteria that assigned blood donor zip codes to their respective U.S. counties.
This MASS-D data was first visualized by GRASP for inclusion in the Jones et al. article Estimated US Infection- and Vaccine-Induced SARS-CoV-2 Seroprevalence Based on Blood Donations, July 2020-May 2021, and later developed by the Seroprevalence Team and the Georgia Tech Research Institute (GTRI), in collaboration with the GRASP COVID Data Tracker team, as visualizations on the COVID Data Tracker’s interactive mapping application.
Mapping Nationwide Seroprevalence to Investigate Health Disparities
In a follow-on study using the updated dataset from the MASS-D study, GRASP, in collaboration with Zheng (Jane) Li, PhD, from ATSDR while deployed to the COVID-19 Response CHEO and other members from CHEO and Epidemiology Task Force, looked at the relationship between nationwide SARS-CoV-2 seroprevalence and the CDC/ATSDR Social Vulnerability Index (CDC/ATSDR SVI) to improve our understanding about which areas are experiencing potential health disparities during the COVID-19 pandemic.
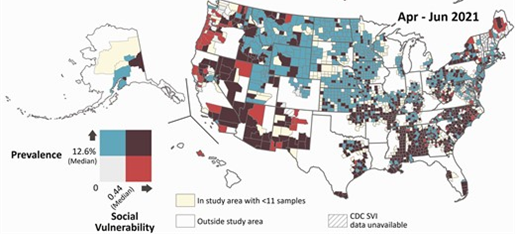
Study findings are visualized by bivariate choropleth maps, that is maps which use intensity of color to depict combinations of two variables. In this case U.S. county-level combinations of social vulnerability and SARS-CoV-2 seroprevalence.
Using these linked datasets, the group published Social Vulnerability and Rurality Associated With Higher Severe Acute Respiratory Syndrome Coronavirus 2 (SARS-CoV-2) Infection–Induced Seroprevalence: A Nationwide Blood Donor Study—United States, July 2020–June 2021 in the Journal of Clinical Infectious Diseases. The article highlights how future vaccination strategies must consider social vulnerability to reduce health disparities and prepare for future outbreaks.

This map shows data from April to June 2021. The blue areas show high seroprevalence, the red areas high social vulnerability and the dark brown a combination of both highlighting areas that should receive special attention for vaccination interventions. It is one of the four maps published in the Li et al. article.
Geospatial methods are a powerful tool for public health
The GRASP Team, COVID-19 Response Seroprevalence Team, and COVID-19 Response CHEO explored nationwide SARS-CoV-2 infection trends and health disparities. Their work highlights how geospatial methods can be used to help identify areas for targeted vaccination strategies. Additionally, their research can be used to help reduce inequities, inform mitigation or prevention efforts, and prepare for future outbreaks.
GRASP’s geospatial epidemiology work aims to improve public health by empowering practitioners and public health authorities. GRASP’s work can be used to inform public health interventions, prevention programs, and policy. Drawing from a wide range of public health knowledge and combining geospatial problem-solving skills, GRASP continues to be a valuable partner in epidemiological research.