Explore the GRASP vision & mission and discover GRASP work at the intersection of place and health
Discover GRASP work at the intersection of place and health spanning science, technology and more.
Catch up with GRASP news, announcements, publications, meetings, and data & application releases.
Explore the tools and training hub to access training materials offered by GRASP.
GRASP Index Portfolio
Learn about the social and environmental factors affecting your community’s health and well-being.
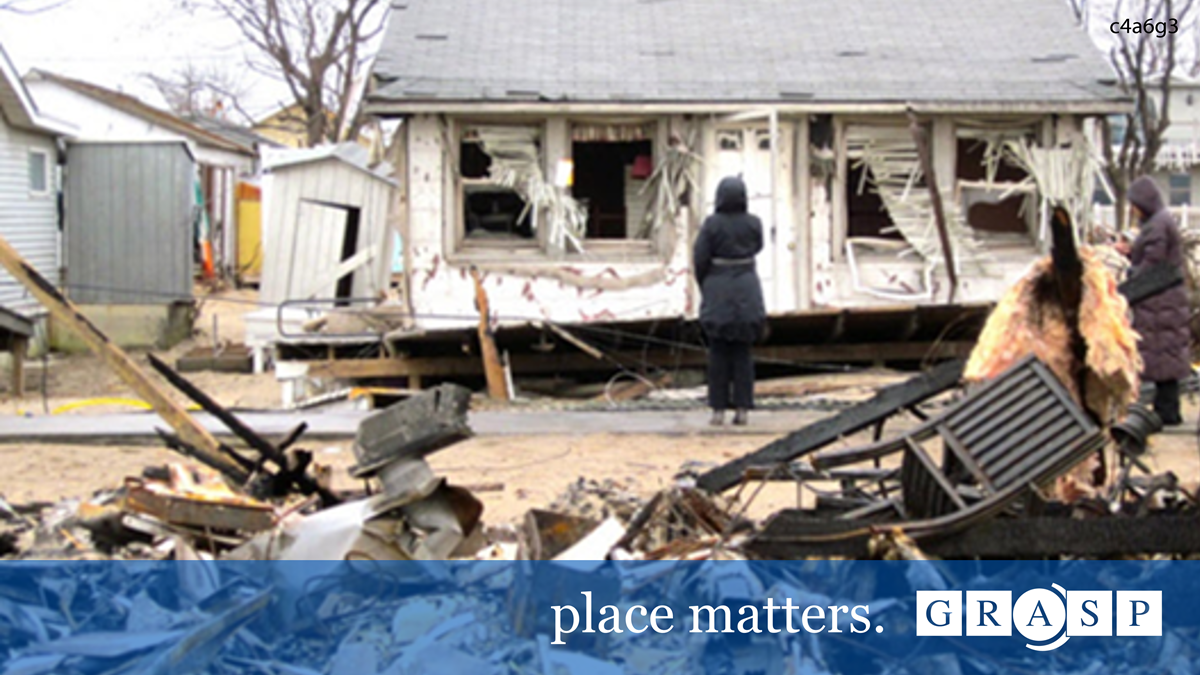
Identify and assist socially vulnerable populations before, during, and after emergency events.
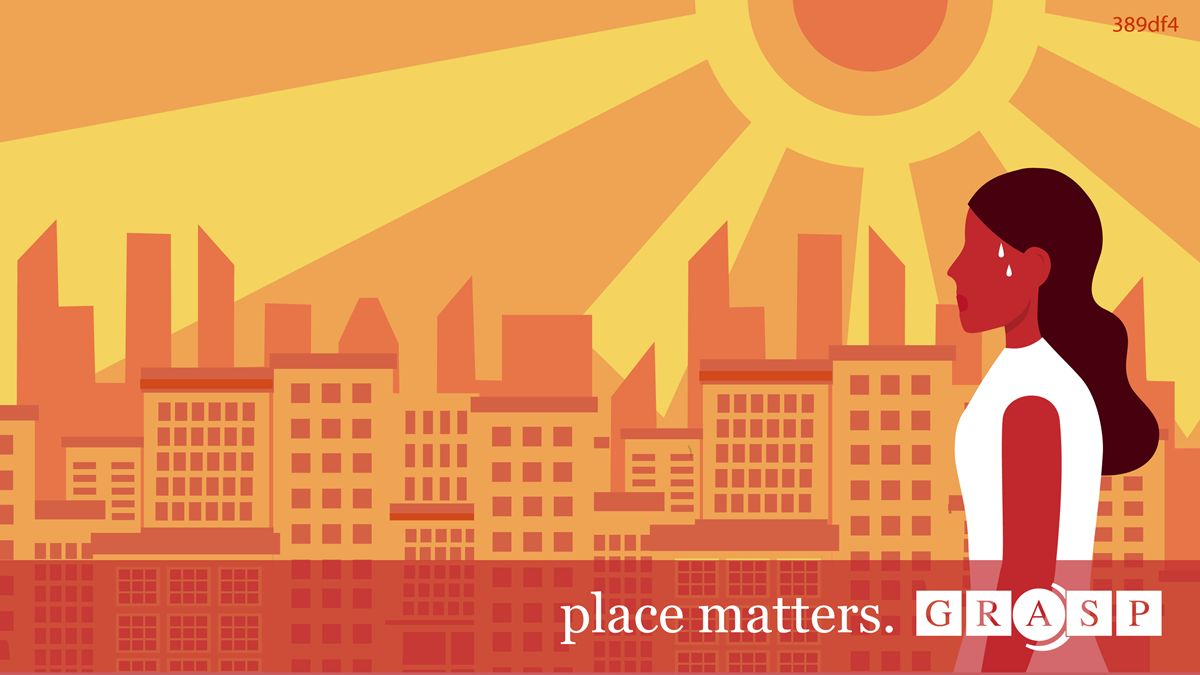
Explore communities where people are most likely to feel the impacts of heat.
GRASP work at the intersection of place & health
Discover GRASP work at the intersection of place and health spanning science, technology and more.

Collaborate with GRASP to advance solutions at the intersection of place and health.
- Explore how geospatial science and technology addresses public health challenges.
- Learn more about how geospatial science and technology advances public health research and practice.
- Learn more about GRASP's portfolio of geospatial applications.