Map Gallery
Using High Resolution Satellite Imagery & GIS Technology to Strengthen Microplans–Perception and Accurate Mapping
Publication Date: 2019
Author: Kaplan, B
CDC supported the World Health Organization’s (WHO) 2019 pilot to evaluate the use of high-resolution satellite imagery and GIS technologies to strengthen polio immunization microplanning. GRASP prepared maps of 46 local level governments in Central and Morobe Provinces using existing public data of health facilities, villages, boundaries and roads. Health officials digitized 1,365 health facilities as points, 106 health facility catchment areas, 477 team areas as polygons, and referenced hand drawn maps that provided an added level of detail.
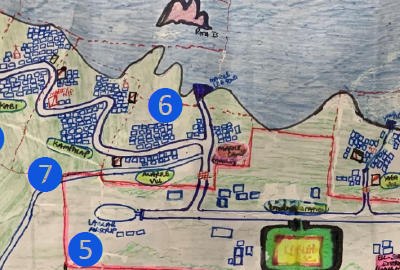
Four figures of map panels and/or data visualizations appear on this poster. Figure 1 is a hand drawn map that covers the Papua New Guinea (PNG) Lablab Health Center and catchment area. Figure 2 is a GIS generated map of PNG with Lablab Health Center as the focal point, as well as Sakar Island and its aid post, Malai Island and aid post in opposite directions of the GIS map compared to the hand drawn map. The Tongso Village is located close to the LabLab Health Center in both maps. The distance in the hand drawn map between the Lablab Health Center and the Tongso Village location is not too different than the distance from the Lablab Health Center to Sakar and Malia Islands in the hand drawn map. Sakar and Malia Islands are actually 33 and 23 km away from the health center while Tongso Village is 0.8 km away. The hand drawn map shows additional scale and direction issues with the villages of Marile, Kampalap, and Kabi, and the airstrip. Figure 3 is a close-up satellite image of Lablab Village and surrounding area that includes the airstrip and Tsongo/Tsongo public school. Figure 4 is an overview map with an arrow pointing to PNG indicating the area of detail within the region.
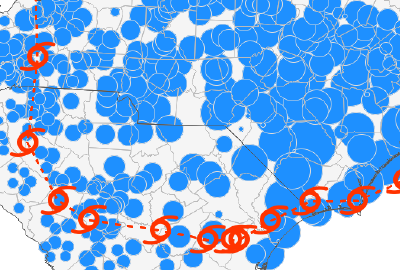
Geospatial Analysis of Pharmacy Functionality during the 2018 Hurricane Florence disaster
Publication Date: 2019
Author: Sharpe, D, Clennon, J
GRASP conducted an analysis of the distribution of pharmacies that were in operation before, during, and after Hurricane Florence to better understand the extent to which pharmacies were affected in North and South Carolina (NC, SC) counties eligible for individual assistance under FEMA Disaster Declarations. GRASP analysts computed operating pharmacy capacity using GeoDa to calculate Getis-Ord Gi*(d) statistics. They found that spatially, coastal counties had the worst operating pharmacy capacity, and temporally, disaster preparedness and recovery efforts of pharmacies in NC and SC were adequate, yet disaster response efforts were suboptimal.
Four figures of map panels and/or data visualizations appear on this poster. From left to right, Figure 1 is a map of North and South Carolina describing Hurricane Florence’s path and total precipitation from September 14-18, 2018, which moves south and then east across the two states. Figure 2 is a map of North and South Carolina that highlights counties eligible for FEMA individual assistance mostly along the southeast coast of North Carolina and northeast part of South Carolina from September 12-20, 2018. Figure 3 is a map series from September 12-20, 2018 that illustrates the Operating Pharmacy Capacity (OPC) before, during, and after Hurricane Florence for North and South Carolina counties eligible for FEMA individual assistance. Figure 4 is a map series from September 12-20, 2018 that shows clusters of OPC before, during, and after Hurricane Florence for North and South Carolina counties eligible for FEMA individual assistance. Both Figures 3 and 4 show how spatially, coastal counties in the Hurricane Florence-impacted area had the worst operating pharmacy capacity.
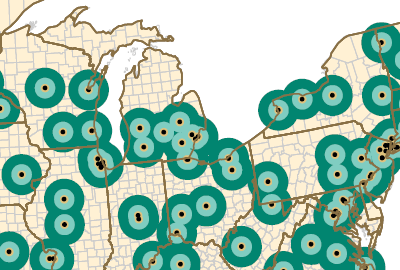
A Comparison of Methods to Change Spatial Scale
Publication Date: 2017
Authors: Hallisey, E, Tai, E, Berens, E, Wilt, G, Peipins, L, Lewis, B, Graham, S, Flanagan, B, Lunsford, N
GRASP supported the Georgia Department of Public Health’s efforts to understand the association between geographic barriers to pediatric cancer facilities and mortality rates among adolescents with cancer between 1999 and 2011. GRASP analysts used their own Population Estimator tool with U.S. Census data (2000 and 2010) and National Center for Health Statistics data (1999-2011) to explore five methods to estimate adolescent cancer mortality rates for each of four zones surrounding Children’s Oncology Group facilities. They found that Combined Population and Areal Weighting, compared to other areal interpolation methods examined, return the most accurate estimates of mortality in transforming small counts by county to aggregated counts for large, non-standard enumeration zones.
Ten figures of map panels and/or data visualizations appear on this poster within five separate panels. In the Background panel, from left to right, Figure 1 is a map of the US, with buffers, or areas surrounding each of the 191 Children’s Oncology Group (COG) facilities combined so that all locations in the U.S are assigned to one of four zones: Zone A is 0 to 10 miles in distance from a COG, Zone B is >10 to 25 miles from a COG, Zone C is >25 to 50 miles from a COG, and Zone D is more than 50 miles from a COG. The image also highlights the state of Georgia to indicate data used for validation. Figure 2 is a map of the metro Atlanta region in Georgia with points indicating the residences of adolescents whose underlying cause of death is cancer. The map distinguishes between deaths that fall within or outside a Zone B buffer. The points within the buffer were counted to obtain the observed number of deaths that occurred between 10 and 25 miles of a COG (n=71).
In the Methods panel from top to bottom, Figure 3 is a map of the metro Atlanta region with an accompanying table to explain denominator (population) estimation (ie, the area of overlap of the census tract (source zone) with the study zone surrounding a COG (target zone) was divided by the area of the entire tract to obtain the proportion, or weight, of the tract area within the target zone. The population of interest for each source zone was then multiplied by the areal weight for that source zone. The resulting population proportions were summed to estimate a population total for the target zone for census years 2000 and 2010. We then calculated a weighted sum to estimate a total 13-year population for the denominator to match the 1999-2011 numerator’s mortality data time range. This process was repeated for each of the four study zones.). The population for those aged 15 through 19 for each tract (Pt) is multiplied by the proportion of the tract, or areal weight (Azt / At), in the study zone. The output for each tract (Ept) in the entire zone is summed to obtain a population estimate for the study zone. Note: For graphic simplicity, only a subset of zones are shown in the figures. Methods are the same for each of the four study zones, A, B, C, and D. Figure 4 is a map of metro Atlanta demonstrating Method 1: Geographic Centroid Assignment, in which each county centroid is attributed a county mortality count for the population of interest. Mortality counts for centroids falling within each study zone are summed to estimate mortality, as a whole number, by zone. This hypothetical example shows Zones A and B assigned zero deaths, despite the overlap of three counties on Zone A (two potential deaths) and five on Zone B (four potential deaths). Zone C is assigned four deaths but has the possibility of more. Figure 5 is a map of metro Atlanta demonstrating Method 2: Population-Weighted Centroid Assignment, in which Each tract centroid is attributed the population of interest. County centroids are placed using the mean center of tract centroids weighted by the tract population. Mortality counts for centroids falling within each zone are summed to estimate mortality by zone. Results for Zones A and B in this example, zero deaths for both, are the same as those for geographic centroid assignment. Zone C is assigned five deaths because the centroid in the northeast, with a value of “1,” is now positioned within zone C. Figure 6 is a map and accompanying table of metro Atlanta demonstrating Method 3: Simple Areal Weighting, in which the same technique is used for the denominator estimates. In this case, the area of overlap of the county (source zone) with the study zone surrounding a COG (target zone) was divided by the area of the entire county to obtain the proportion, or areal weight, of the county area within the study zone. The number of deaths for each county was then multiplied by the corresponding areal weight for that source zone. The resulting mortality count estimates were summed to estimate number of deaths for each of the four study zones, A, B, C, and D.
In the Methods (con’t) panel, Figure 7 is a map and accompanying table demonstrating Method 4: Combined Population and Areal Weighting, which estimates how portions of Zones A and B are calculated by dividing the tract population by the county population, then multiplying by the number of deaths for the county to obtain a population-weighted mortality estimate for the tract. For each tract, this mortality estimate is multiplied by the proportion of the tract within the zone. The output for each tract is then summed to estimate deaths for the zone. Except for two counties, with two deaths each, the remaining counties in the area recorded zero deaths for the population of interest; counties with zero deaths were omitted from this illustration.
In the Results panel, from top to bottom, Figure 8 is two bar charts comparing the mortality by county in Georgia (mean = 1.50 deaths per county) with the mortality by county in the US (mean = 2.45 deaths per county), which indicates that the distribution of county mortality counts for Georgia mirror those of the US. Likewise, patterns of zone values are roughly similar for the state and the nation. Figure 9 is a data table presenting comparisons between observed 1999-2011 Georgia adolescent cancer mortality (rate per 100,000 per year) and estimated mortality, by method and zone. Figure 10 is a data table comparing the Denominator – Census Tract Source Zones with the Numerator – County Source Zones to present the degree of hierarchy (nesting) and degree of fit (overlap) between source and target study zones and show that the higher the percentage, the better the estimate. Figure 10 presents five separate Bland-Altman plots to compare 1999-2011 Georgia adolescent mortality rate estimates to estimated rates for methods 1 through 5. Method 4 demonstrates the greatest agreement.
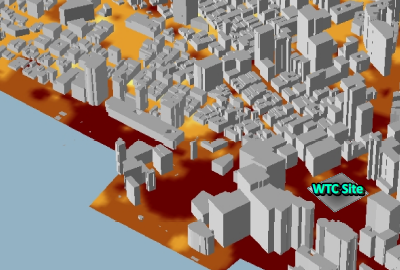
Geospatial Visualization of the World Trade Center Health Registry Exposure and Health Data
Publication Date: 2014
Authors: Graham, S, Lewis, B, Bullard, S, Antao, V, Laszlo, S, Youn, S, Sapp, J
Following the 9/11 attacks on the World Trade Center, ATSDR/GRASP partnered with the New York City Department of Health and Mental Hygiene to develop the World Trade Center Health Registry (WTCHR) to monitor the health of responder survivors after the disaster. GRASP analysts created maps to visualize the exposures (e.g., dust, broken windows, debris, home damage) and health outcomes (e.g., respiratory symptoms and diseases) of WTCHR resident enrollees with an Inverse Distance Weighted (IDW) interpolation of recorded observations of outdoor dust intensity following the attacks.
Five figures of map panels and/or data visualizations appear on this poster. From left to right, Figure 1 shows an Inverse Distance Weighted (IDW) interpolation of recorded observations of outdoor dust intensity on September 11, 2001. Respondents were asked if they were outdoors after the towers’ collapse to report their location and their description of the dust intensity (1=none, 2=some, or 3=heavy) at that location. These values were used in the IDW model to denote the intensity of the dust throughout lower Manhattan. A 3D representation of the building footprints contextualizes the reach of the impact of the disaster in the city with a zoomed in pop-out of the registry enrollment area surrounding the World Trade Center site. Figure 2 is a map showing total population 18 years or older living in Lower Manhattan from the US Census Blocks 2000. Figure 3 is a map showing the registry response rate calculated by the number of respondents per total population 18 years or older. Figure 4 is a map showing registrant response of reported chronic respiratory illnesses. Figure 5 is a map showing registrant response of reported exposures to dust and damages. Figure 6 is a map showing registrant response of reported cleaning and/or replacing items. Individual responses were aggregated to the Census Block.
United States Gonorrhea Cases 2008: An Evaluation of STD Surveillance Network (SSuN) Cycle 2 Population Coverage and Geographic Distribution
Publication Date: 2012
Authors: Dent, A, Dowell, D, Llata, E, Stenger, M, Samuel, M, Mohamed, M, Anschuetz, G, Pugsley, R
GRASP supported CDC’s the Sexually Transmitted Disease (STD) Surveillance Network (SSuN) expansion in 2009 to 115 US counties, 42 STD clinics, and 6 laboratories by creating a map and data visualizations to illustrate the substantial and geographically distributed subset of the gonorrhea cases diagnosed annually and reported via routine National Notifiable Disease Surveillance System (NNDSS) surveillance. GRASP analysts used ArcGIS 10.1 (ESRI, Redlands, CA) to compare and contrast the population demographics of SSuN site counties with the general population of the US and created a digital grid of cells to show state and county figures that mirror the shape, adjacency, and orientation properties of the corresponding units.
One map and two data visualizations appear on this poster. The map of the US presents state figure sizes as representative of the numbers of gonorrhea cases reported via the National Notifiable Disease Surveillance System (NNDSS)/ National Electronic Telecommunications System for Surveillance (NETSS) for each respective state in 2008. The STD Surveillance Network (SSuN) Cycle 2 county figure sizes are representative of the numbers of NNDSS/NETSS gonorrhea cases reported by each SSuN Cycle 2 jurisdiction. The reference maps of the US, Hawaii, and Alaska serve as an aid to assist the map reader in interpretation of resized and distorted figures shown in the map. The state and SSuN Cycle 2 county figures represent case counts, not rates. Thus, the map reader would expect states or SSuN Cycle 2 counties with larger populations to be associated with higher case counts. However, unexpected patterns are revealed. For instance, given that the cartogram distorts states based on case counts, one might expect the size of the figure for Mississippi (US Census 2010 total population: 2,967,297) to be roughly 8% the size of the figure for California (US Census 2010 total population: 37,253,956). However, the size of the Mississippi (2008 NNDSS/NETSS gonorrhea case count: 7,494) is approximately 30% that of California (2008 NNDSS/NETSS gonorrhea case count: 25,787). This is indicative of the much higher gonorrhea rate in the state of Mississippi. In the Demographic Analysis data visualizations using US Census 2010 data, Figure 1 (US vs SSuN Race Analysis) presents a bar chart, which reveals that whites are relatively less populous within SSuN Cycle 2 counties than the within the US population in general. Additionally, SSuN Cycle 2 counties are more racially diverse than the US population. Figure 2 (US vs. SSuN Age and Sex Structure) presents a bar chart, which reveals that the sex and age structure of the two populations is not substantially different.
Recovery after Katrina: Deconstructing the Map
Publication Date: 2010
Authors: Hallisey, E, Flanagan, B, Gregory, E, Lewis, B
Following Hurricane Katrina in 2005, GRASP created a map exploring the recovery in New Orleans, LA by visualizing variables that may affect geographic variation in recovery. The map shows the percentage of pre-Katrina addresses that were receiving mail, (i.e., those receiving mail in March 2009), as a percentage of those receiving mail in June 2005. Reflecting the social vulnerability index (SVI) values, the map shows that areas that experienced light or heavy damage and socioeconomically vulnerable populations were the slowest to recover. This work informed GRASP’s collaboration with CDC’s Office of Terrorism Preparedness and Emergency Response to produce an SVI to assist state partners in all phases of the disaster cycle.
Five figures of map panels and/or data visualizations appear on this poster. From left to right, Figure 1 is a map of New Orleans combining each analysis to show the flooding area, Katrina-related drownings, CDC SVI Household Composition Domain, and percentage of pre-Katrina addresses that are now receiving mail. The central business district and the main tourist centers, such as the French Quarter, experienced limited damage compared to many residential neighborhoods. Figure 2 is a map showing water depth from flooding, indicating that areas that were heavily damaged in the flooding, such as Lakeview and Gentilly, at the southern end of Lake Pontchartrain, and the Lower 9th Ward, just north of the Mississippi River, have mail delivery numbers less than half of pre-Katrina numbers, regardless of SVI value. The Lower 9th Ward, with tracts in the most vulnerable socioeconomic category, has mail delivery less than 25% of pre-Katrina numbers; recovery is slow or non-existent. Additionally, areas in the flood zone that experienced more limited flooding and lower mortality are slower to recover where the SVI value is in the highest third. Figure 3 is a map showing Social Vulnerability Index (SVI) Household Composition Domain, which indicates most Katrina fatalities were elderly with almost half older than 75 years of age. Figure 4 is a map showing Katrina-related drowning fatalities, which were statistically rare events given the population in the flood zone. Figure 5 is a map showing addresses receiving mail (March 2009) as a percentage of addresses receiving mail (June 2005). Overall, the heavily damaged areas have been slow to recover no matter the demographic characteristics. Areas with socioeconomically vulnerable populations, however, are also slow to recover even without heavy flood damage. Those areas that experienced heavy damage and have socioeconomic vulnerable populations are the slowest to recover.