Estimating Site-Specific Ingestion and Dermal Exposure Doses
This section describes how health assessors can estimate ingestion and dermal exposure doses for media-specific pathways. It explains the parameters for the general exposure dose equation as well as other formulas that can be used. For training purposes, examples using fictitious site and exposure information are included for different exposure pathways.
To calculate exposure doses, ATSDR uses pathway-specific equations. For instance, the equation for soil/sediment ingestion is different than for dermal contact with surface water. For exposures via ingestion, ATSDR also breaks out doses by:
- Reasonable Maximum Exposure (RME), which refers to people who are at the high end of the exposure distribution (approximately the 95th percentile). The RME scenario is intended to assess exposures that are higher than average, but still within a realistic exposure range.
- Central Tendency Exposure (CTE), which refers to individuals who have average or typical exposure to a contaminant.
Note: The procedures in this section do not pertain to estimating doses from exposure to radioactivity, radionuclides, or radioactive materials. There are subtle differences in the calculation methods for radiological and exposure doses. Contact a trained health physicist or radiation specialist to help evaluate radiological exposures.
Ingestion exposures: The CTE and RME are different. The CTE and RME ingestion doses use different default values for ingestion rate, exposure frequency, and exposure duration.
Dermal exposures: The chronic (annual) dermal dose is the same for CTE and RME. For dermal absorption, the default exposure scenario for both CTE and RME is based on CTE parameters because the values for body weight and skin surface area are dependent upon each other. Given the dependency of body weight and skin surface area, the non-cancer doses generated for CTE and RME exposure are the same.
Cancer risks: The CTE and RME are different. The CTE cancer risk uses a CTE default residential occupancy period (12 years), and the RME cancer risk uses the RME default residential occupancy period (33 years). Also, different CTE and RME ingestion rates and exposure frequency assumptions affect the doses, and therefore the risks (based on the doses).
To see the CTE and RME inputs used in each pathway-specific equation, refer to ATSDR’s guidance documents.
When possible, use site-specific information to calculate doses. Depending on potential health concerns and site conditions, you can estimate doses for past, current, or future exposures. The ability to accurately estimate past and potential future exposure doses, however, might be limited. Information about past contaminant levels or exposures can be incomplete or unavailable. In some cases, exposures are characterized by using mathematical models, which can be used to estimate exposure concentrations.
At many sites, exposure to a single contaminant can occur through multiple routes of exposure, and exposure to multiple contaminants can also occur. Exposures to multiple contaminants from various pathways can be summed to derive a total exposure dose. More information about approaches to assessing doses to multiple contaminants and exposure pathways is presented in the In-depth Toxicological Effects Analysis section of this e-manual.
Tip: When estimating exposure doses for your sites, consult with an ATSDR toxicologist or SME, if needed.
ATSDR calculates doses for standard age groups and custom groups, when appropriate. The health assessor should strive to estimate exposure doses by using site-specific or population-specific exposure information. The general dose equation is:
Exposure Dose (D) = (C * IR * EF) / BW
The variables in the equation represent the following exposure parameters (also called input parameters):
C = Media-specific contaminant concentration (the EPC)
IR = Media-specific intake rate
EF = Exposure factor
BW = Age-specific body weight
Important: PHAST will automatically convert entered units in its equations.
Selecting Exposure Parameters
This section defines each of the exposure parameters used in the general exposure dose equation and discusses key factors to consider when selecting appropriate variables. To ensure adequate protection of public health, begin by choosing conservative exposure parameters. As appropriate, refine the analysis by considering more realistic parameters consistent with what is known about site-specific exposures.
At some sites, conditions can result in exposures that differ from the standard default assumptions. Health assessors should use exposure parameters that represent appropriate exposure conditions and choose site-specific values whenever possible. You can obtain site-specific information by talking with community members, reading site reports, and other means. For example, you might learn that a site-related population does not rely exclusively on private wells for drinking water. Using default assumptions might therefore overestimate exposures. To ensure that the most reasonable, yet protective, exposure conditions are considered, select exposure parameters for the dose equation by carefully examining site-specific exposure conditions.
Remember, the purpose of the PHA process is to put environmental exposures into proper perspective. Estimating appropriate exposure doses is an important step in this process.
If site-specific values are not available, use default parameters. The main sources for default exposure parameters include PHAST, ATSDR’s Guidance Documents (available on the PHAGM Resources page), and EPA’s Exposure Factors Handbook (EFH). When selecting values from the EFH, choose those that best represent site conditions and would be adequately protective of the surrounding community. The most up-to-date default exposure parameters are found in PHAST.
EPA’s Exposure Factors Handbook (EFH) summarizes population studies and presents a range of exposure estimates based on these studies. Information that can be obtained from EPA’s EFH includes, for example, drinking water or food intakes, breathing rates, body weights, and time spent at different activities, such as showering, swimming, or gardening.
You do not need to limit dose estimates to a single point estimate. Providing a range of realistic scenarios, including CTE and RME doses, as well as other types of doses when appropriate, shows a wider perspective of health implications and helps community members understand where their exposures might fit into the overall picture.
For example, an exposure to a contaminant in soil might be expected to result in long-term effects to workers regularly exposed to soils. However, for people who aren’t regularly contacting the soils, there might be no expected harmful health effects. PHAST will help you evaluate exposures for these and other types of scenarios. For instance, PHAST will use other types of doses (e.g., not CTE or RME) to evaluate exposures to contaminants for specific populations, such as exposures to soil for gardeners and trespassers.
EPA has developed policy and guiding principles to support the use of various techniques for characterizing variability and uncertainty.
In addition, EPA and others have developed tools for conducting probabilistic risk assessments that evaluate data distributions instead of point estimates (e.g., Monte Carlo analysis). Health assessors can use these tools in their evaluations to more adequately characterize variability and uncertainty. Be sure to work with experts in these analyses to determine their applicability, use, and interpretation at a particular site.
The exposure parameters included in the general exposure dose equation are defined below. Also refer to this table that includes additional pathway-specific parameters you may need to include depending on your site-specific scenarios.
- Contaminant concentration. The EPC is used to assess potential exposures from contaminants. Steps to calculate the EPC are outlined in ATSDR’s PHAT EPC Mini-Module [PDF – 2.2 MB].
Note: The information (exposure parameters, health guidelines, and cancer risk values) presented in this section was current at the time of e-manual development. Health assessors must always check PHAST to ensure they are using the most current up-to-date values in their scientific evaluations.
- Exposure group/body weight. ATSDR calculates exposure doses for a standard set of exposure groups with associated default body weights for each exposure pathway-specific dose equation (see table). Health assessors can also evaluate custom exposure groups/body weights, if appropriate. When exposed to the same amount of a contaminant, people with lower body weights will receive a relatively higher dose of the contaminant than people with higher body weights.
- What are the age groups of the exposed population (e.g., toddlers, young teens, or adults)?
- Do the standard exposure groups and associated body weights in PHAST represent all of your site exposures?
- Are there any custom exposure groups and body weights you need to add to your PHAST scenario?
Exposure Groups/Body Weights in Exposure Pathway Equations
| Exposure Group | Body Weight (kg) | Relevant Exposure Pathway Dose Equations | ATSDR Exposure Dose Guidance (EDG) for Reference |
|---|---|---|---|
| Birth to < 1 year | 7.8 | All | Body Weight |
| 1 to < 2 years | 11.4 | All | Body Weight |
| 1 to < 2 years (pica) | 11.4 | Soil/sediment ingestion | Soil/Sediment Ingestion |
| 2 to < 6 years | 17.4 | All | Body Weight |
| 2 to < 6 years (pica) | 17.4 | Soil/sediment ingestion | Soil/Sediment Ingestion |
| 6 to < 11 years | 31.8 | All | Body Weight |
| 11 to < 16 years | 56.8 | All | Body Weight |
| 16 to < 21 years | 71.6 | All | Body Weight |
| Adult | 80 | All | Body Weight |
| Adult workers, gardeners, those with geophagy | 80 | Soil/sediment ingestion/dermal | Soil/Sediment Ingestion |
| Pregnant Women | 73 | Drinking water ingestion | Water Ingestion |
| Lactating Women | 73 | Drinking water ingestion | Water Ingestion |
- Intake rate. The intake rate is the amount of a contaminated medium to which a person is exposed during a specified period of time. Examples include the amount of water, soil, and food ingested on a daily basis; the amount of air inhaled; or the amount of water or soil that a person may contact through dermal exposures. Select intake rates that best characterize the exposed population.
ATSDR has standard, media-specific default CTE intake rates and RME intake rates that align with the standard set of exposure groups. Default CTE intake rates represent average or typical exposure to a contaminant, while the default RME intake rates represent people who have a higher than average exposure (approximately the 95th percentile), but are still within a realistic range of exposure. Default intake rates are stored in PHAST and in Exposure Dose Guidance documents for individual exposure pathways. ATSDR has default intake rates for all exposure pathways in PHAST except for food ingestion.
Health assessors must evaluate whether the CTE and/or RME default intake rates are representative of site-specific conditions and potentially affected populations. If not, you will need to obtain more realistic parameters and provide justification for changing default values.
When selecting an appropriate intake rate, consider the unique behavior or exposure rates of site populations. Default assumptions are intended to be conservative, that is, lead to overestimates of doses for the population they describe. But in some instances, using default assumptions could underestimate exposures. For example, using intake rates for the general population to represent people drinking water who live in very warm climates could underestimate the actual intake. Make sure that consumption rates accurately reflect the habits and behaviors of the local population.
- Does the population include unique subpopulations?
- Are there population-related factors (e.g., sex, age, health status, cultural practices) or site-related conditions (e.g., climate, activities, season, region, urbanization) that could affect intake rates?
- What behaviors or practices might impact intake rates? For example, are people gardening in areas of contaminated soil or visiting contaminated areas of industrial facilities?
- What are the drinking water and food sources in the affected area? Do people use private wells or municipal water supplies? Do people consume local or homegrown produce and livestock?
- Exposure factor (EF). The EF expresses how often (frequency) and how long (duration) a person could contact a contaminant in the environment over a certain amount of time (averaging time). The default EF value is usually 1, which indicates exposure occurs daily for acute, intermediate, and chronic durations, but health assessors can change the EF based on site-specific exposures. For instance, the EF can be used to adjust the exposure dose or concentration to account for intermittent or irregular exposure. ATSDR’s Exposure Dose Guidance for Life Expectancy and Exposure Factors provides the default values to use and discusses site-specific options for the EF equation.
- What is the likelihood that people will actually come in contact with the highest detected concentrations of contaminants?
- Are exposures likely to be incidental, frequent/regular, or excessive?
- What is the likelihood that exposures to environmental media will occur at default levels? Is the level likely to be more or less?
- How might climate affect exposure frequency?
- What land use factors, such as the location of the water supply, parks, or schools, will affect exposure frequency?
- When was contamination first released from the site (e.g., initial and final dates of operation or receipt of wastes)?
- Are there measures in place that could have ended exposures (e.g., water treatment systems, site access barriers, or remedial actions)?
- Who are the exposed populations, and when could exposures have begun (e.g., construction date of residential neighborhoods)?
Health assessors can use PHAST to calculate the EF. The EF is calculated using the following general equation (see the example EF calculation that follows):
Exposure Factor (EF) = (F * ED) / AT
Where:
F = Exposure frequency
ED = Exposure duration
AT = Averaging time
The exposure frequency is how frequently exposure occurs, often measured in days per week and weeks per year. ATSDR assumes daily exposures when developing CVs and health guidelines, but actual pathway- and media-specific exposures can occur less frequently. For example, the frequency of exposure could be less if the site has limited access.
The exposure duration is the length of time a population has been exposed to site contaminants. You can usually estimate the maximum duration by examining the site’s history. You can also base the exposure duration on the activities of the exposed population. For example, the exposure duration of people staying in a vacation rental home served by a contaminated water supply will be only as long as their stay at the home.
The averaging time is the time period over which exposure is averaged to arrive at a time-weighted exposure factor, used to express exposure in terms of an average daily dose or air concentration that can be compared to health guidelines and toxicity study results. For assessing cancer risks, the time is averaged over a lifetime of 78 years (based on the average life expectancy for men and women combined). The time exposure parameter for carcinogenic effects is therefore 28,470 days (365 days/year x 78 years). This approach for carcinogens assumes that exposure to a high dose or air concentration during a short period is the same as a corresponding low dose or air concentration during a lifetime. For assessing non-cancer effects, the time is averaged over the exposure duration (days, weeks, or years), which may not be a lifetime. For example, when estimating the dose for a child exposed to a contaminant in a playground for 3 years, the time exposure parameter would equal 1,095 days (365 days/year x 3 years). As with all assumptions, these might not be applicable in all situations.
Scenario: A family stays in a weekend home on Saturdays and Sundays during the summer for 3 months out of the year for 5 years. The home lays over a groundwater plume, and you are examining their exposure to drinking water while residing in their summer home.
Calculate the EF as follows:
(2 days/7 days) * (12 weeks/52.14 weeks) * (5 years/5 years) = 0.066
- Bioavailability factor. The bioavailability factor is the amount of a contaminant that is absorbed into a person’s body. It is the percent of the total amount of a contaminant ingested, inhaled, or contacted that actually enters the bloodstream and is available to potentially harm a person. ATSDR assumes this factor to be 1 (i.e., all of a contaminant to which a person is exposed is assumed to be absorbed) for all exposure pathways and contaminants, with one exception: arsenic via soil ingestion. Thus, PHAST shows only the arsenic bioavailability factor for the soil ingestion equation, using a value of 0.60 (which can be altered by the health assessor if supported by site-specific information). Health assessors should not adjust the bioavailability factor of 1 for any contaminant other than arsenic without first consulting with a toxicologist and getting the approval of the ADS group.
Calculating Exposure Pathway-Specific Doses
In addition to the general exposure dose equation described above, which ATSDR uses for drinking water and food ingestion, ATSDR has formulas for other exposure pathways that incorporate more components, such as for soil and water dermal exposure pathways. As with the general exposure dose equation, begin by choosing conservative exposure parameters and refining the analysis, as needed, by considering more realistic parameters. Refer to ATSDR’s Exposure Pathway-Specific EDGs and PHAST (see PHAST text box below) to locate the appropriate parameters. If you modify default intake parameters, document the basis of those modifications. Note that some pathway-specific equations use exposure parameters (described in this table) that are not in the general exposure dose equation.
What ingestion and dermal contact scenarios should I run in PHAST’s Exposure Calculator?
PHAST has several default and site-specific scenarios:
- Drinking Water: Ingestion
- Surface Water: Swimming (ingestion and dermal contact) or wading (dermal contact only)
- Soil/Sediment: Individual or combined ingestion and dermal contact (residential, occupational, trespasser/recreational, and other scenarios [adult gardeners and adults with geophagy])
- Food: Ingestion of solid food or liquid food
Drinking Water
Ingestion of contaminated water can be a significant source of exposure to hazardous contaminants from a site. However, inhalation and dermal exposures can also significantly contribute to the total exposure dose when certain contaminants, such as volatile organic compounds (VOCs), are present in drinking water used for other household purposes. The magnitude of these exposures, which you can use the SHOWER Model to evaluate (see box), varies depending on the frequency of showering and bathing, time spent indoors, air exchange rates in the bathroom and house, and other factors.
The preferred way to estimate exposure from the ingestion of potable water is to analyze contaminant concentrations in indoor tap water samples from individual homes. You can also use data collected from exterior home spigots, private wells, or municipal wells (at the public water distribution point).
To calculate the most accurate exposure, consider site-specific information. More importantly, realize that the default intake rate represents fluid intake from all sources. As such, assuming the default intake rate suggests all fluids are from a single drinking water source.
See the equation below and an example for estimating doses via drinking water.

Health assessors can use ATSDR’s SHOWER Model to evaluate inhalation and dermal exposures to volatile and semi-volatile contaminants from household water use for showering, tub bathing, clothes washing, and other activities. For the EPC and Exposure Calculation component of the PHA process, you can use the EPC household water concentration (generated outside of the SHOWER Model, refer to the EPC section for more details) to develop a dermal dose for the dermal pathway. Health assessors can also use the SHOWER Model to evaluate inhalation exposures to contaminated household water, as discussed in the Using ATSDR’s SHOWER Model to Evaluate Inhalation Exposures section. See how the SHOWER Model fits into the entire PHA process in this diagram (under development). Also refer to instructions for using the model [PDF – 3 MB] and the SHOWER Model Guidance (under development). Anyone can request a copy by emailing showermodel@cdc.gov.
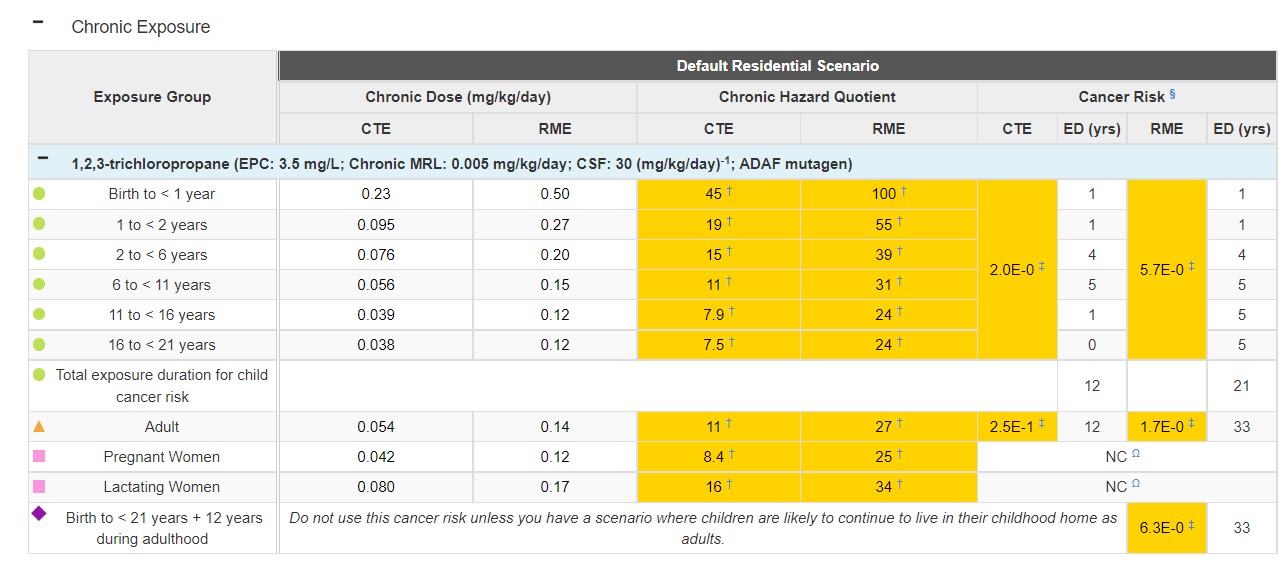
Scenario: A family has been exposed daily to contaminated drinking water for an unknown number of years. The water has an EPC of 3.5 milligrams per liter (mg/L) for 1,2,3-trichloropropane. You do not know the number of residents of the home or their ages.
Because you do not have specific information on the residents, you will examine all of the default exposure groups in PHAST (this will use default body weights and default intake rates). You will use an EF of 1 because the residents had daily, chronic exposure. The table below includes the PHAST drinking water ingestion default exposure groups, and their associated default body weights, CTE intake rates, and RME intake rates. The table also shows the CTE doses and RME doses calculated for each default exposure group.
Let’s do one example together to calculate an RME dose for the birth to < 1 year exposure group. We will use the drinking water ingestion equation to calculate the RME dose as follows:
RME Dose = (C x IR x EF) / BW
RME Dose = (3.5 mg/L x 1.113 L/day x 1) / 7.8 kg
RME Dose = 0.50 mg/kg/day
| Exposure Group | Body Weight (kg) | CTE Intake Rate (L/day) | RME Intake Rate (L/day) | CTE Dose (mg/kg/day) | RME Dose (mg/kg/day) |
|---|---|---|---|---|---|
| Birth to < 1 year | 7.8 | 0.504 | 1.113 | 0.23 | 0.50 |
|
1 to < 2 years |
11.4 |
0.308 |
0.893 |
0.095 |
0.27 |
|
2 to < 6 years |
17.4 |
0.376 |
0.977 |
0.076 |
0.20 |
|
6 to < 11 years |
31.8 |
0.511 |
1.404 |
0.056 |
0.15 |
|
11 to < 16 years |
56.8 |
0.637 |
1.976 |
0.039 |
0.12 |
|
16 to < 21 years |
71.6 |
0.770 |
2.444 |
0.038 |
0.12 |
|
Adult |
80 |
1.227 |
3.092 |
0.054 |
0.14 |
|
Pregnant Women |
73 |
0.872 |
2.589 |
0.042 |
0.12 |
|
Lactating Women |
73 |
1.665 |
3.588 |
0.080 |
0.17 |
See the PHAST results table for this scenario below.
Soil/Sediment Ingestion
Soil ingestion can occur by inadvertently consuming soil on hands or food items, mouthing objects, ingesting unusually high amounts of soil (i.e., soil-pica), or intentionally ingesting earth as part of certain cultural practices (i.e., geophagy). With soil-pica, health assessors should assume this practice exists if you have any possible scenarios that could involve exposures for children. Health assessors should investigate geophagy only if they learn this practice occurs during the site visit or from talking with other agencies who might know about this practice locally.

It is typical for younger children to mouth or ingest non-food items to some extent.
Consider the use of and accessibility to the site and surrounding areas when evaluating a site’s soil exposure pathways. Sites with abandoned buildings, standing water, or streams can attract children, and exposures can occur at sites near playgrounds or school yards despite fencing and other efforts to restrict access. Both residential and recreational areas are likely to provide access for exposure. Family members and pets can also bring contaminated soil into homes on their feet and in their hair.
Note: A young child playing on the floor will have the maximum opportunity both for ingestion and for dermal exposure to soil and dust accumulated on the floor.
See the equation below and an example for estimating doses via soil ingestion.
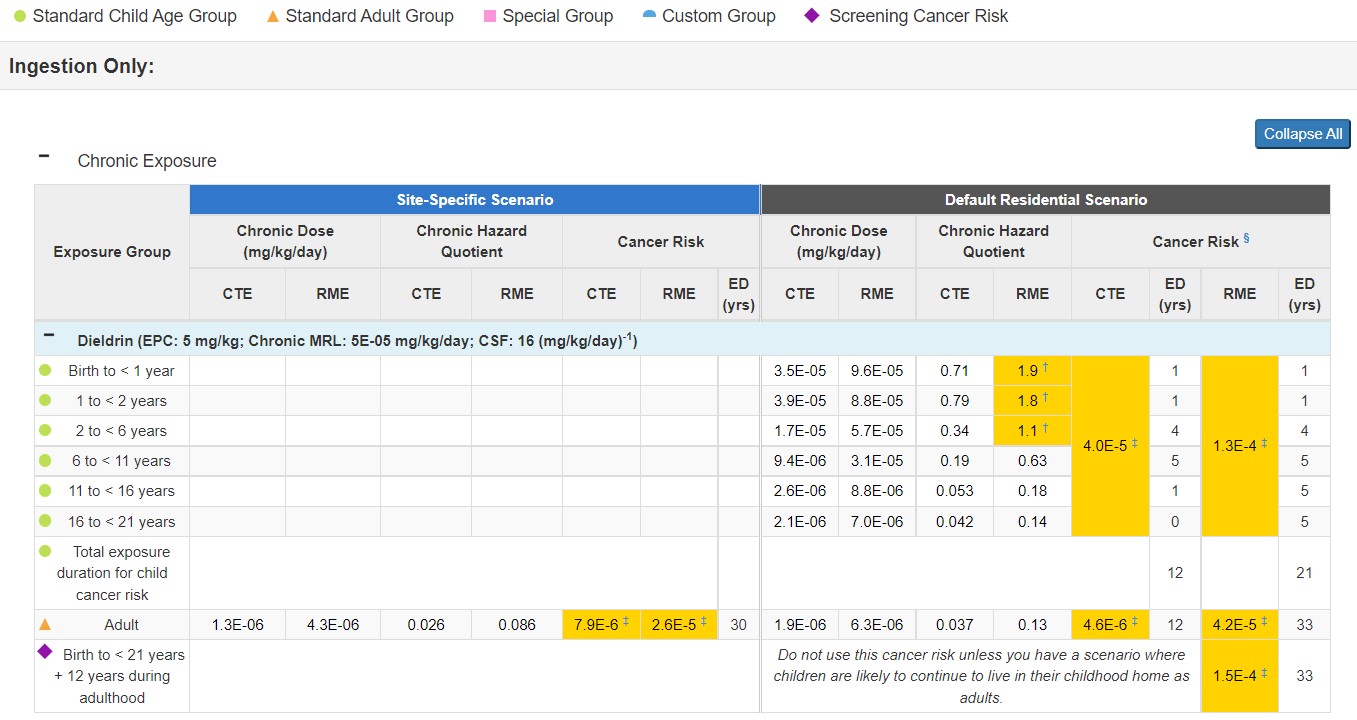
Scenario: An adult weighing 80 kg inadvertently ingests soil with a dieldrin EPC of 5 mg/kg at the default daily soil RME ingestion rate of 100 mg/day. Assume the person is on site 5 days per week, 50 weeks per year, for 30 years.
First calculate the exposure factor:
EF = (F x ED) / AT
EF = ([5 days/week x 50 weeks/year] x 30 years) / (30 years x 365 days/year)
EF = 0.68
Next calculate the RME exposure dose:
RME Dose = (C x IR x EF x CF) / BW
RME Dose = (5 mg/kg x 100 mg/day x 0.68 x 1E-06 kg/mg) / 80 kg
RME Dose = 4.3E-06 mg/kg/day
See the PHAST results table for this scenario below.
Calculating Soil-Pica Exposures
Soil-pica is defined as the persistent eating of non-nutritive substances such as dirt or paint. Incidental ingestion of soil occurs in all age groups, particularly in children (who have more hand-to-mouth contact), but soil-pica is the intentional ingestion of larger amounts of soil. ATSDR evaluates soil-pica only under certain circumstances, such as when this behavior is known or suspected to have occurred. Health assessors should evaluate soil-pica exposures using the maximum detected concentration as the EPC. The guidance that applies for calculating EPCs for soil-pica exposures is discussed in the Soil/Sediment Ingestion section.
- Run a default soil-pica intermediate and acute residential scenario in ATSDR’s Public Health Assessment Site Tool (PHAST) Soil/Sediment Exposure Calculator. You will use an EPC that represents the maximum concentration of surface soil that a child could access. The default scenario in PHAST assumes an exposure of 3/7 days a week and an intake rate of 5,000 milligrams per kilogram (mg/kg).
*If PHAST indicates the default scenario using the maximum concentration exceeds acute and/or intermediate health guidelines (as indicated by a health quotient > 1 in PHAST) go to step 2.
- Enter site-specific parameters, if available, in PHAST to determine whether a single soil-pica event is a health concern. Note that site-specific data are often not available and are not required to evaluate this one-time dose. Typically, this one-time dose uses an exposure of 1 day and the default intake rate of 5,000 mg/kg.
Refer to ATSDR’s Soil and Sediment Ingestion EDG and ATSDR’s Discrete Sampling Guidance for more information.
Soil/Sediment Dermal Contact
During the PHA process, health assessors need to examine the potential for exposure by dermal absorption of contaminants via contact with contaminated soil. Dermal absorption of contaminants from soil or dust depends on the area of contact, duration of contact, chemical and physical attraction between the contaminant and the soil, and ability of the contaminant to penetrate the skin. Contaminant-specific factors, such as lipophilicity, polarity, volatility, molecular weight, and solubility also affect dermal absorption.
Whether dermal exposure is a minor or major contributor to the overall exposure dose relative to contributors from ingestion and inhalation will depend on your site-specific exposure scenarios. Many organic contaminants bind to organic matter in soil and are therefore not readily available for absorption by the skin. In addition, if absorption occurs, it can only be with the fraction of the contaminant that is in direct contact with the skin. Therefore, the ability of a soil contaminant to be dermally absorbed depends on the diffusion of the contaminant through the soil matrix to the location where it can come in contact with someone’s skin.
There are many exposure parameters that are unique to the soil/sediment dermal dose equation (see table). One such factor is adherence, which is a soil-specific factor involved in dermal absorption. Adherence depends on soil properties, the part of the body exposed to the soil, and the type of activity being performed during soil contact. Where possible, consider site- and exposure-specific conditions. Refer to PHAST for default adherence values.
Another factor to consider is the exposure frequency and duration. Young children, older children, and adults are expected to have different exposure frequency and duration. Young children would typically have an increased exposure duration, because they tend to retain soil on their skin after coming indoors from not washing their hands as soon as adults would, and an increased exposure frequency because they tend to have more time to be exposed to outdoor soil. In general, adults would have a decreased exposure frequency because they tend to have less time to be exposed to outdoor soil.
See the equation below and an example for calculating an administered dermal dose (ADD) for soil contact.
ADD = (C × EV x EF × CF × AF × ABSd × SA) / (BW × ABSGI)
ADD = Administered Dermal Dose (mg/kg/day), C = Contaminant Concentration (mg/kg), EV = Event Frequency (event/day), EF = Exposure Factor (unitless), CF = Conversion Factor
(10-6 kg/mg), AF = Adherence Factor to Skin (mg/cm2-event), ABSd = Dermal Absorption Fraction to Skin (unitless), SA = Skin Surface Area Available for Contact (cm2), BW = Body Weight (kg), ABSGI = Gastrointestinal Absorption Factor (unitless)
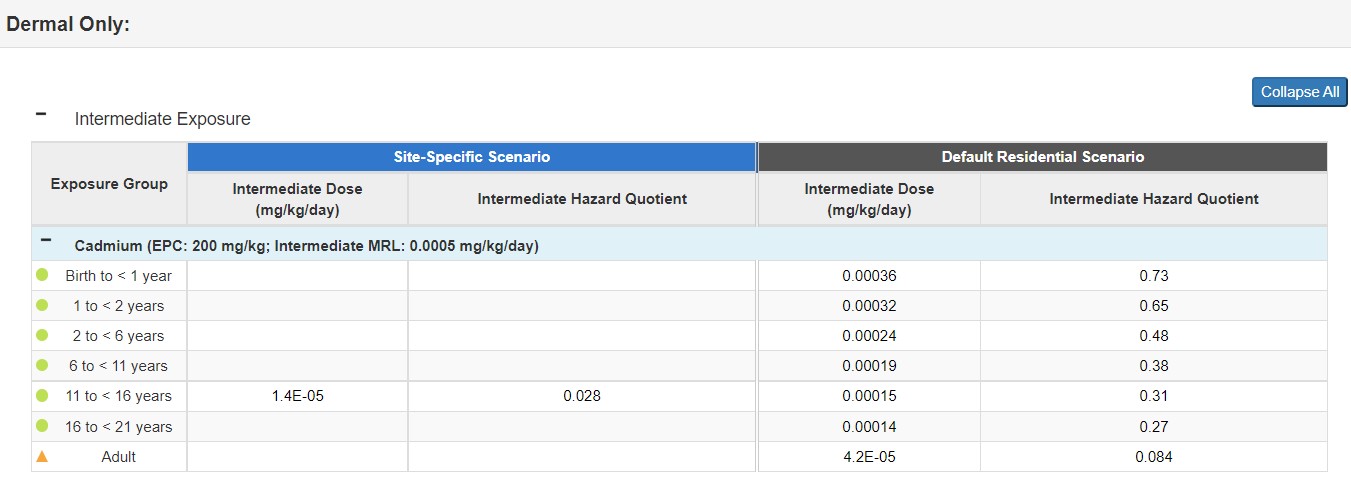
Scenario: An eighth-grade class creates a community garden in a vacant area next to its school. The class is comprised of students who are 13 and 14 years of age, an age group with a default body weight of 56.8 kg. Students work in the garden 2 days a week during the school year that runs from September 9 through June 18 (roughly 40 weeks). For soil/sediment dermal exposures, ATSDR assumes an exposure frequency of 1 event/day.
At the end of the school year, investors looking to purchase the property being used as the garden conducted soil sampling. Several samples revealed the presence of cadmium, ranging from 25 mg/kg to 500 mg/kg, with a calculated 95UCL of 200 mg/kg. The middle school students had not ingested the soil nor any of the vegetables planted, but they did have dermal contact with the soil.
Use the exposure parameters included in the scenario, as well as the following default values, to estimate the ADD for this age group:
- EV = 1 event/day
- EF = 0.29 [calculated as (2 days/7 days) * (40 weeks/40 weeks)]
- CF = 1.0E-06 kg/mg
- Default AF: 0.2 mg/cm2-event
- ABSd for cadmium: 0.001 (unitless)
- Default SA for body parts that contacted the soil while gardening: hands (720 cm2) and forearms (1,022 cm2) for a total of 1,742 cm2
- ABSGI for cadmium = 0.025 (unitless)
Now, calculate the ADD for intermediate soil exposure:
ADD = (C × EV x EF × CF × AF × ABSd × SA) / (BW × ABSGI)
ADD = (200 mg/kg x 1 event/day x 0.29 x 1.0E-06 kg/mg x 0.2 mg/cm2-event x 0.001 x 1,742 cm2) / (56.8 kg x 0.025)
ADD = 1.4E-05 mg/kg/day
See the PHAST results table for this scenario below.
Surface Water Ingestion
At some sites, you might need to evaluate exposures associated with swimming or recreational activities in surface water bodies. Most scenarios involving ingestion of surface water will be due to incidental ingestion while swimming.
Consider geographic factors (such as proximity or availability of surface water for recreation), seasonal factors, and age when determining the appropriate exposure factor. Activity pattern data from the EPA’s EFH can help you make some of the necessary determinations (e.g., swimming frequency/month).

Be sure to consider local and regional knowledge when determining a reasonable exposure factor for surface waters.
Surface water scenarios often require adjusting the EF based on site-specific factors. For example, where warm-weather conditions prevail year-round (such as in southern Florida, Puerto Rico, or southern California) exposure duration can be chronic, intermediate, or acute, or a combination of these durations. But, where warm weather conditions exist only a few months of the year, only acute and intermediate duration exposures are likely. Another example is for scenarios where children may be visiting a location for the summer, such as camp, where only acute exposure is likely.
See the equation below and an example for calculating a dose for ingestion of surface water while swimming.
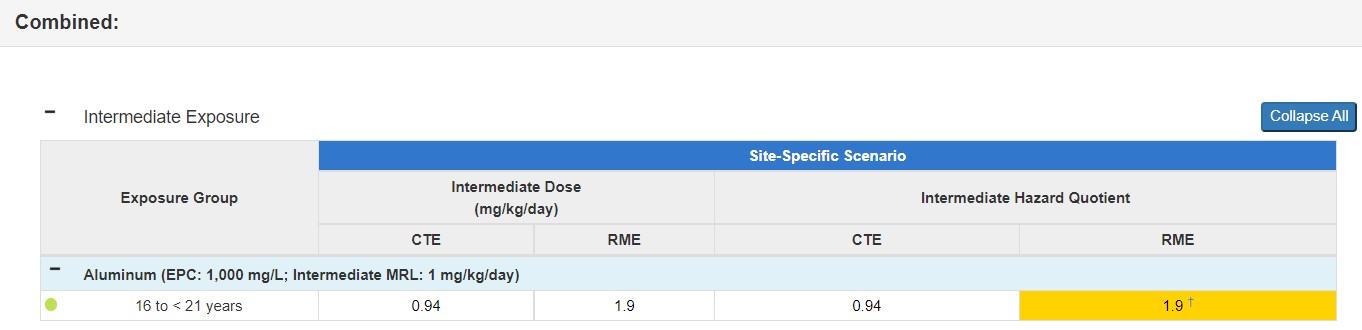
Scenario: A 16-year-old camp counselor goes to a sleepaway camp for 8 weeks one summer. She is in the exposure group with a default body weight of 71.6 kg. She swam in a river at the camp 1 hour each day. Surface water samples collected at the river revealed the presence of aluminum, with an EPC of 1,000 mg/L. ATSDR’s age-specific default swimming ingestion intake rates are 0.049 L/hour (CTE) and 0.12 L/hour (RME). For this intermediate scenario, the EF is 1.
The CTE and RME ingestion exposure doses are calculated as follows:
CTE Dose = (C × IR × tevent × EV × EF) / BW
CTE Dose = (1,000 mg/L x 0.049 L/hour x 1 hour/event x 1 event/day x 1) / 71.6 kg
CTE Dose = 0.68 mg/kg/day
RME Dose = (C × IR × tevent × EV × EF) / BW
RME Dose = (1,000 mg/L x 0.12 L/hour x 1 hour/event x 1 event/day x 1) / 71.6 kg
RME Dose = 1.7 mg/kg/day
See the PHAST results table for this scenario below.

Surface Water Dermal Contact
Most scenarios involving skin contact with surface water involve swimming or wading. Dermal absorption of contaminants via surface water can be a significant exposure route depending on contaminant-specific characteristics. There are many exposure parameters that are unique to the surface water dermal dose equation (see table). One such parameter is skin permeability to a contaminant, which is influenced by the contaminant’s physicochemical properties, including its molecular weight (size and shape), electrostatic charge, hydrophobicity, and solubility in aqueous and lipid media. In general, contaminants that demonstrate high skin permeability are low in molecular weight, non-ionized, and lipid-soluble.
The chemical-specific permeability coefficient is another parameter considered in the estimation of dermal absorption of a chemical from water. Values for dermal permeability coefficients may vary over a large range, depending on the contaminant. When the permeability coefficient for a contaminant is known, the dermal absorption of a chemical from water can be estimated.
Another factor to consider when calculating exposure doses from dermal contact is the exposure frequency and duration. When calculating exposure doses, consider geographic factors, such as proximity or availability of surface waters for recreation, seasonal factors, and age.
See the equation below and an example for calculating an Administered Dermal Dose (ADD) of surface water through either swimming or wading.
ADD = (DAevent × SA × EV × EF) / (BW × ABSGI)
ADD = Administered Dermal Dose (mg/kg/day), DAevent = Absorbed Dose per Event (mg/cm2/event), SA = Surface Area Available for Contact (cm2), EV = Event Frequency (events/day), EF = Exposure Factor (unitless), BW = Body Weight (kg), ABSGI = Gastrointestinal Absorption Factor (unitless)
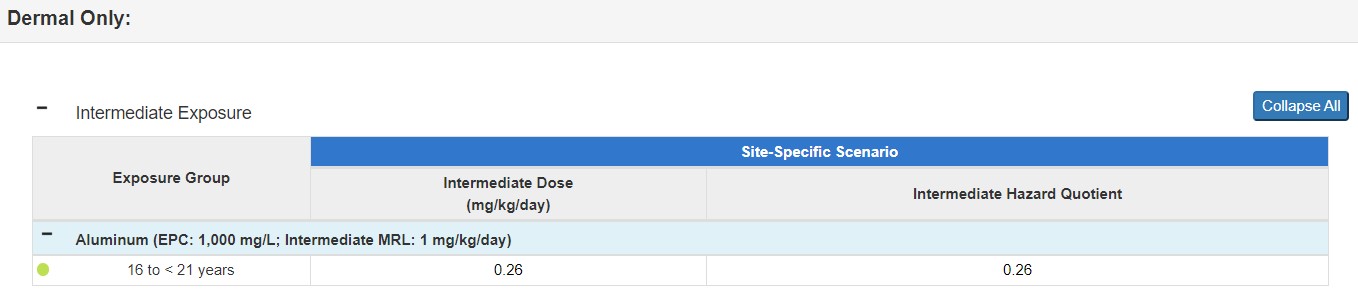
Scenario: Using the example of the teenage counselor at a sleepaway camp, you will use the ingestion exposure parameters, as well as the default combined skin surface area of 18,400 cm2. For aluminum, the GI absorption factor (ABSGI) is 1. PHAST will calculate the absorbed dose per event (DAevent) based on your contaminant and other specific exposure inputs. For this scenario, the DAevent is 0.001 mg/cm²/event.
Calculate the dose as follows:
ADD = (DAevent × SA × EV × EF) / (BW × ABSGI)
ADD = (0.001 mg/cm²/event x 18,400 cm2 x 1 event/day x 1) / (71.6 kg x 1)
ADD = 0.26 mg/kg/day
Since the same site-specific exposure scenario is used in the example here for surface water ingestion and surface water dermal contact, you can combine the doses. This example combined dose would be calculated as follows:
Combined CTE Dose = 0.68 (ingestion) + 0.26 (dermal) = 0.94
Combined RME Dose = 1.68 (ingestion) + 0.26 (dermal) = 1.9
See the PHAST results tables for this scenario below.
Food Ingestion
To assess the human health risk from ingesting contaminated food, you need information on the quantities of contaminated foods consumed and the extent of contamination in these foods. Direct concentration measurements are the most reliable way to assess food contamination exposure. These measurements should be conducted on foods prepared for consumption or portions of contaminated plants and animals that are representative of the portions used as food.
If the food chain appears to be a significant pathway for human exposure, but you lack the appropriate information on contaminant levels, explicitly describe this gap in your document and recommend how to obtain the needed information. Make sure you understand the contaminants at the site and their tendencies to bioaccumulate in animals or plants so that you can recommend the most appropriate strategy.

To estimate the food chain exposure dose, you need to know the consumption rate of specific food items in the human diet. ATSDR does not have default intake rates for food, so health assessors should use the EPA’s EFH to obtain these intake rates. Be aware that consumption rates of the population (and subpopulations) in the vicinity of a hazardous waste site can differ considerably from national averages. For example, American Indians/Alaska Natives who subsist on fish from a primary source will likely have higher consumption rates. Use local consumption patterns if they are available and differ from national averages.
Commonly, as a health assessor, you will be concerned about exposures from consuming fish due to the potential for bioaccumulation of a contaminant(s) found in surface water or sediment. In addition, in the case of residential soil contamination, the consumption rate of homegrown foods and local wild plants is also of interest.
- ATSDR’s Fish and Shellfish Ingestion EDG (under development)
- ATSDR’s PFAS Guidance for Biota
See the equation below and an example for calculating exposure doses for food ingestion.
Note: Cleaning and cooking fish prior to eating can reduce the levels of some contaminants; however, this example takes a conservative approach and does not consider contaminant reduction due to cooking. You can review scientific literature to identify how cooking can affect the contaminants under evaluation in the foods of interest.
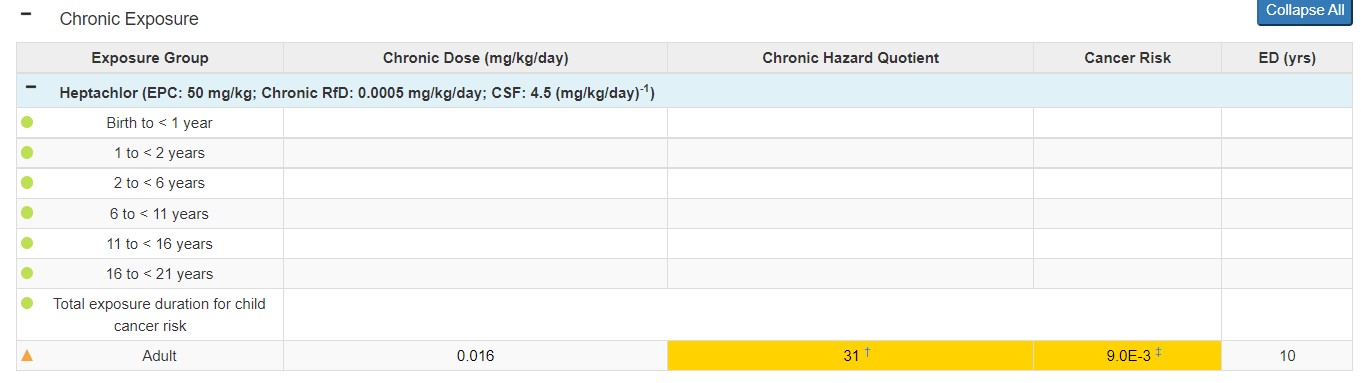
Scenario: An adult weighing 80 kg is a recreational fisherman at a lake near the site. Based on site-specific data, he ingests 1 daily meal of fish fillets with an average intake rate of 25 grams per meal per day (g/meal/day). Several fish fillet samples from the lake have revealed the presence of heptachlor. Based on an analysis of the contaminant concentrations from the samples (wet weight), the 95UCL for heptachlor in this lake’s fish is 50 mg/kg. For this scenario, assume the fisherman is exposed every day for 10 years.
Using the equation above and these exposure parameters, convert the intake rate from 25 g/meal/day to kg/day. This results in a value of 0.025 kg/day. Because there is daily, continuous exposure for 10 years, you know the EF is 1.
Now, calculate the food ingestion chronic exposure dose as follows:
Dose = (C x IR x EF) / BW
Dose = (300 mg/kg x 0.025 kg/day x 1) / 80 kg
Dose = 0.016 mg/kg/day
See the PHAST results table for this scenario below.
Note: PHAST does not have default intake rates for food. If site-specific data were not available, you would have referred to EPA’s EFH to find appropriate values.