Identify Data from Studies Used to Develop Non-Cancer Health Guidelines
This section describes the process for reviewing the studies used to develop health guidelines for non-cancer health effects. Using a fictional example, it describes key resources you will use and walks you through the process.
If the EPCs and Exposure Calculations Evaluation performed during the PHA process indicates a site-specific dose or concentration exceeds the non-cancer health guidelines, health assessors should identify the studies and endpoints used to derive the health guidelines (e.g., MRL, RfD, RfC). To understand the public health significance of exceeding a non-cancer health guideline, you will review the basis for the study or studies used to derive the health guideline.
For some chemicals, you may want to talk to the ATSDR profile manager to see if more recent studies have been published that might be useful (discussed in the section called Examine More Recent Non-Cancer Studies, if warranted). If no non-cancer health guidelines are available, compare your site-specific doses or concentrations directly with those from animal and human studies to determine the possibility for harmful effects (see that process in the Evaluate Evidence to Examine Non-Cancer Effects section).
Important: Health assessors need to examine key studies when a non-cancer health guideline is exceeded, but this is not a required step when a cancer risk estimate exceeds a level of concern. For cancer risk, health assessors are only required to quantitatively estimate the cancer risk (when a contaminant has a CSF or an IUR) and interpret that risk. In rare cases, a review of the original study could be useful, but this is not typically recommended. Consult an ATSDR toxicologist if you need assistance.
When reviewing these studies, look for observed-effect levels from human epidemiologic or experimental animal studies. The following list includes observed-effect levels used to develop health guidelines:
- NOAEL (no-observed-adverse-effect level). This is the highest dose level (below the LOAEL) at which no adverse or toxic effect has been observed.
- LOAEL (lowest-observed-adverse-effect level). This is the lowest dose level at which an adverse or toxic effect has been observed.
- BMDL/BMCL. This is the lower bound of the confidence interval for the benchmark dose (BMD) or benchmark concentration (BMC). It is the lower confidence limit that corresponds to a dose or concentration that produces a specific magnitude of changes for a particular adverse response.
- HED/HEC. The human equivalent dose or concentration. Exposures are converted to their human equivalents if possible (through toxicological models and dosimetric adjustments).
Remember: Simply being exposed to a contaminant does not make it a hazard. The magnitude, frequency, timing, and duration of exposure and the toxicity characteristics of individual contaminants affect the degree of hazard, if any.
Depending on the available data and the type of toxic response, observed-effect levels and no-effect levels are often used in benchmark dose modeling, dosimetric adjustment modeling, or physiologically based pharmacokinetic (PBPK) modeling. Then, a series of uncertainty factors and/or modifying factors are applied to ensure that they are amply health-protective. The concept of benchmark dose is illustrated in this Benchmark Dose Analysis schematic. You can also refer to EPA’s BMD Guidance [PDF – 1,108 KB] for information. You will generally find information on the critical study in the
Tip: Always start this step of identifying key studies for non-cancer by looking at ATSDR’s Toxicological Profiles and EPA’s IRIS Database.
- ATSDR Toxicological Profiles (in the section titled Health Effects: Relevance to Public Health),
- Levels of Significant Effects (LSE) table and figures as discussed later in this section,
- Appendix presenting ATSDR Minimal Risk Levels and Worksheets as discussed later in this section), or
- EPA IRIS database.
This example uses a fictional scenario to illustrate the steps of this process.
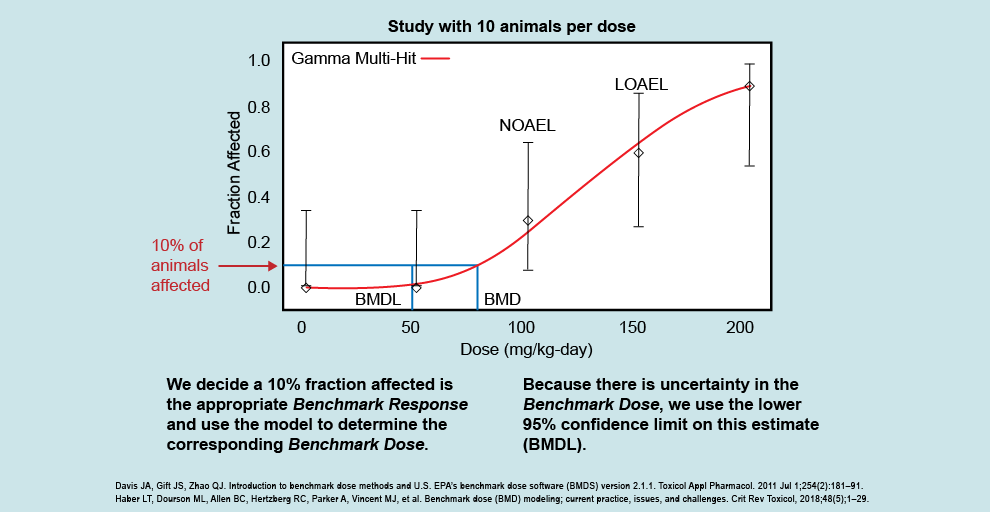
This figure illustrates how the dose response looks following a BMD analysis, and allows scientists to examine the entire dose-response curve. The BMD analysis differs from the NOAEL/LOAEL approach, which looks not at the whole dose-response curve but instead at individual study doses to see if they are different than the control. Using this example, you can see that we do not have study results below the NOAEL (100 mg/kg/day) or between the NOAEL and LOAEL (150 mg/kg/day).
The BMD analysis allows us to examine what exposure gives a threshold of effect (i.e., the benchmark response, or BMR) instead of being able to use only the NOAEL or LOAEL. The BMD analysis applies a statistical model to the dose-response data (shown by the red line going through the points that fit to the data) that allows scientists to incorporate uncertainty into the experimental study results. The example figure shows that the corresponding dose that would result in 10% of animals affected (i.e., the benchmark dose) is somewhere between 70 and 80 mg/kg/day. The analysis allows us to closely estimate the level at which this response would be seen (the BMD), and then calculate a 95% lower confidence limit on the estimated BMD, called the BMDL. We want to make sure not to just assume the mean effect of the benchmark dose, but to use the lower bound to that estimate and be reasonably confident that the benchmark dose is not lower than the BMDL.
BMD modeling is often used to identify the point of departure in deriving the health guideline. The BMDL is also an effect level that health assessors can compare their site-specific doses and concentrations to when deciding the possibility of harmful effects. In some studies, ATSDR and EPA will use dosimetric methods to convert the BMDL to a human equivalent dose (HED). If an HED is available, health assessors will use that over the BMDL when deciding the possibility of harmful effects. This is discussed further in the Evaluate the Evidence to Examine Non-Cancer Effects section.
Important: This example is for training purposes only. ATSDR, EPA, and other agencies periodically update their values. Always use the most current values and supporting information in your evaluation.
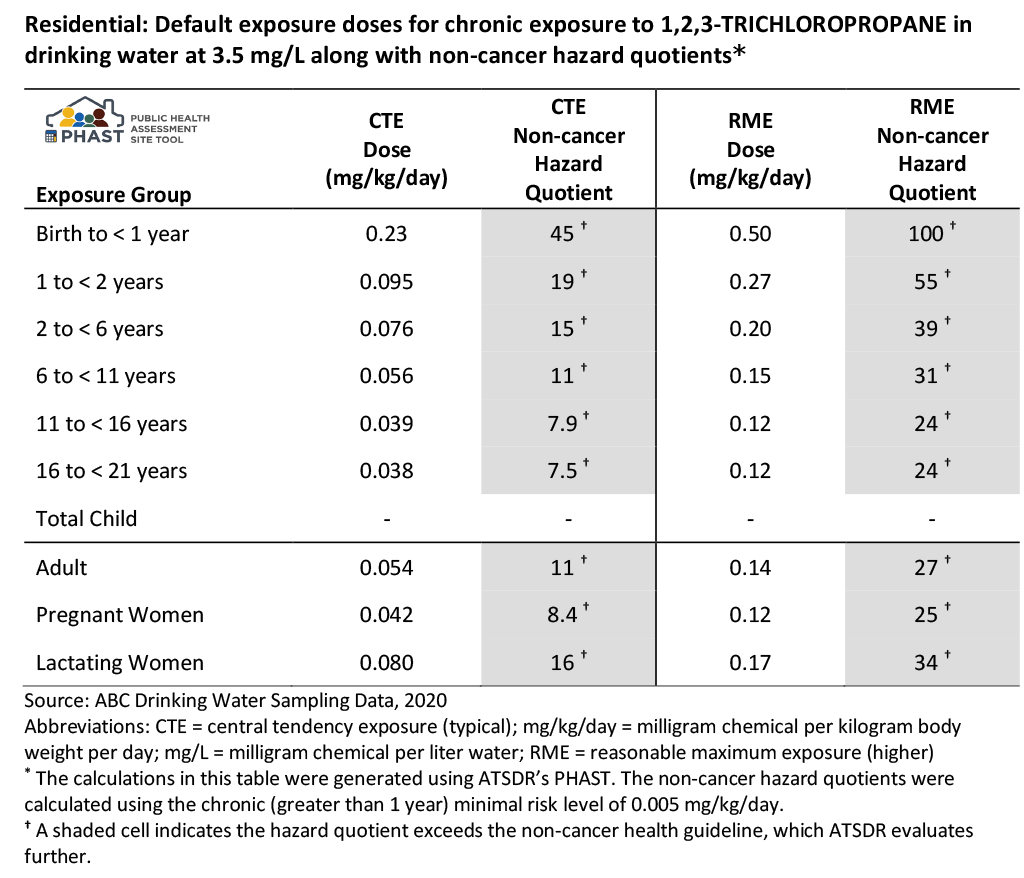
Let’s revisit the drinking water ingestion example for which you calculated HQs in the EPCs and Exposure Calculations Evaluation. In that example, a family was exposed in their home to contaminated drinking water daily, for an unknown number of years. The water has an EPC of 3.5 mg/L for 1,2,3-trichloropropane. You do not know the number of residents of the home or their ages.
Because you do not have specific information on the residents, PHAST was run using default exposure groups, which incorporates default body weights and default intake rates, to generate non-cancer HQs (see table). Note that this section discusses the HQs generated in PHAST for this example. For the discussion of CRs, refer to the section here.
Based on this example scenario, ATSDR would further evaluate the potential for non-cancer effects because either the CTE or RME HQs or both are above 1. Always use professional judgment and consider site-specific scenarios to determine whether evaluating CTE and RME is appropriate. Always report both the CTE and RME unless you have specific information that only the CTE applies.
Description of Non-cancer Example PHAST Results Table
As shown in the table’s footnotes above, PHAST calculated the non-cancer HQs using the chronic ATSDR MRL of 0.005 mg/kg/day. ATSDR has documented all information related to developing this non-cancer health guideline (i.e., the MRL) in the Toxicological Profile for 1,2,3-Trichloropropane [PDF – 2.4 MB].
The table below is a guide for the information you would pull from the studies used to develop the MRL. To populate the table for this chronic exposure scenario, use ATSDR’s Toxicological Profile for 1,2,3-Trichloropropane [PDF – 2.4 MB]. You could also refer to the CVs and Health Guidelines Module in PHAST.
Chronic Oral Exposure Data from Key Studies for Non-Cancer Health Effects for 1,2,3-Trichloropropane
| Parameter | Data for Non-Cancer Health Effects |
|---|---|
| Health guideline | MRL: 0.005 mg/kg/day |
| Information source | Tox Profile for 1,2,3-trichloropropane [PDF – 2.4 MB] |
| Study reference for health guideline | NTP. 1993. Toxicology and carcinogenesis studies of 1,2,3-trichloropropane (CAS No. 96-18-4) in F344/N rats and B6C3F1 mice (gavage studies). National Toxicology Program Tech Rep Ser 384. |
| Exposure route and duration evaluated | Oral, chronic |
| NOAEL, if reported (include units) | 3 mg/kg/day |
| LOAEL, if reported (include units) | 10 mg/kg/day |
| Observed effects | Bile duct hyperplasia (critical effect) |
| Species on which observed-effect is based | Rats |
| Dosing method and exposure medium | Corn oil by gavage |
| Point of departure (POD) | BMDL10,ADJ of 0.47 mg/kg/day. Details include:
|
| Uncertainty factors (UF) | 100 (10 for extrapolation from animals to humans and 10 for human variability) |
| MRL calculation | BMDL10 ÷ UFs = MRL
0.47 mg/kg/day ÷ (10 x 10) = 0.005 mg/kg/day |